| Param | Original file | Final file |
|---|---|---|
| Filename | modeM0/AS1C09_003T01_9000006442_50213cztM0_level2.fits | modeM0/AS1C09_003T01_9000006442_50213cztM0_level2_quad_clean.evt |
| Size (bytes) | 1,043,187,840 | 64,272,960 |
| Size | 994.9 MB | 61.3 MB |
| Events in quadrant A | 6,412,644 | 541,517 |
| Events in quadrant B | 4,620,389 | 642,421 |
| Events in quadrant C | 14,259,833 | 91,090 |
| Events in quadrant D | 12,813,829 | 211,726 |
| Mode M9 | |||
|---|---|---|---|
| Quadrant | BADHDUFLAG | Total packets | Discarded packets |
| A | 0 | 9 | 0 |
| B | 0 | 9 | 0 |
| C | 0 | 9 | 0 |
| D | 0 | 9 | 0 |
| Mode M0 | |||
|---|---|---|---|
| Quadrant | BADHDUFLAG | Total packets | Discarded packets |
| A | 0 | 23586 | 1 |
| B | 0 | 18317 | 1 |
| C | 0 | 46820 | 1 |
| D | 0 | 42633 | 1 |
| Mode SS | |||
|---|---|---|---|
| Quadrant | BADHDUFLAG | Total packets | Discarded packets |
| A | 0 | 134 | 0 |
| B | 0 | 134 | 0 |
| C | 0 | 134 | 0 |
| D | 0 | 134 | 0 |
| Quadrant | Total seconds | Saturated seconds | Saturation percentage |
|---|---|---|---|
| A | 6579 | 892 | 13.558292% |
| B | 6580 | 330 | 5.015198% |
| C | 6580 | 5698 | 86.595745% |
| D | 6580 | 4343 | 66.003040% |
Noise dominated data is calculated using 1-second bins in cleaned event files. If a bin has >2000 counts, and if more than 50% of those come from <1% of pixels, then it is considered to be noise-dominated and hence unusable.
| Quadrant | # 1 sec bins | Bins with >0 counts | Bins with >2000 counts | High rate bins dominated by noise | Noise dominated (total time) | Noise dominated (detector-on time) | Marked lightcurve |
|---|---|---|---|---|---|---|---|
| A | 7479 | 6579 | 778 | 778 | 10.40% | 11.83% | 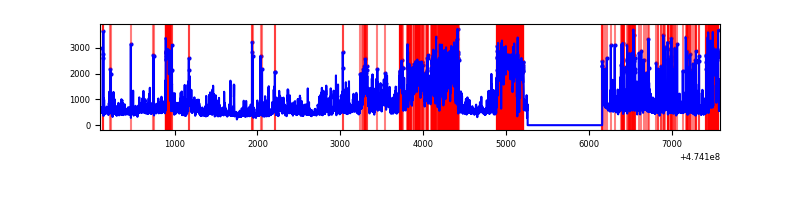 |
| B | 7480 | 6580 | 193 | 193 | 2.58% | 2.93% | 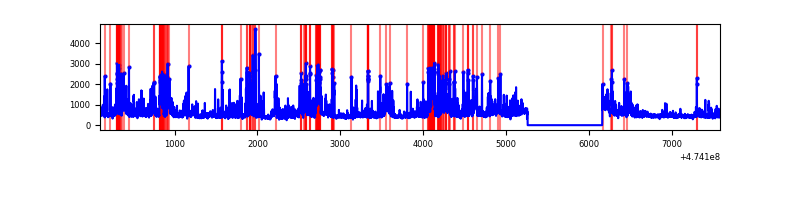 |
| C | 7480 | 6580 | 4817 | 4817 | 64.40% | 73.21% | 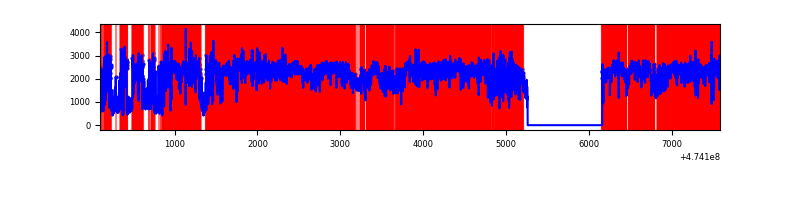 |
| D | 7479 | 6579 | 3188 | 3188 | 42.63% | 48.46% | 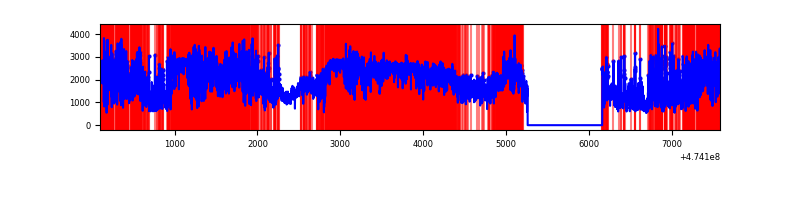 |
Top three noisy pixels from each quadrant. If the there are fewer than three noisy pixels in the level2.evt file, extra rows are filled as -1
| Pixel properties | Quadrant properties | ||||||
|---|---|---|---|---|---|---|---|
| Quadrant | DetID | PixID | Counts | Sigma | Mean | Median | Sigma |
| A | 0 | 98 | 1767237 | 10756.69 | 660 | 643 | 164.2 |
| A | 3 | 231 | 420937 | 2559.15 | 660 | 643 | 164.2 |
| A | 8 | 38 | 387075 | 2352.96 | 660 | 643 | 164.2 |
| B | 4 | 206 | 1212865 | 8309.65 | 680 | 656 | 145.9 |
| B | 3 | 249 | 231745 | 1584.11 | 680 | 656 | 145.9 |
| B | 8 | 128 | 95176 | 647.93 | 680 | 656 | 145.9 |
| C | 4 | 111 | 10108987 | 139969.98 | 250 | 248 | 72.2 |
| C | 15 | 197 | 1104641 | 15291.9 | 250 | 248 | 72.2 |
| C | 15 | 213 | 948566 | 13130.82 | 250 | 248 | 72.2 |
| D | 7 | 61 | 4117893 | 35683.58 | 398 | 385 | 115.4 |
| D | 11 | 245 | 1306870 | 11322.4 | 398 | 385 | 115.4 |
| D | 15 | 108 | 1196171 | 10363.05 | 398 | 385 | 115.4 |
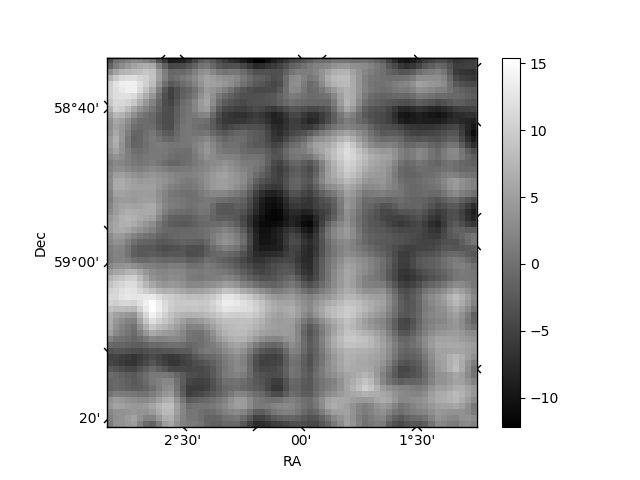
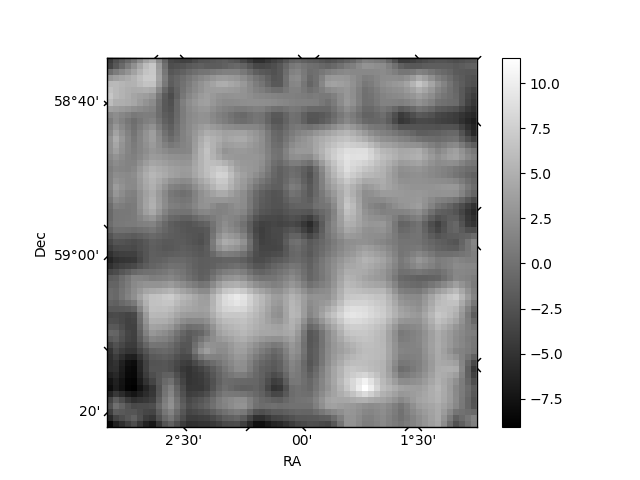
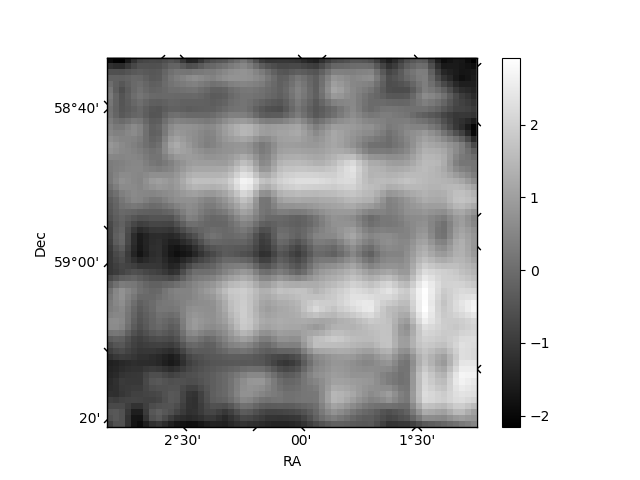
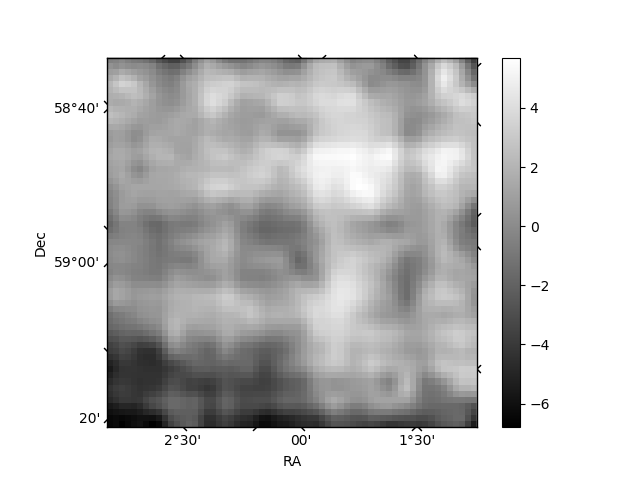
Histogram calculated using DETX and DETY for each event in the final _common_clean file
| Quadrant A | 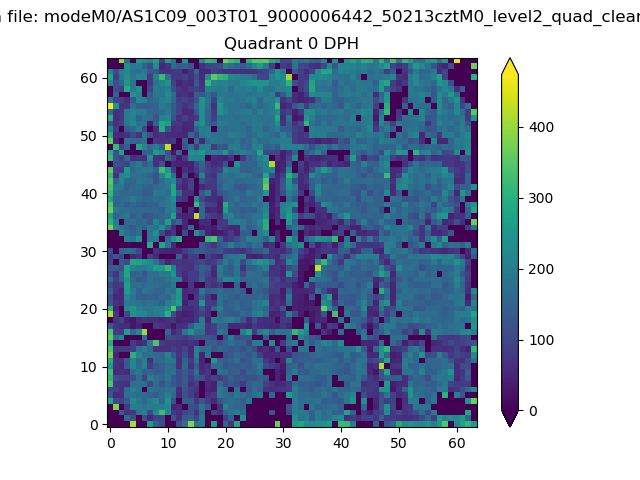 |
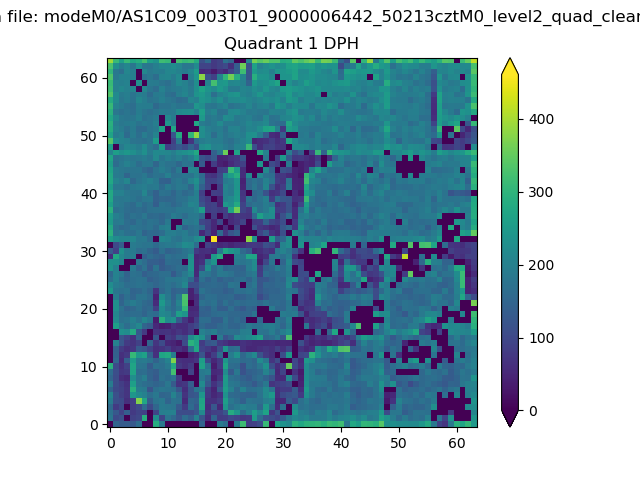 |
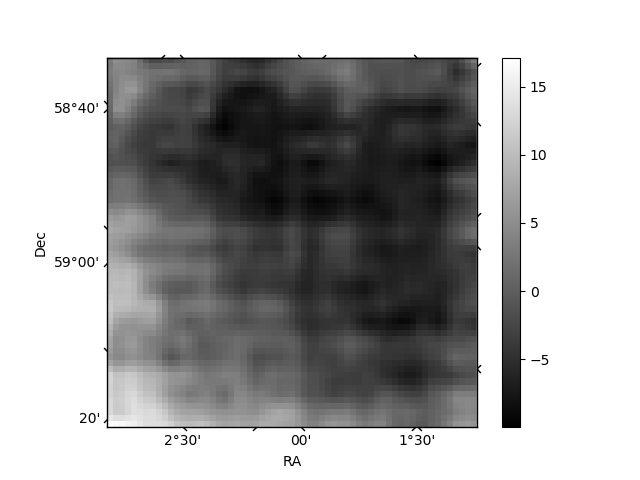
Quadrant B |
|---|---|---|---|
| Quadrant D | 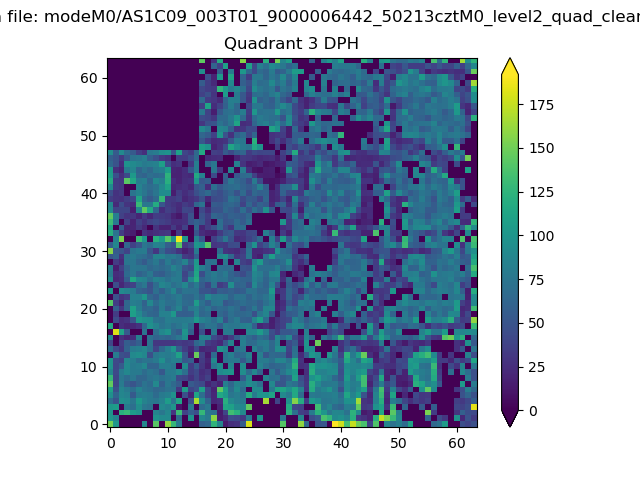 |
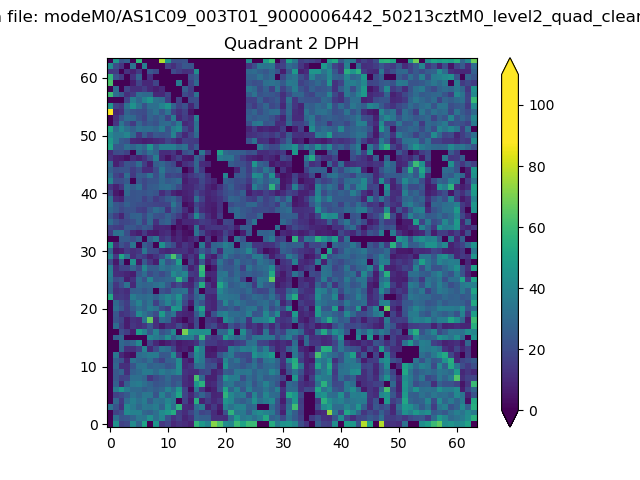 |
Quadrant C |
| Plot type | Count rate plots | Images |
|---|---|---|
| Comparison with Poisson distribution Blue bars denote a histogram of data divided into 1 sec bins. Red curve is a Poisson curve with rate = median count rate of data. |
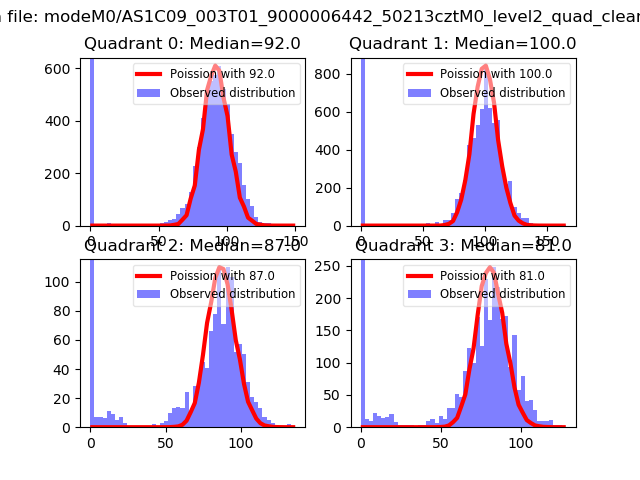 |
 |
| Quadrant-wise count rates Data is divided into 100 sec bins |
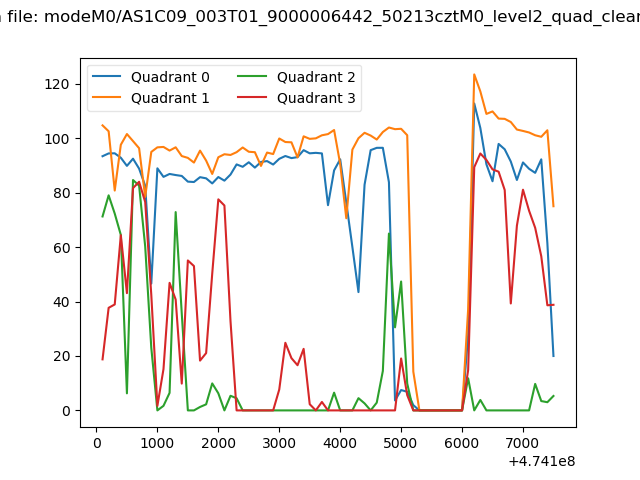 |
|
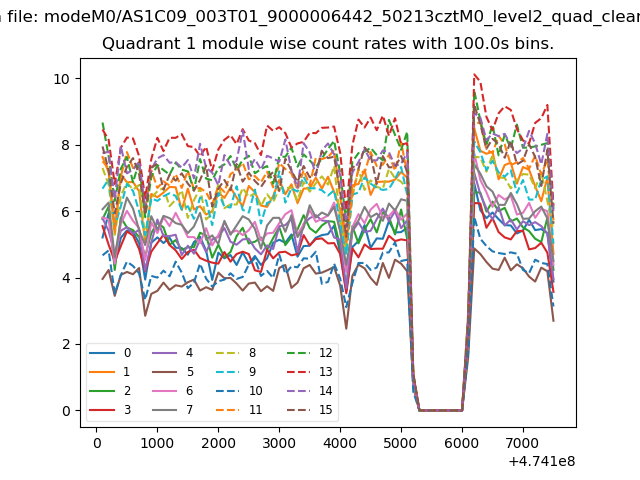
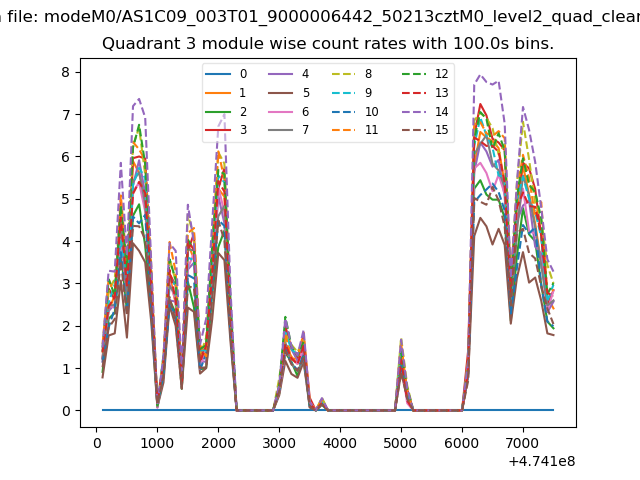
| Module-wise count rates for Quadrant A Data is divided into 100 sec bins |
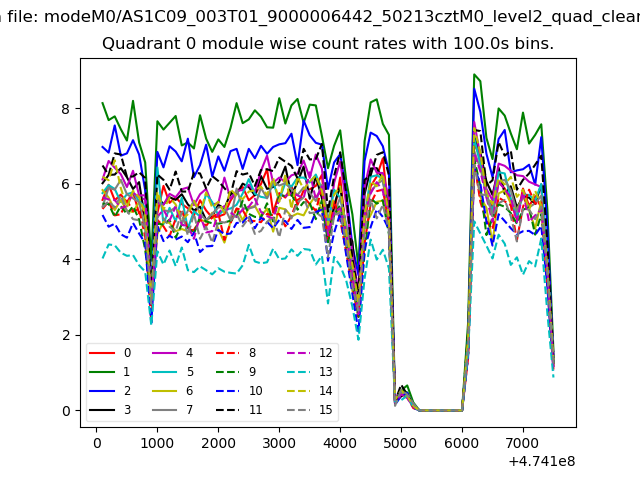 |
 |
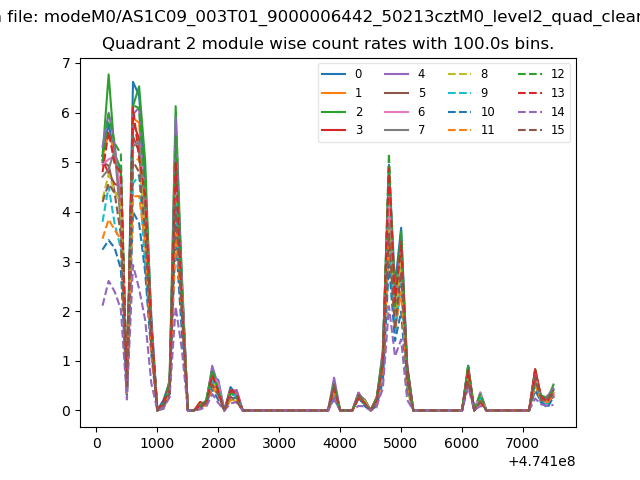
| Module-wise count rates for Quadrant B Data is divided into 100 sec bins |
 |
 |
| Module-wise count rates for Quadrant C Data is divided into 100 sec bins |
 |
 |
| Module-wise count rates for Quadrant D Data is divided into 100 sec bins |
 |
 |
| Parameter | Plot |
|---|---|
| CZT HV Monitor | 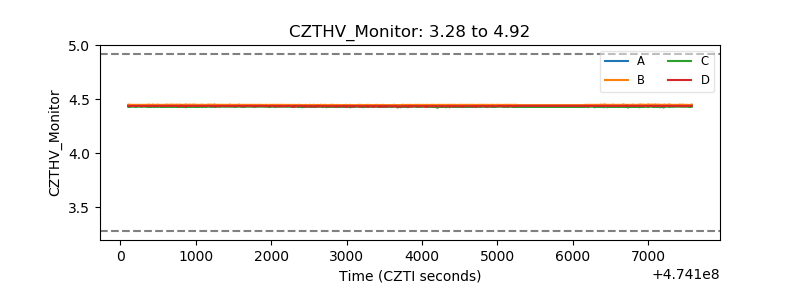 |
| D_VDD | 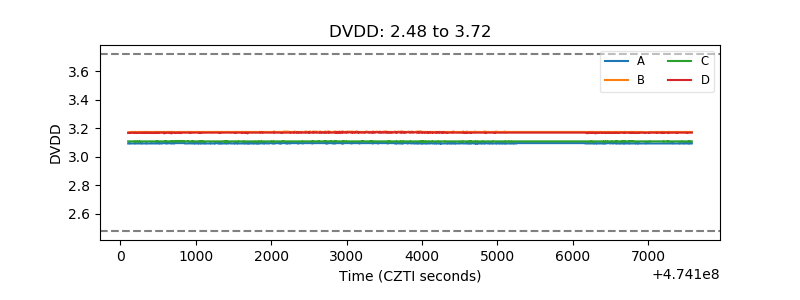 |
| Temperature 1 | 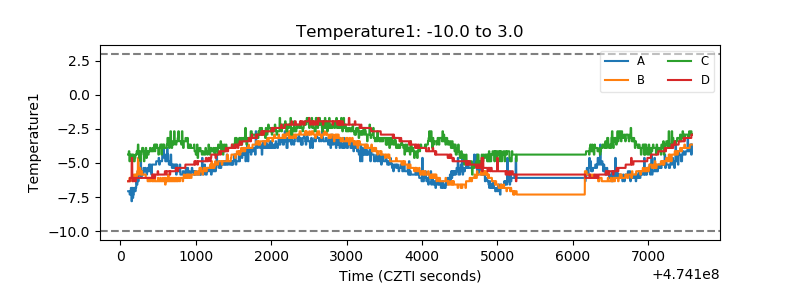 |
| Veto HV Monitor | 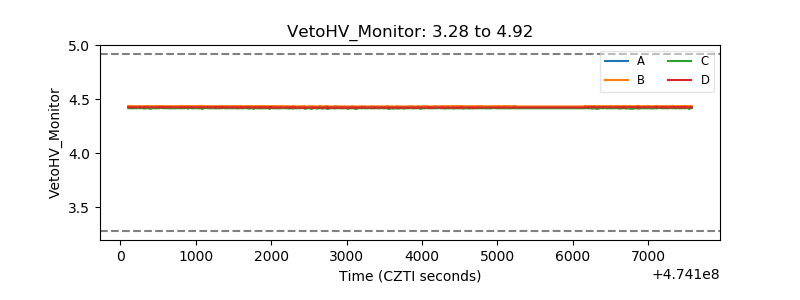 |
| Veto LLD | 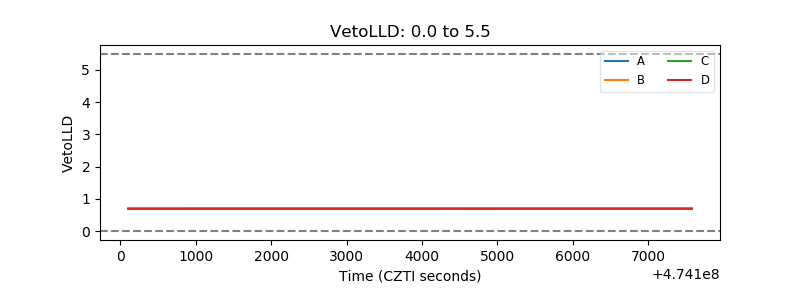 |
| Alpha Counter | 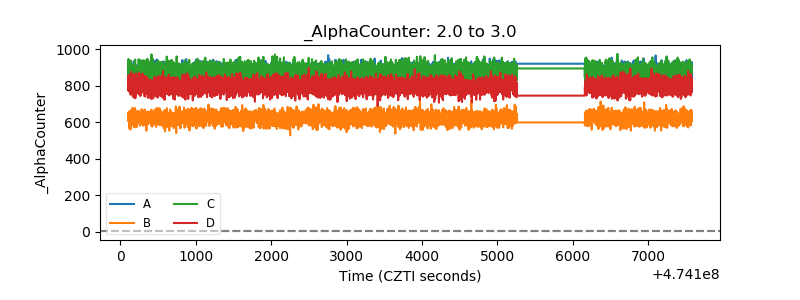 |
| _CPM_Rate | 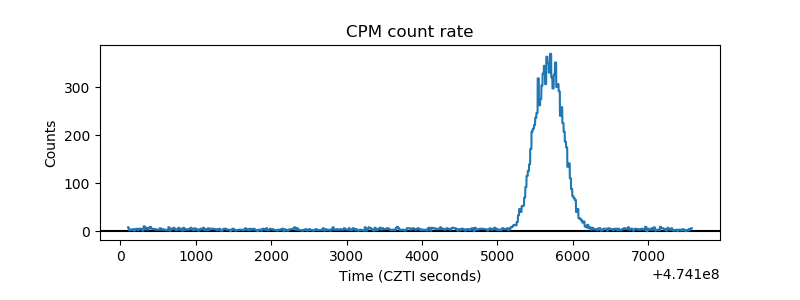 |
| CZT Counter | 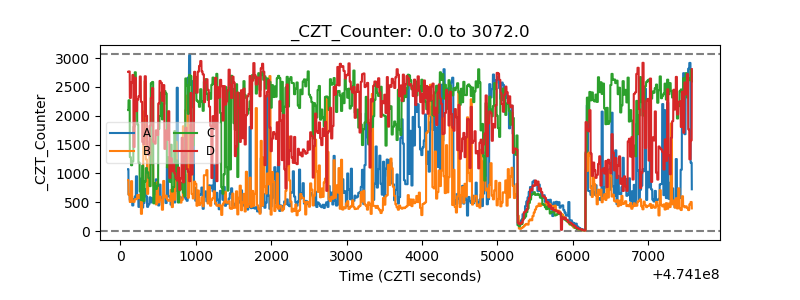 |
| +2.5 Volts monitor |  |
| +5 Volts monitor | 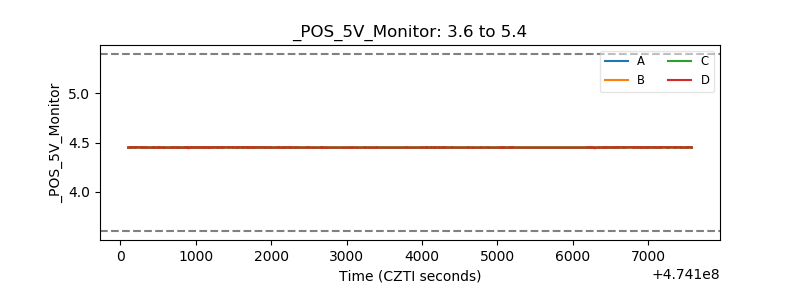 |
| _ROLL_ROT | 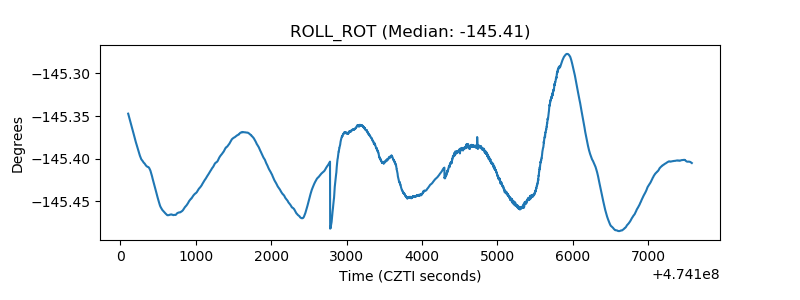 |
| _Roll_DEC | 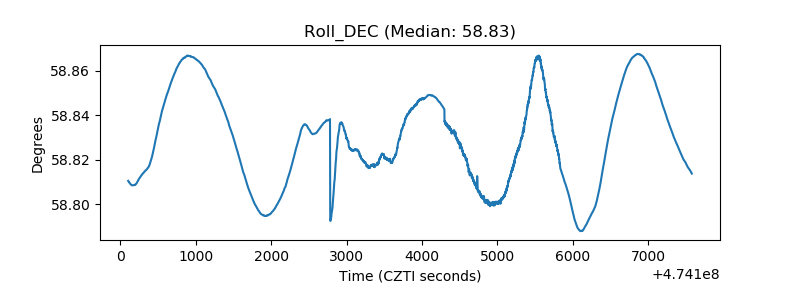 |
| _Roll_RA | 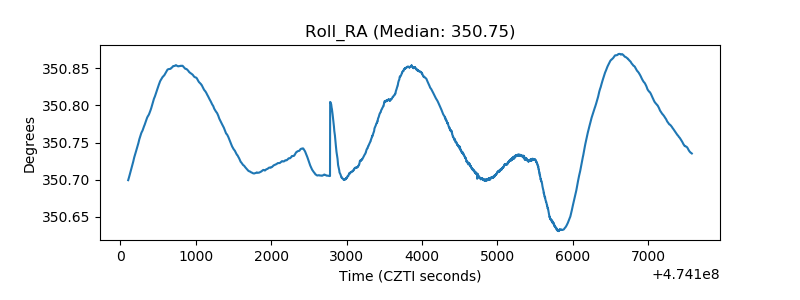 |
| Veto Counter | 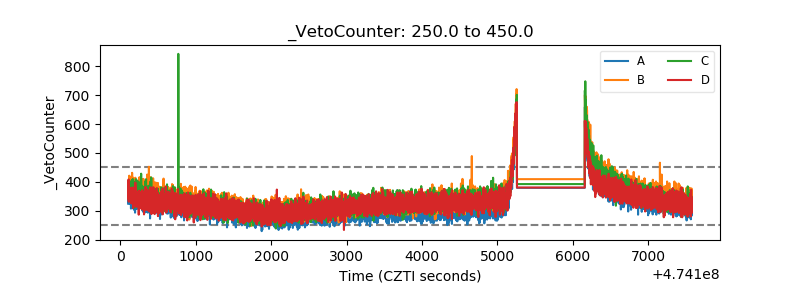 |