| Param | Original file | Final file |
|---|---|---|
| Filename | modeM0/AS1C09_003T01_9000006442_50215cztM0_level2.fits | modeM0/AS1C09_003T01_9000006442_50215cztM0_level2_quad_clean.evt |
| Size (bytes) | 1,001,315,520 | 59,958,720 |
| Size | 954.9 MB | 57.2 MB |
| Events in quadrant A | 7,234,044 | 467,324 |
| Events in quadrant B | 4,073,765 | 597,407 |
| Events in quadrant C | 13,391,128 | 97,218 |
| Events in quadrant D | 11,909,868 | 239,666 |
| Mode M9 | |||
|---|---|---|---|
| Quadrant | BADHDUFLAG | Total packets | Discarded packets |
| A | 0 | 10 | 0 |
| B | 0 | 10 | 0 |
| C | 0 | 10 | 0 |
| D | 0 | 10 | 0 |
| Mode M0 | |||
|---|---|---|---|
| Quadrant | BADHDUFLAG | Total packets | Discarded packets |
| A | 0 | 25562 | 1 |
| B | 0 | 16147 | 1 |
| C | 0 | 43796 | 1 |
| D | 0 | 39440 | 1 |
| Mode SS | |||
|---|---|---|---|
| Quadrant | BADHDUFLAG | Total packets | Discarded packets |
| A | 0 | 120 | 0 |
| B | 0 | 120 | 0 |
| C | 0 | 120 | 0 |
| D | 0 | 120 | 0 |
| Quadrant | Total seconds | Saturated seconds | Saturation percentage |
|---|---|---|---|
| A | 5918 | 1341 | 22.659682% |
| B | 5918 | 280 | 4.731328% |
| C | 5919 | 5039 | 85.132624% |
| D | 5919 | 3536 | 59.739821% |
Noise dominated data is calculated using 1-second bins in cleaned event files. If a bin has >2000 counts, and if more than 50% of those come from <1% of pixels, then it is considered to be noise-dominated and hence unusable.
| Quadrant | # 1 sec bins | Bins with >0 counts | Bins with >2000 counts | High rate bins dominated by noise | Noise dominated (total time) | Noise dominated (detector-on time) | Marked lightcurve |
|---|---|---|---|---|---|---|---|
| A | 6938 | 5918 | 1211 | 1211 | 17.45% | 20.46% | 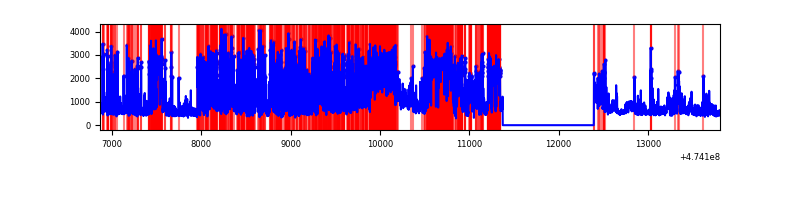 |
| B | 6938 | 5918 | 179 | 179 | 2.58% | 3.02% | 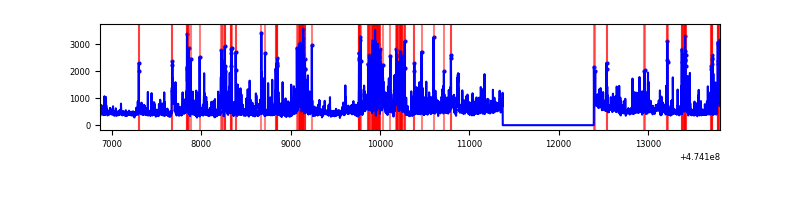 |
| C | 6939 | 5919 | 4706 | 4706 | 67.82% | 79.51% | 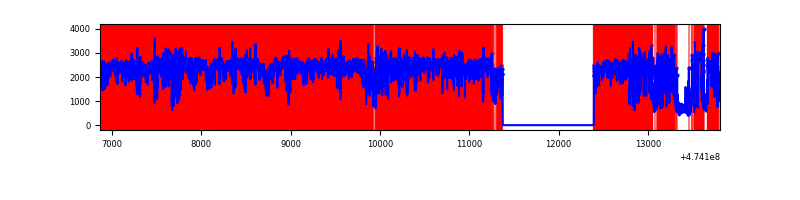 |
| D | 6938 | 5918 | 3538 | 3538 | 50.99% | 59.78% | 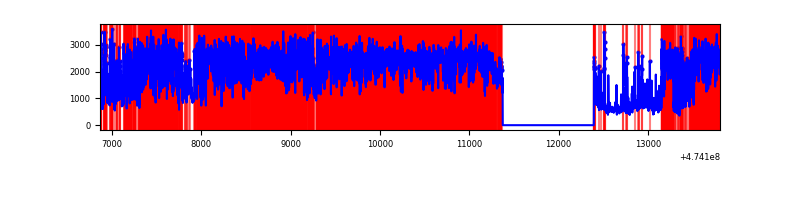 |
Top three noisy pixels from each quadrant. If the there are fewer than three noisy pixels in the level2.evt file, extra rows are filled as -1
| Pixel properties | Quadrant properties | ||||||
|---|---|---|---|---|---|---|---|
| Quadrant | DetID | PixID | Counts | Sigma | Mean | Median | Sigma |
| A | 3 | 231 | 1614791 | 11091.09 | 580 | 566 | 145.5 |
| A | 0 | 98 | 1145050 | 7863.57 | 580 | 566 | 145.5 |
| A | 10 | 253 | 430782 | 2955.95 | 580 | 566 | 145.5 |
| B | 4 | 206 | 856530 | 6552.2 | 613 | 592 | 130.6 |
| B | 3 | 249 | 245358 | 1873.68 | 613 | 592 | 130.6 |
| B | 6 | 203 | 108030 | 822.44 | 613 | 592 | 130.6 |
| C | 4 | 111 | 9886225 | 130179.74 | 263 | 261 | 75.9 |
| C | 15 | 197 | 882870 | 11622.32 | 263 | 261 | 75.9 |
| C | 15 | 213 | 388033 | 5106.24 | 263 | 261 | 75.9 |
| D | 7 | 61 | 3320766 | 24706.34 | 466 | 449 | 134.4 |
| D | 15 | 108 | 1763399 | 13118.04 | 466 | 449 | 134.4 |
| D | 12 | 6 | 685477 | 5097.26 | 466 | 449 | 134.4 |
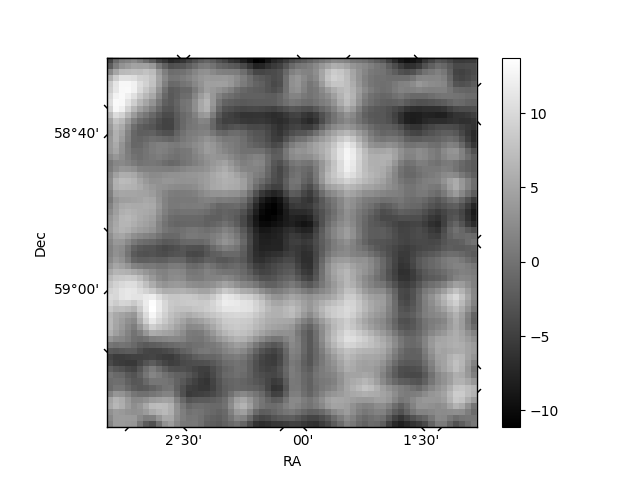
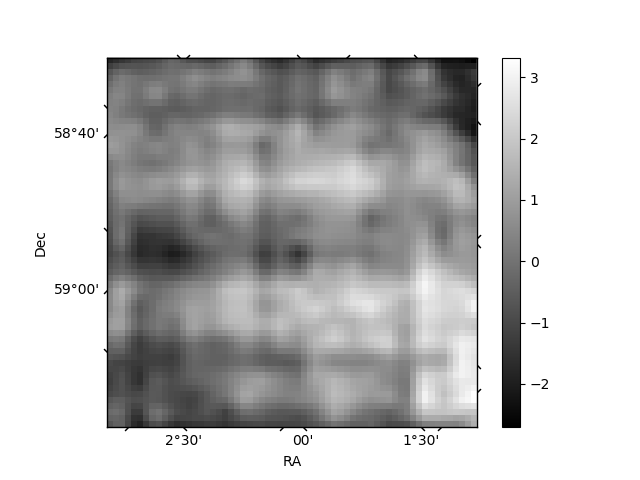
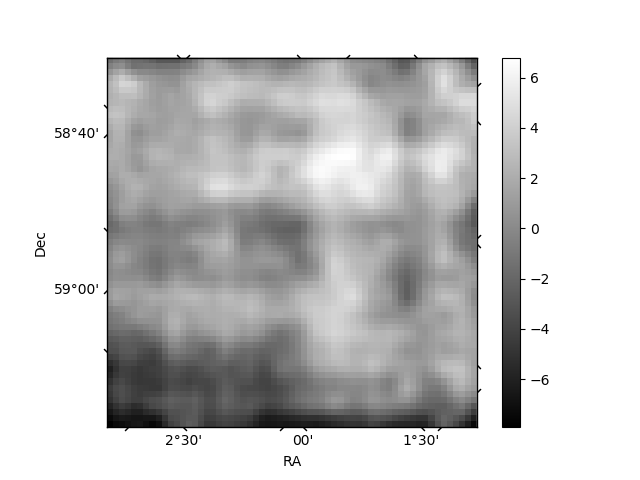
Histogram calculated using DETX and DETY for each event in the final _common_clean file
| Quadrant A | 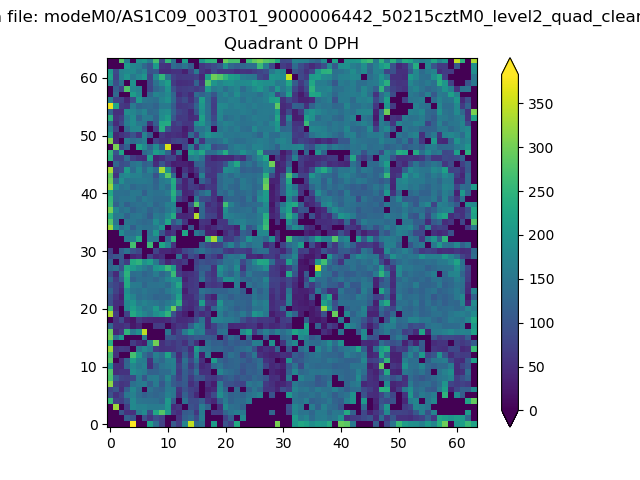 |
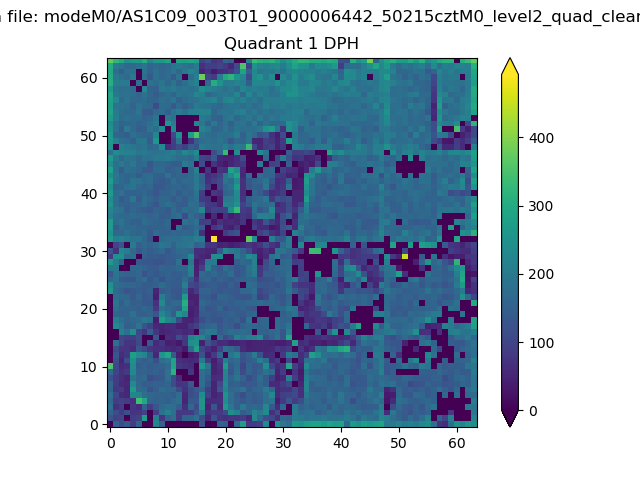 |
Quadrant B |
|---|---|---|---|
| Quadrant D | 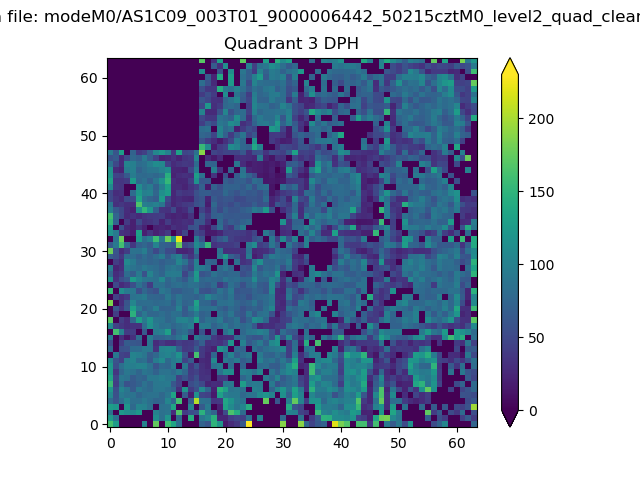 |
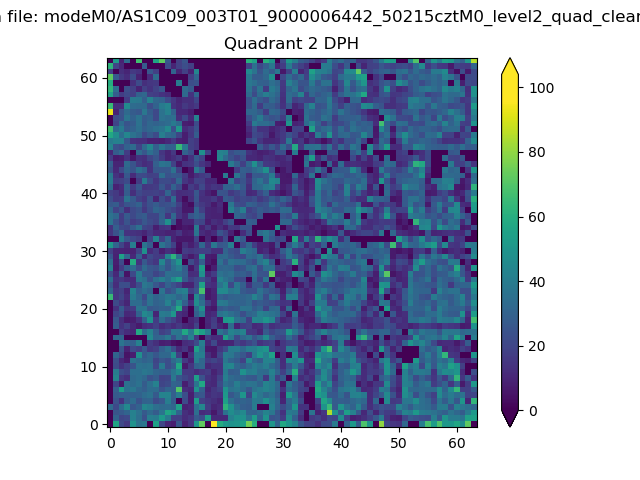 |
Quadrant C |
| Plot type | Count rate plots | Images |
|---|---|---|
| Comparison with Poisson distribution Blue bars denote a histogram of data divided into 1 sec bins. Red curve is a Poisson curve with rate = median count rate of data. |
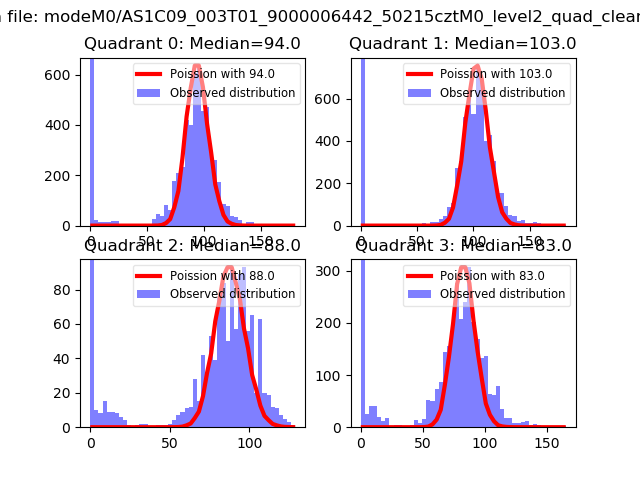 |
 |
| Quadrant-wise count rates Data is divided into 100 sec bins |
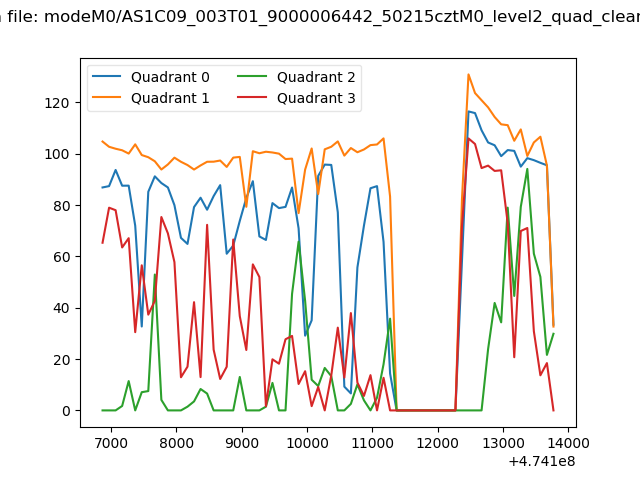 |
|
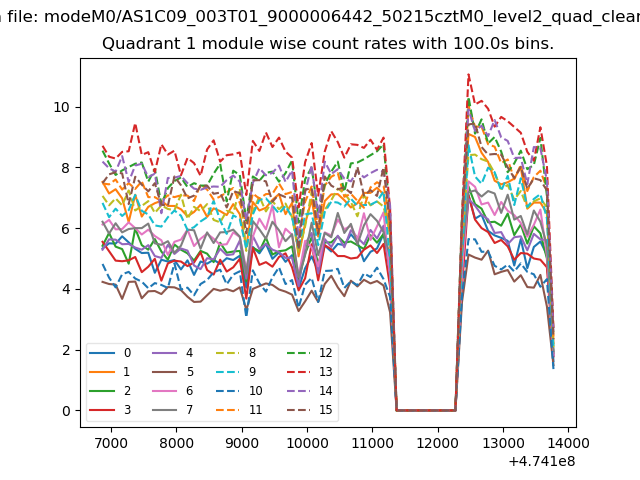
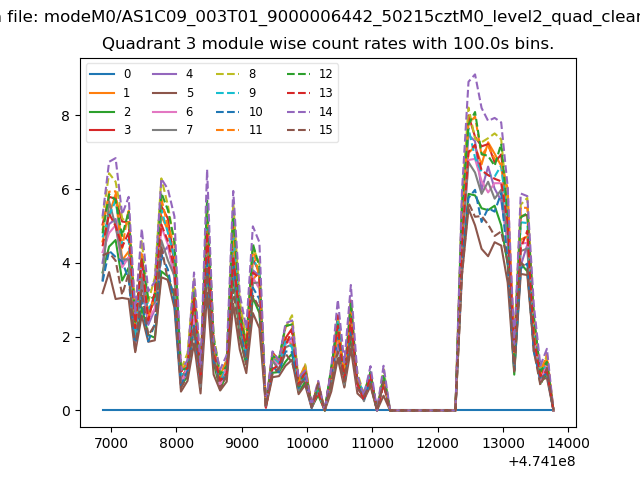
| Module-wise count rates for Quadrant A Data is divided into 100 sec bins |
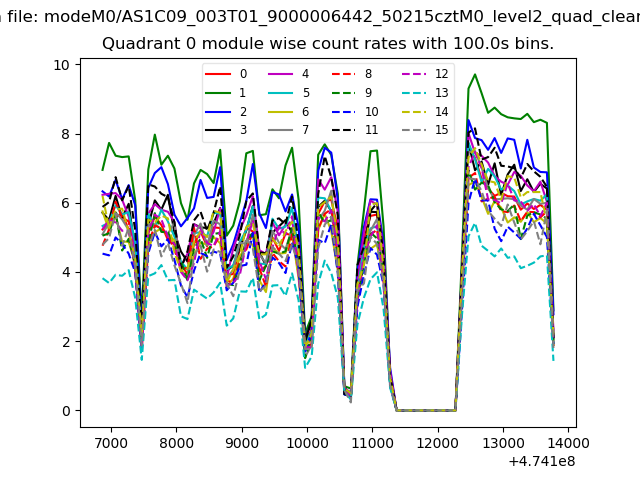 |
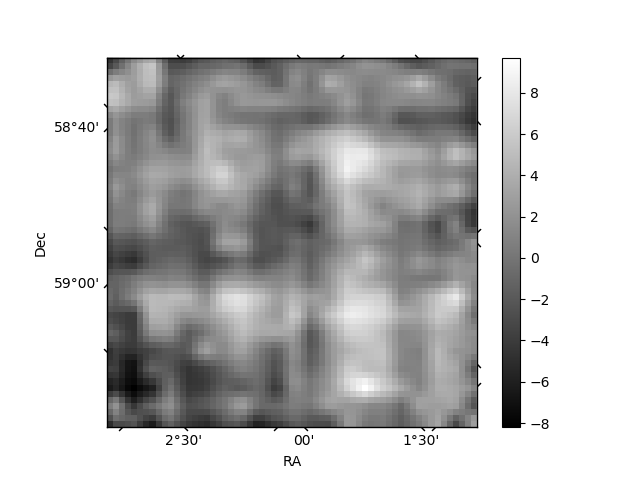 |
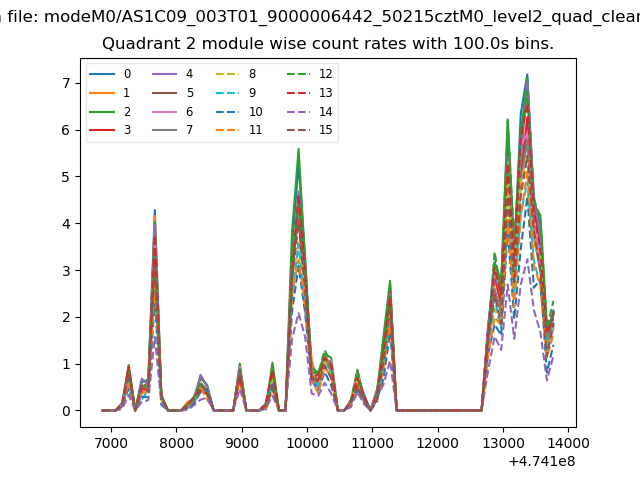
| Module-wise count rates for Quadrant B Data is divided into 100 sec bins |
 |
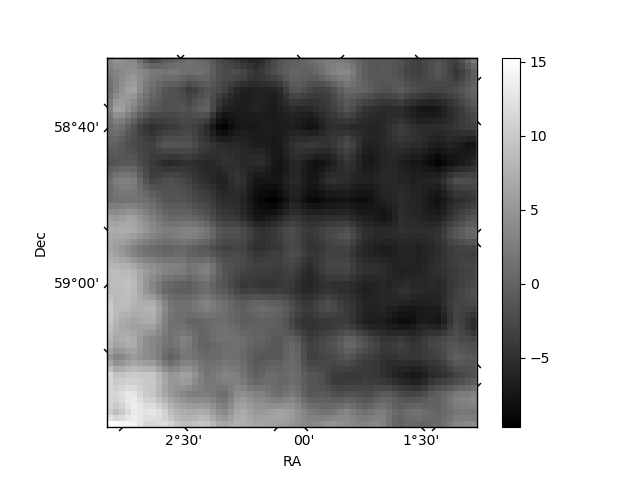 |
| Module-wise count rates for Quadrant C Data is divided into 100 sec bins |
 |
 |
| Module-wise count rates for Quadrant D Data is divided into 100 sec bins |
 |
 |
| Parameter | Plot |
|---|---|
| CZT HV Monitor | 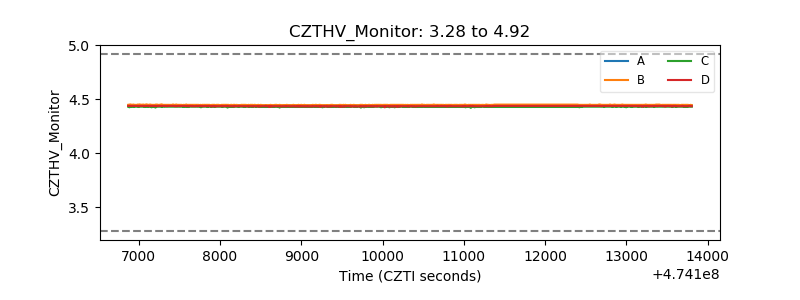 |
| D_VDD | 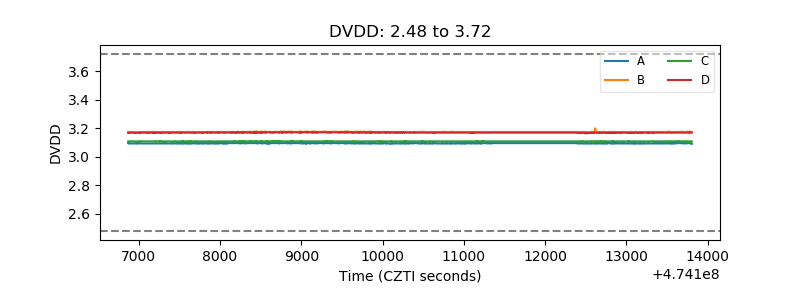 |
| Temperature 1 | 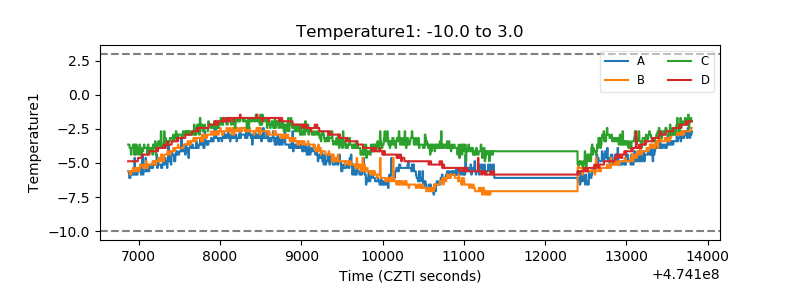 |
| Veto HV Monitor | 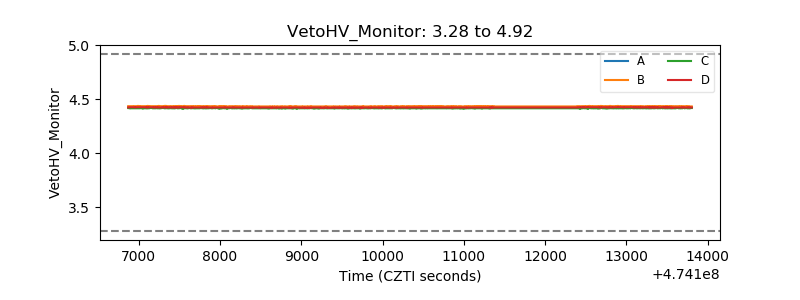 |
| Veto LLD | 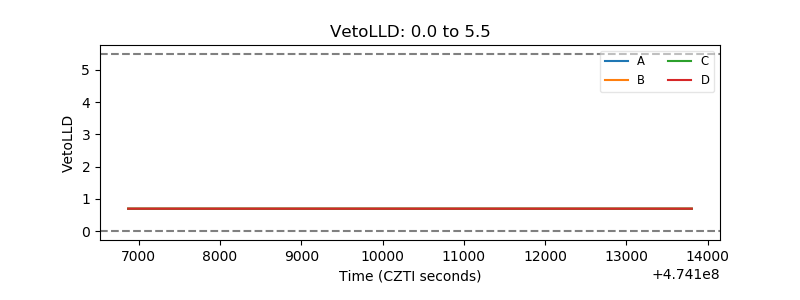 |
| Alpha Counter | 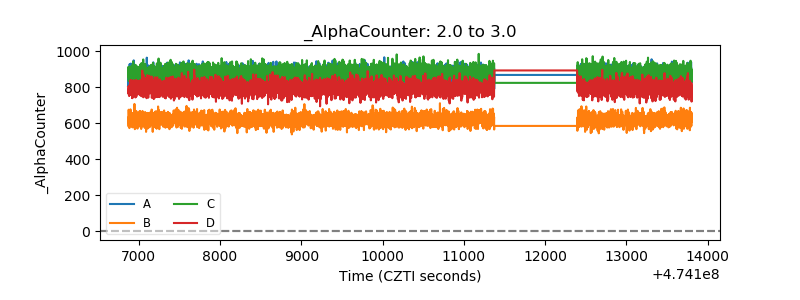 |
| _CPM_Rate | 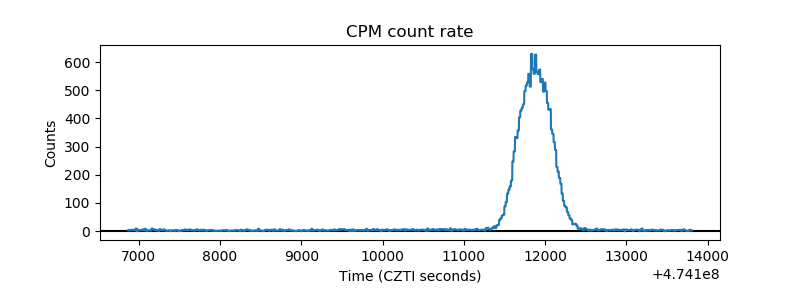 |
| CZT Counter | 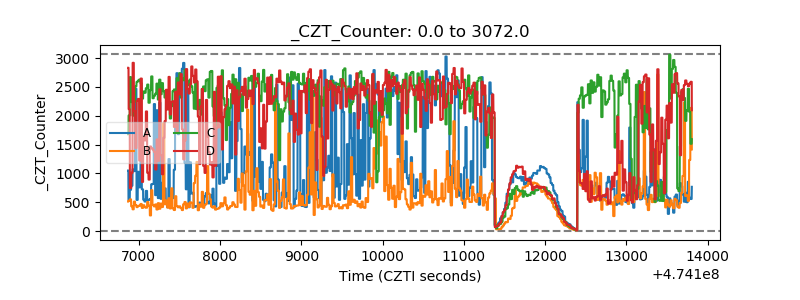 |
| +2.5 Volts monitor | 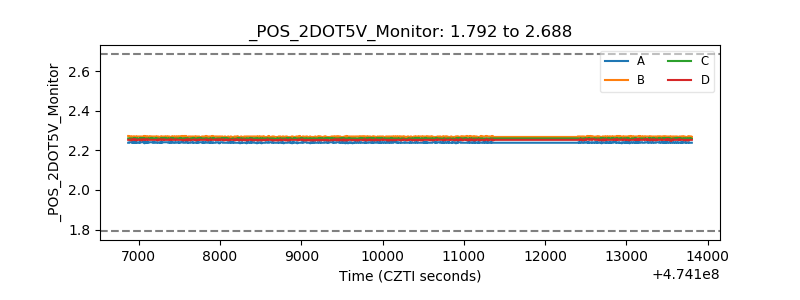 |
| +5 Volts monitor |  |
| _ROLL_ROT | 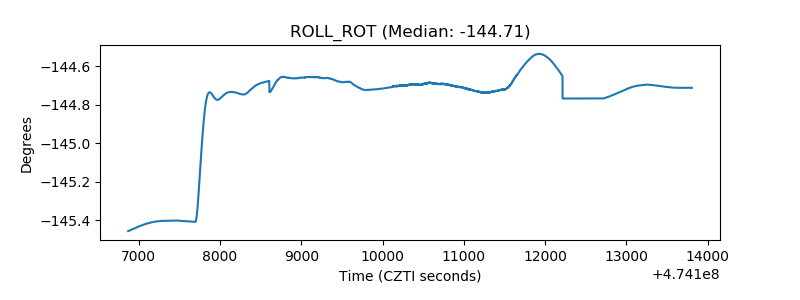 |
| _Roll_DEC | 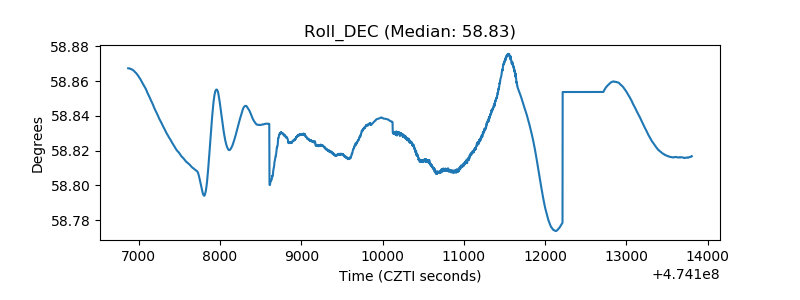 |
| _Roll_RA | 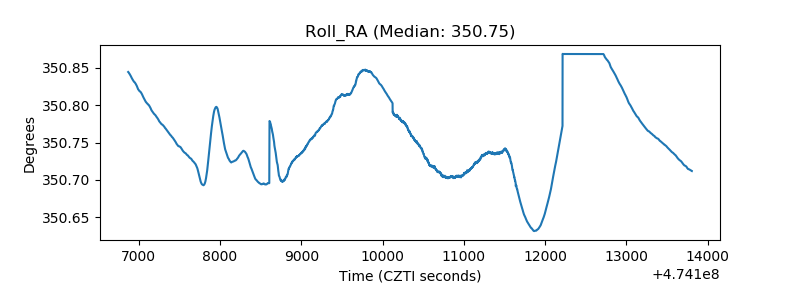 |
| Veto Counter | 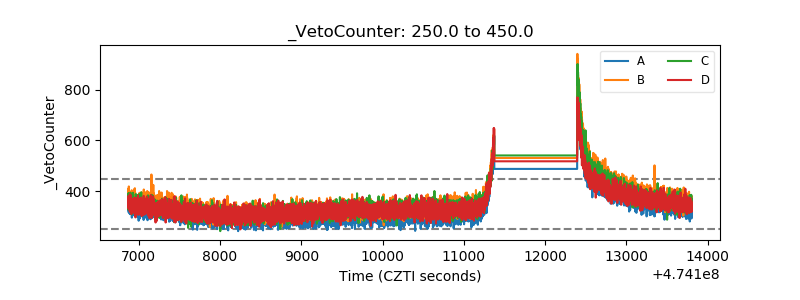 |