| Param | Original file | Final file |
|---|---|---|
| Filename | modeM0/AS1C09_003T01_9000006442_50216cztM0_level2.fits | modeM0/AS1C09_003T01_9000006442_50216cztM0_level2_quad_clean.evt |
| Size (bytes) | 960,946,560 | 65,269,440 |
| Size | 916.4 MB | 62.2 MB |
| Events in quadrant A | 5,576,754 | 578,613 |
| Events in quadrant B | 4,282,431 | 646,825 |
| Events in quadrant C | 13,073,764 | 170,348 |
| Events in quadrant D | 12,157,409 | 146,597 |
| Mode M9 | |||
|---|---|---|---|
| Quadrant | BADHDUFLAG | Total packets | Discarded packets |
| A | 0 | 12 | 0 |
| B | 0 | 12 | 0 |
| C | 0 | 12 | 0 |
| D | 0 | 12 | 0 |
| Mode M0 | |||
|---|---|---|---|
| Quadrant | BADHDUFLAG | Total packets | Discarded packets |
| A | 0 | 20900 | 1 |
| B | 0 | 16927 | 1 |
| C | 0 | 43076 | 1 |
| D | 0 | 40363 | 1 |
| Mode SS | |||
|---|---|---|---|
| Quadrant | BADHDUFLAG | Total packets | Discarded packets |
| A | 0 | 126 | 0 |
| B | 0 | 126 | 0 |
| C | 0 | 126 | 0 |
| D | 0 | 126 | 0 |
| Quadrant | Total seconds | Saturated seconds | Saturation percentage |
|---|---|---|---|
| A | 6214 | 503 | 8.094625% |
| B | 6214 | 261 | 4.200193% |
| C | 6215 | 4600 | 74.014481% |
| D | 6215 | 4759 | 76.572808% |
Noise dominated data is calculated using 1-second bins in cleaned event files. If a bin has >2000 counts, and if more than 50% of those come from <1% of pixels, then it is considered to be noise-dominated and hence unusable.
| Quadrant | # 1 sec bins | Bins with >0 counts | Bins with >2000 counts | High rate bins dominated by noise | Noise dominated (total time) | Noise dominated (detector-on time) | Marked lightcurve |
|---|---|---|---|---|---|---|---|
| A | 7344 | 6214 | 345 | 345 | 4.70% | 5.55% | 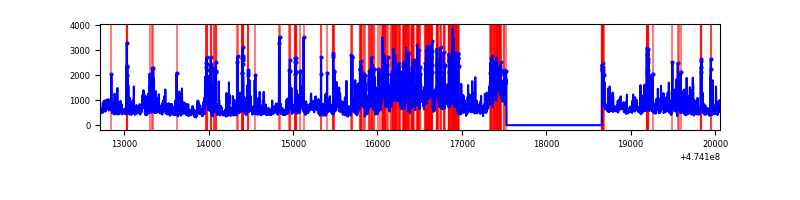 |
| B | 7344 | 6214 | 152 | 152 | 2.07% | 2.45% | 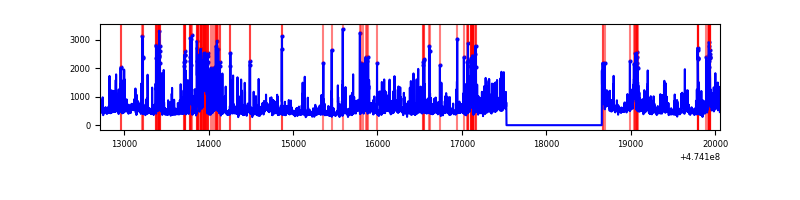 |
| C | 7344 | 6214 | 4126 | 4126 | 56.18% | 66.40% | 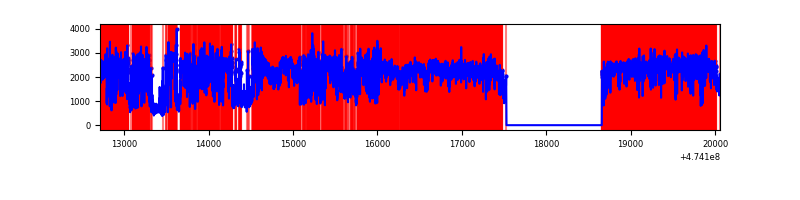 |
| D | 7344 | 6214 | 3659 | 3659 | 49.82% | 58.88% | 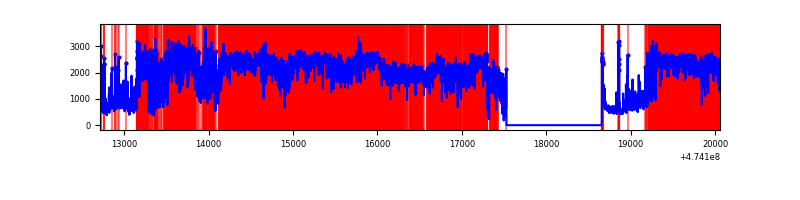 |
Top three noisy pixels from each quadrant. If the there are fewer than three noisy pixels in the level2.evt file, extra rows are filled as -1
| Pixel properties | Quadrant properties | ||||||
|---|---|---|---|---|---|---|---|
| Quadrant | DetID | PixID | Counts | Sigma | Mean | Median | Sigma |
| A | 11 | 7 | 821170 | 5091.49 | 654 | 637 | 161.2 |
| A | 12 | 250 | 596697 | 3698.62 | 654 | 637 | 161.2 |
| A | 4 | 156 | 454487 | 2816.19 | 654 | 637 | 161.2 |
| B | 4 | 206 | 962153 | 6930.08 | 656 | 635 | 138.7 |
| B | 5 | 172 | 210581 | 1513.17 | 656 | 635 | 138.7 |
| B | 0 | 155 | 88217 | 631.24 | 656 | 635 | 138.7 |
| C | 4 | 111 | 7319798 | 74922.2 | 347 | 345 | 97.7 |
| C | 15 | 197 | 1918531 | 19634.62 | 347 | 345 | 97.7 |
| C | 15 | 182 | 766899 | 7846.48 | 347 | 345 | 97.7 |
| D | 7 | 61 | 6700768 | 77023.9 | 297 | 287 | 87.0 |
| D | 15 | 108 | 1024179 | 11769.92 | 297 | 287 | 87.0 |
| D | 7 | 45 | 719376 | 8266.13 | 297 | 287 | 87.0 |
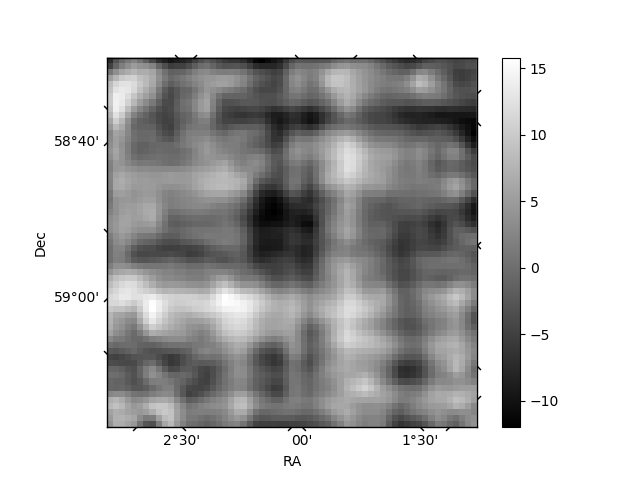
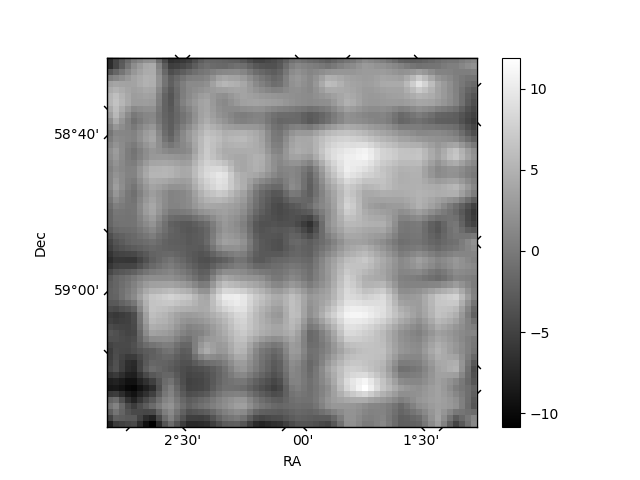
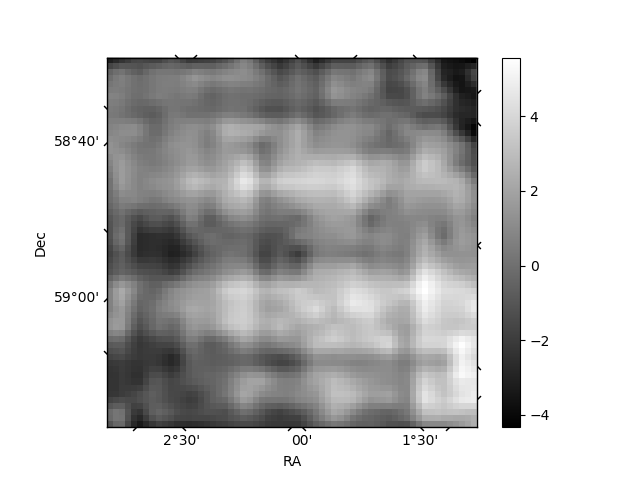
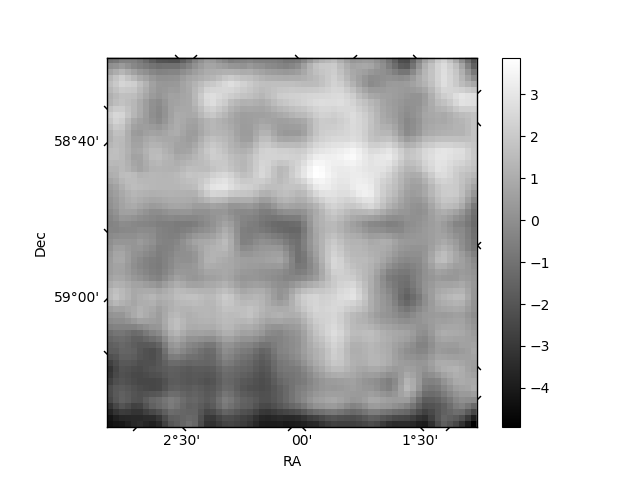
Histogram calculated using DETX and DETY for each event in the final _common_clean file
| Quadrant A | 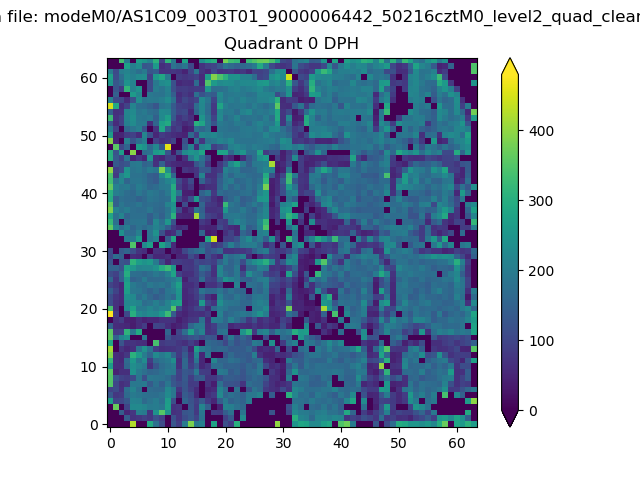 |
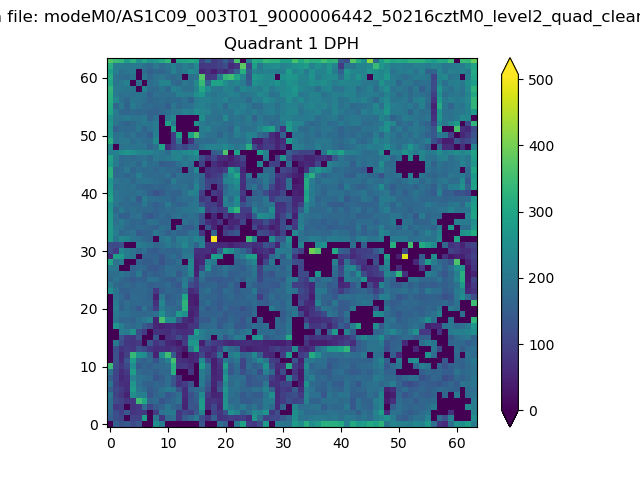 |
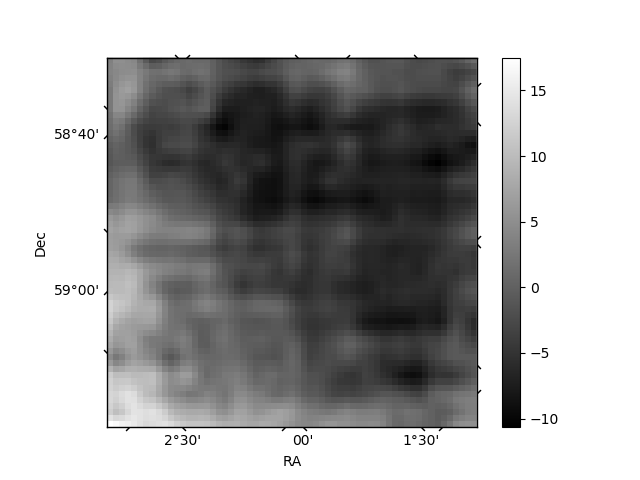
Quadrant B |
|---|---|---|---|
| Quadrant D | 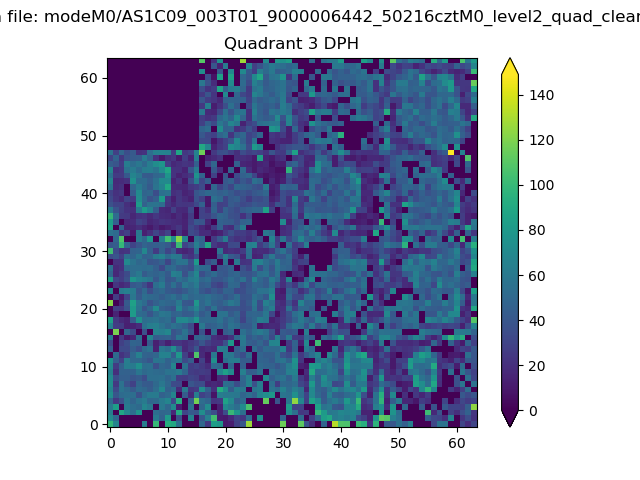 |
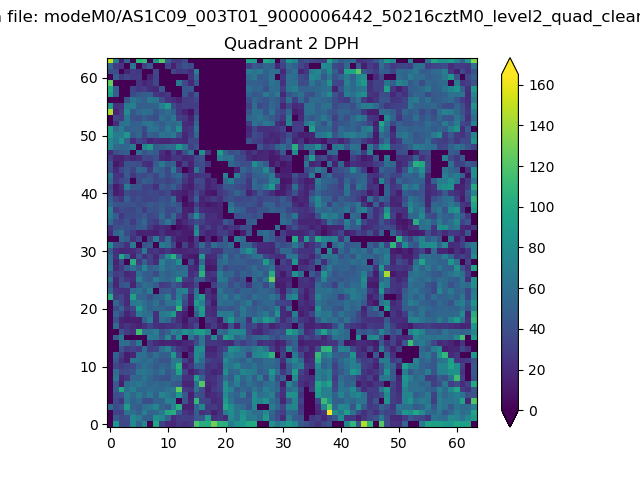 |
Quadrant C |
| Plot type | Count rate plots | Images |
|---|---|---|
| Comparison with Poisson distribution Blue bars denote a histogram of data divided into 1 sec bins. Red curve is a Poisson curve with rate = median count rate of data. |
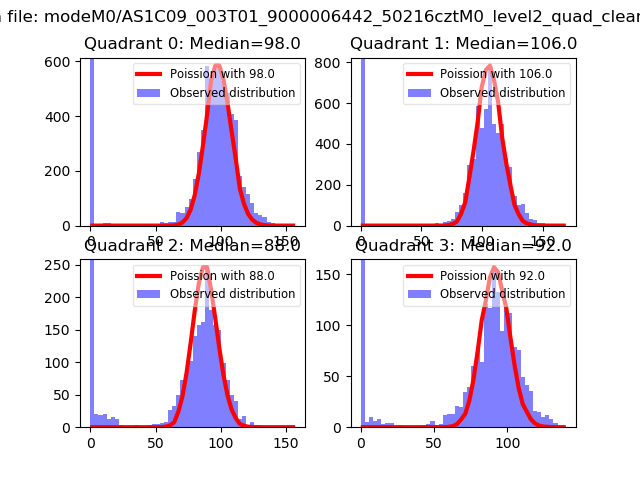 |
 |
| Quadrant-wise count rates Data is divided into 100 sec bins |
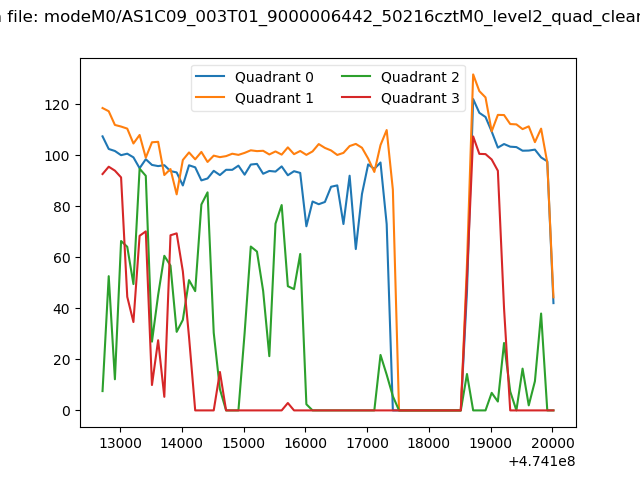 |
|
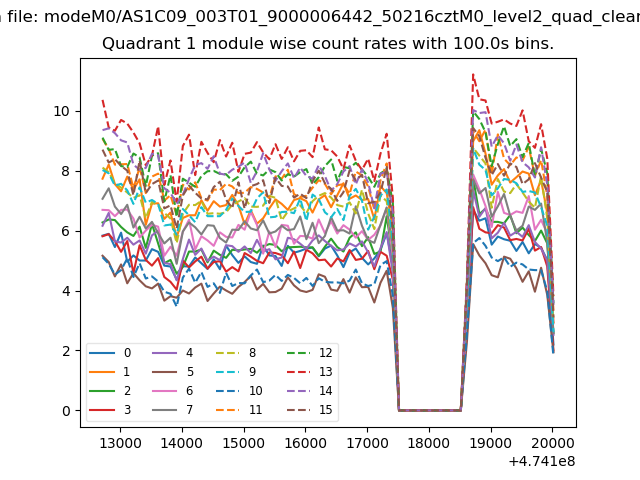
| Module-wise count rates for Quadrant A Data is divided into 100 sec bins |
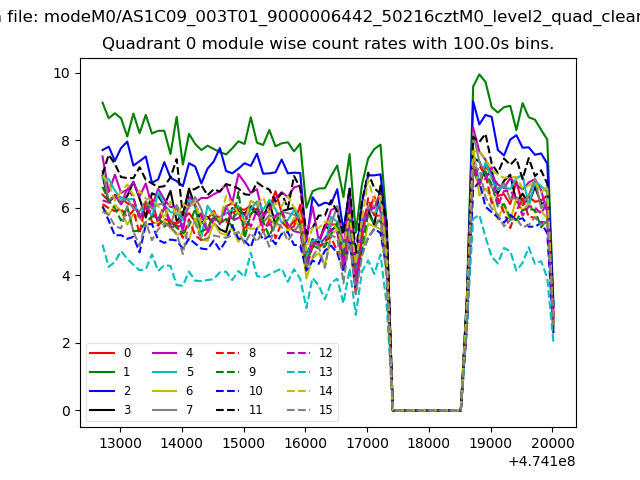 |
 |
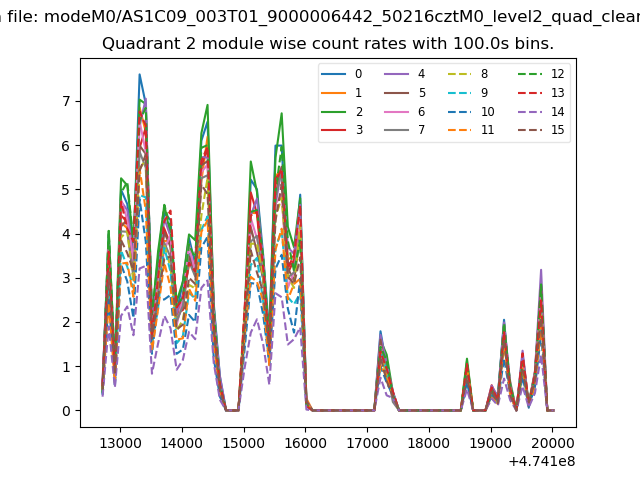
| Module-wise count rates for Quadrant B Data is divided into 100 sec bins |
 |
 |
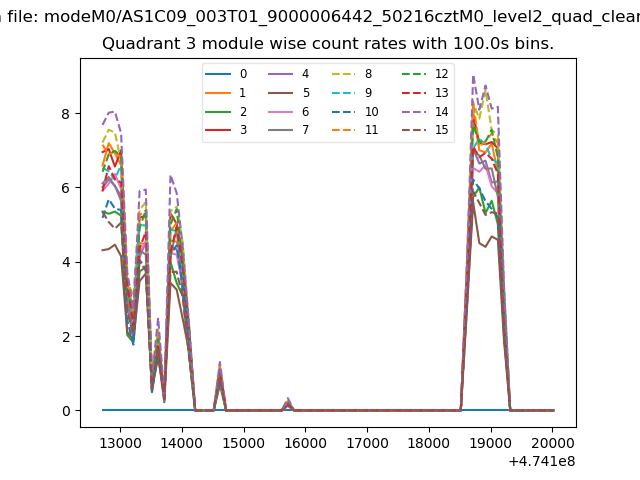
| Module-wise count rates for Quadrant C Data is divided into 100 sec bins |
 |
 |
| Module-wise count rates for Quadrant D Data is divided into 100 sec bins |
 |
 |
| Parameter | Plot |
|---|---|
| CZT HV Monitor |  |
| D_VDD | 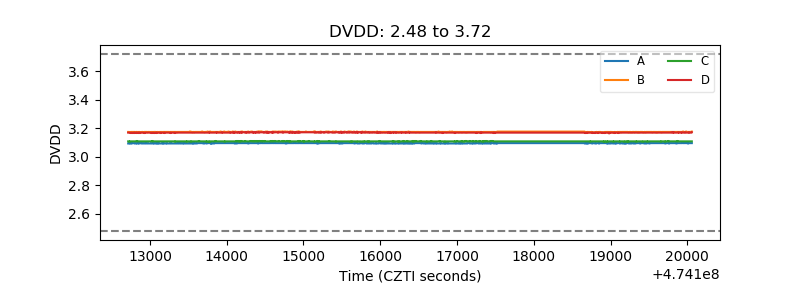 |
| Temperature 1 | 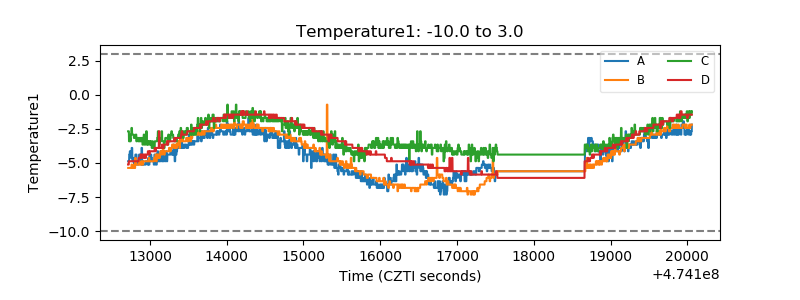 |
| Veto HV Monitor | 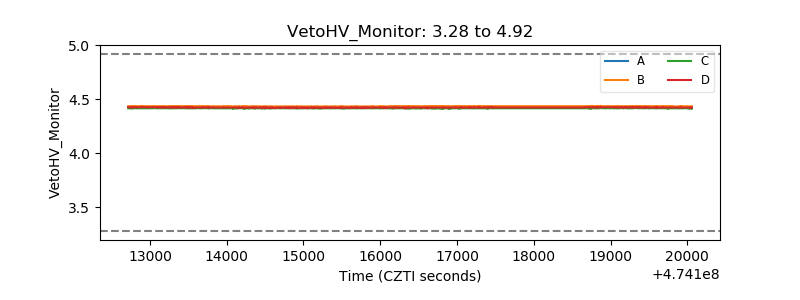 |
| Veto LLD |  |
| Alpha Counter | 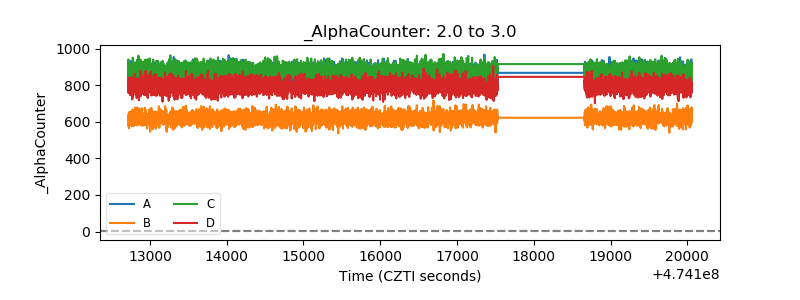 |
| _CPM_Rate | 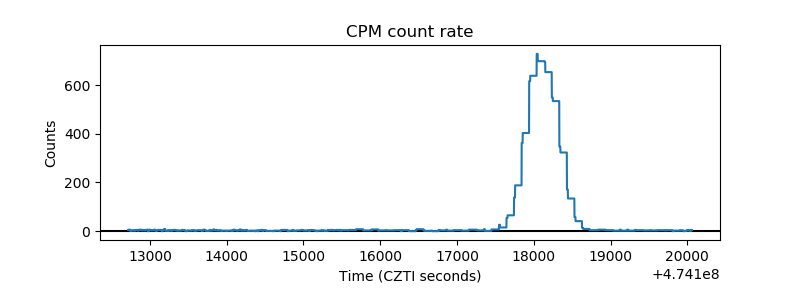 |
| CZT Counter | 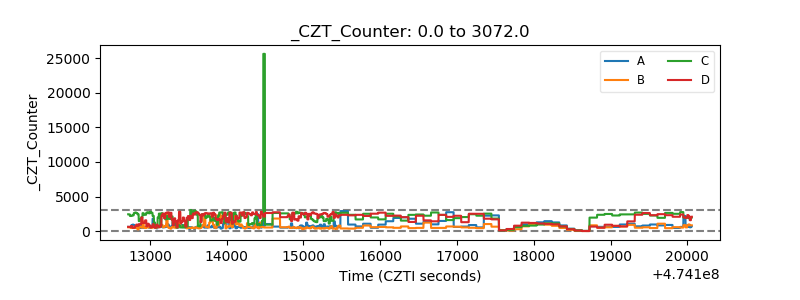 |
| +2.5 Volts monitor | 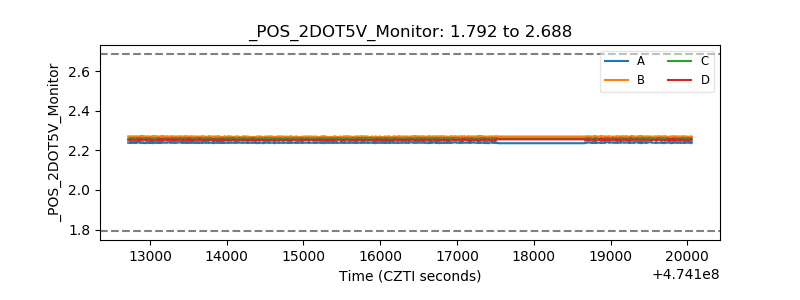 |
| +5 Volts monitor |  |
| _ROLL_ROT | 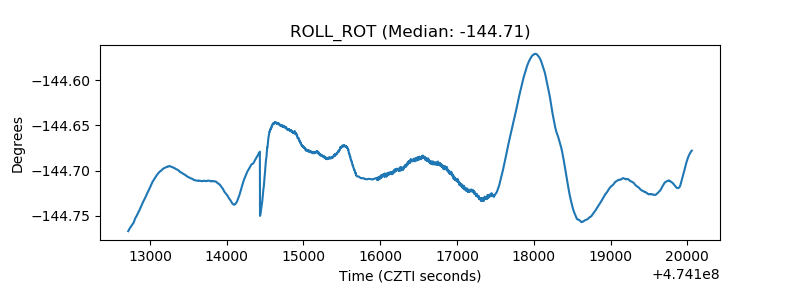 |
| _Roll_DEC | 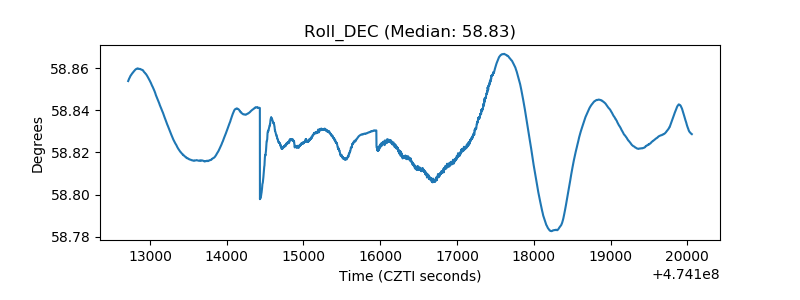 |
| _Roll_RA | 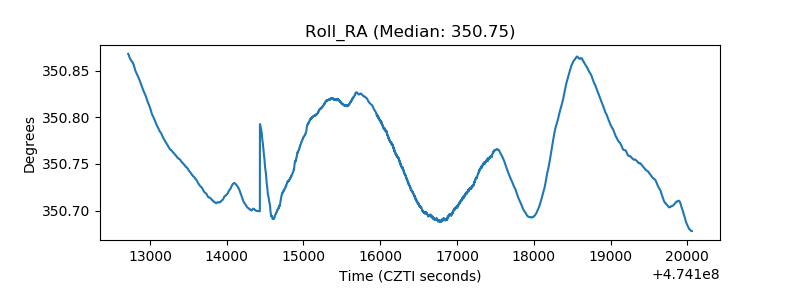 |
| Veto Counter | 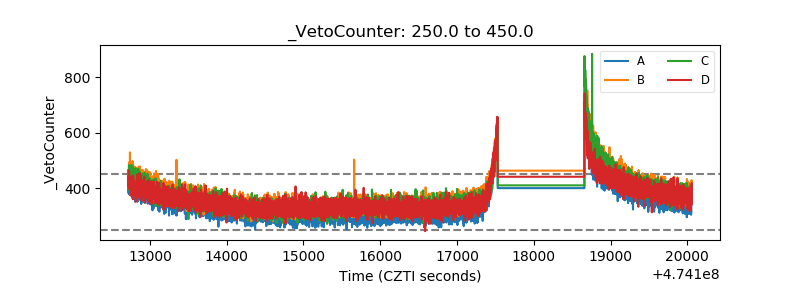 |