| Param | Original file | Final file |
|---|---|---|
| Filename | modeM0/AS1C09_003T01_9000006442_50217cztM0_level2.fits | modeM0/AS1C09_003T01_9000006442_50217cztM0_level2_quad_clean.evt |
| Size (bytes) | 981,527,040 | 60,405,120 |
| Size | 936.1 MB | 57.6 MB |
| Events in quadrant A | 6,505,721 | 566,268 |
| Events in quadrant B | 6,154,783 | 595,037 |
| Events in quadrant C | 11,260,759 | 43,628 |
| Events in quadrant D | 11,923,353 | 184,200 |
| Mode M9 | |||
|---|---|---|---|
| Quadrant | BADHDUFLAG | Total packets | Discarded packets |
| A | 0 | 11 | 0 |
| B | 0 | 11 | 0 |
| C | 0 | 11 | 0 |
| D | 0 | 11 | 0 |
| Mode M0 | |||
|---|---|---|---|
| Quadrant | BADHDUFLAG | Total packets | Discarded packets |
| A | 0 | 23697 | 1 |
| B | 0 | 22607 | 1 |
| C | 0 | 37847 | 1 |
| D | 0 | 39776 | 6 |
| Mode SS | |||
|---|---|---|---|
| Quadrant | BADHDUFLAG | Total packets | Discarded packets |
| A | 0 | 128 | 0 |
| B | 0 | 128 | 0 |
| C | 0 | 128 | 0 |
| D | 0 | 128 | 0 |
| Quadrant | Total seconds | Saturated seconds | Saturation percentage |
|---|---|---|---|
| A | 6297 | 828 | 13.149119% |
| B | 6298 | 1007 | 15.989203% |
| C | 6298 | 5955 | 94.553827% |
| D | 6297 | 4547 | 72.208988% |
Noise dominated data is calculated using 1-second bins in cleaned event files. If a bin has >2000 counts, and if more than 50% of those come from <1% of pixels, then it is considered to be noise-dominated and hence unusable.
| Quadrant | # 1 sec bins | Bins with >0 counts | Bins with >2000 counts | High rate bins dominated by noise | Noise dominated (total time) | Noise dominated (detector-on time) | Marked lightcurve |
|---|---|---|---|---|---|---|---|
| A | 7397 | 6297 | 653 | 653 | 8.83% | 10.37% | 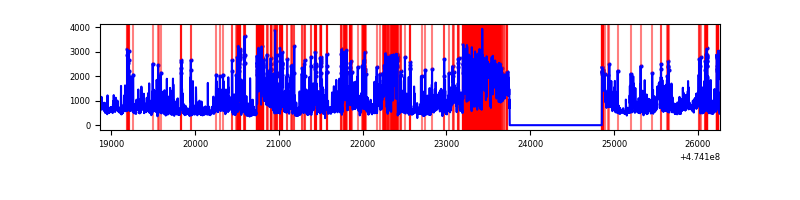 |
| B | 7398 | 6298 | 738 | 738 | 9.98% | 11.72% | 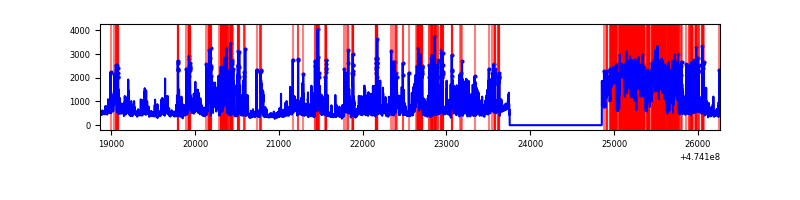 |
| C | 7397 | 6297 | 3050 | 3050 | 41.23% | 48.44% | 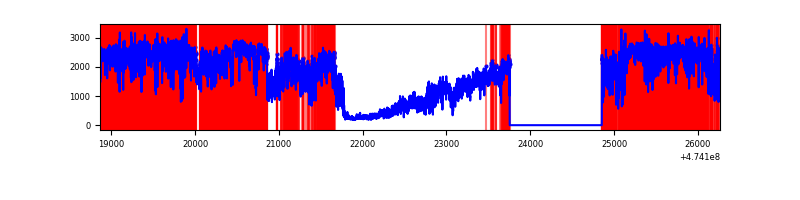 |
| D | 7397 | 6297 | 2810 | 2810 | 37.99% | 44.62% | 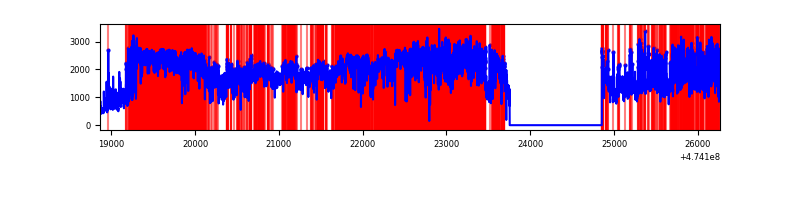 |
Top three noisy pixels from each quadrant. If the there are fewer than three noisy pixels in the level2.evt file, extra rows are filled as -1
| Pixel properties | Quadrant properties | ||||||
|---|---|---|---|---|---|---|---|
| Quadrant | DetID | PixID | Counts | Sigma | Mean | Median | Sigma |
| A | 11 | 7 | 791324 | 4882.89 | 658 | 643 | 161.9 |
| A | 4 | 249 | 632813 | 3904.0 | 658 | 643 | 161.9 |
| A | 0 | 98 | 583394 | 3598.81 | 658 | 643 | 161.9 |
| B | 4 | 206 | 1968427 | 14302.09 | 653 | 632 | 137.6 |
| B | 10 | 28 | 1114326 | 8094.42 | 653 | 632 | 137.6 |
| B | 0 | 213 | 88026 | 635.19 | 653 | 632 | 137.6 |
| C | 4 | 111 | 4635133 | 100545.97 | 163 | 162 | 46.1 |
| C | 15 | 199 | 4330706 | 93942.07 | 163 | 162 | 46.1 |
| C | 15 | 182 | 701329 | 15210.34 | 163 | 162 | 46.1 |
| D | 7 | 61 | 6055615 | 63021.22 | 334 | 322 | 96.1 |
| D | 15 | 108 | 1652580 | 17196.08 | 334 | 322 | 96.1 |
| D | 7 | 45 | 560680 | 5832.0 | 334 | 322 | 96.1 |
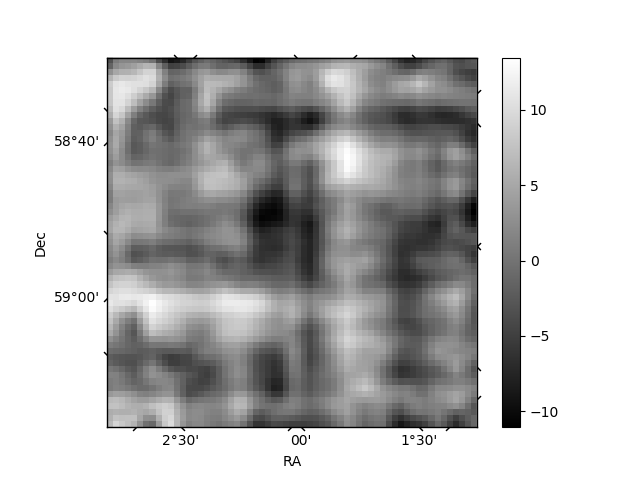
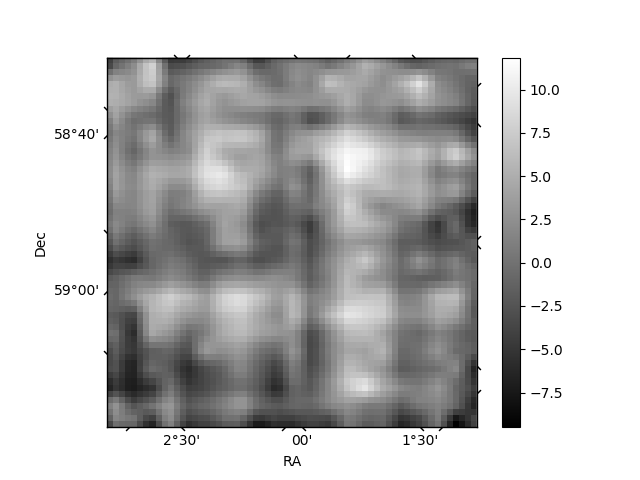
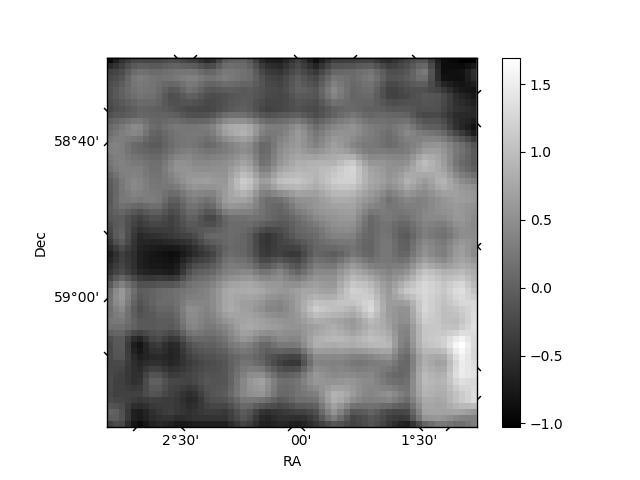
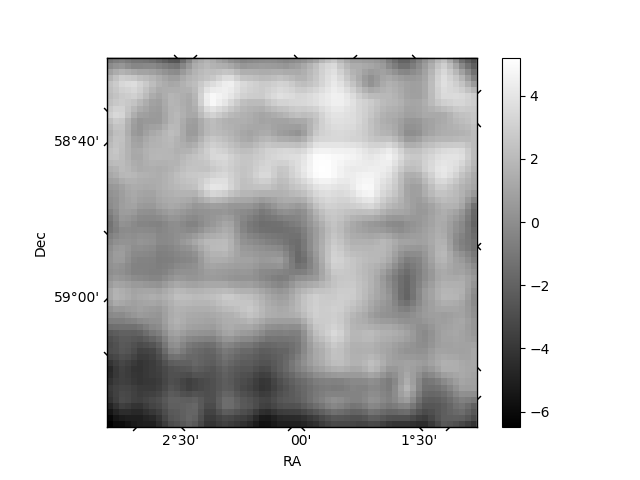
Histogram calculated using DETX and DETY for each event in the final _common_clean file
| Quadrant A | 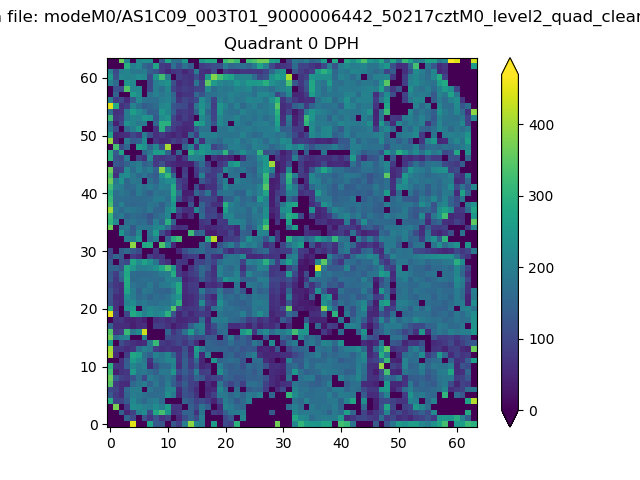 |
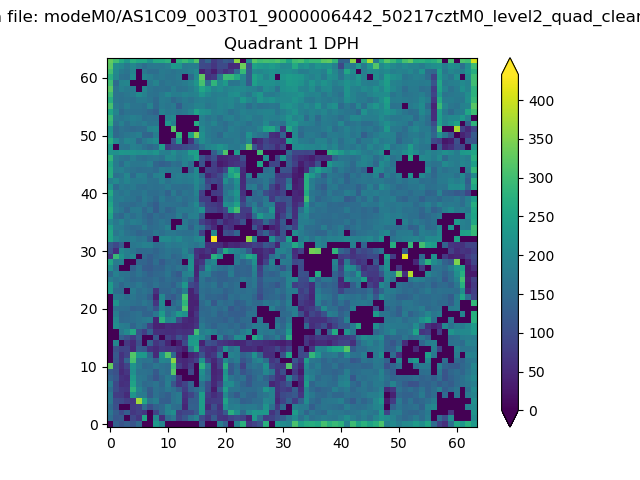 |
Quadrant B |
|---|---|---|---|
| Quadrant D | 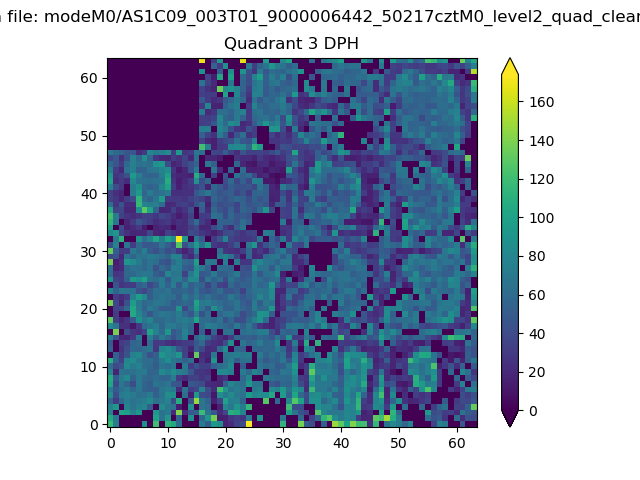 |
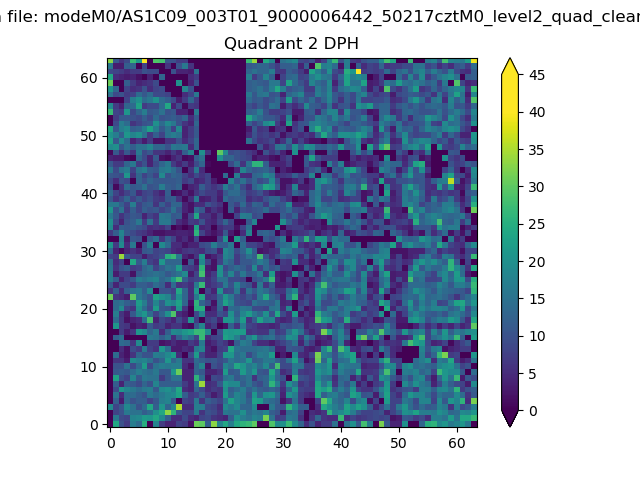 |
Quadrant C |
| Plot type | Count rate plots | Images |
|---|---|---|
| Comparison with Poisson distribution Blue bars denote a histogram of data divided into 1 sec bins. Red curve is a Poisson curve with rate = median count rate of data. |
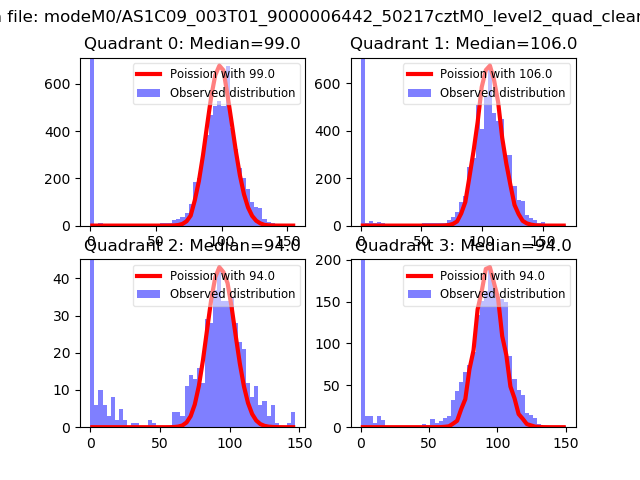 |
 |
| Quadrant-wise count rates Data is divided into 100 sec bins |
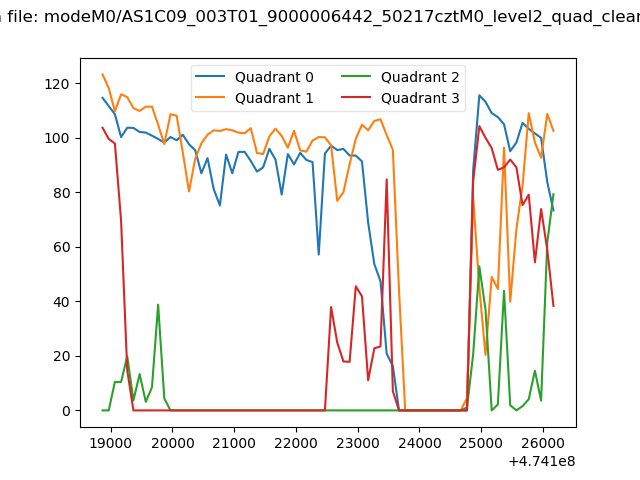 |
|
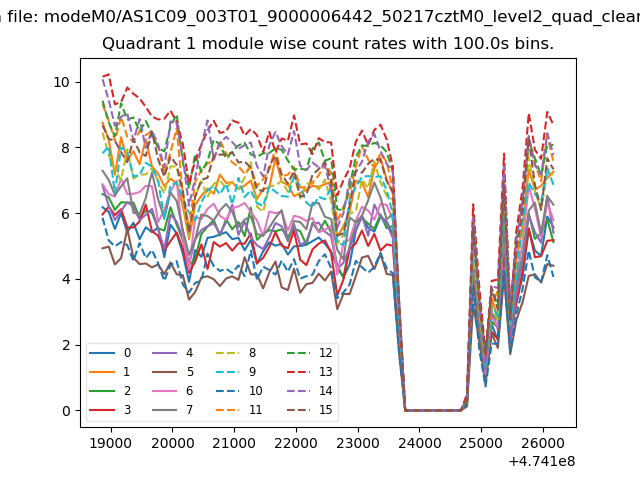
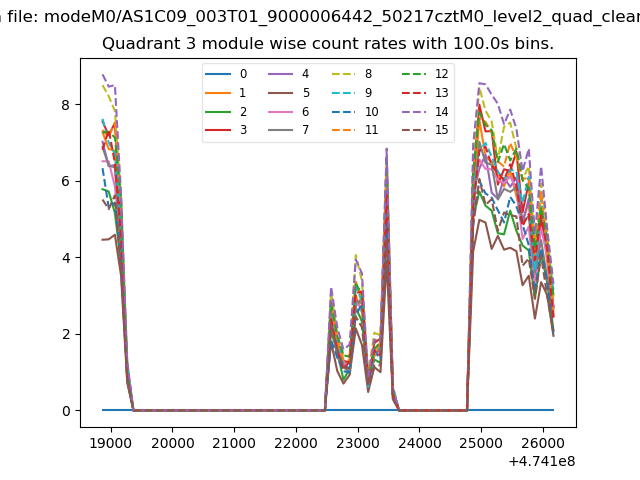
| Module-wise count rates for Quadrant A Data is divided into 100 sec bins |
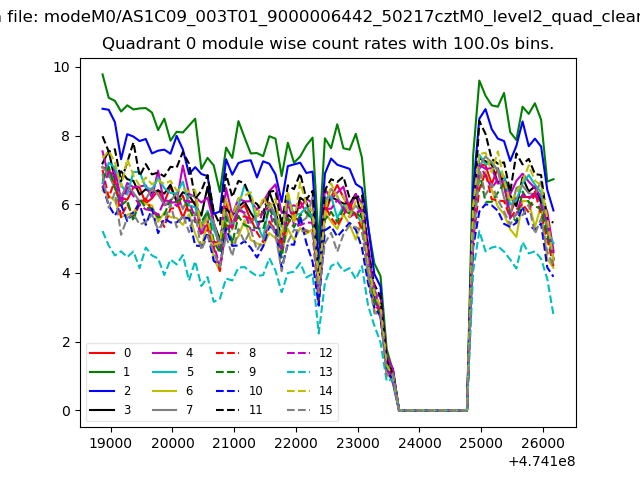 |
 |
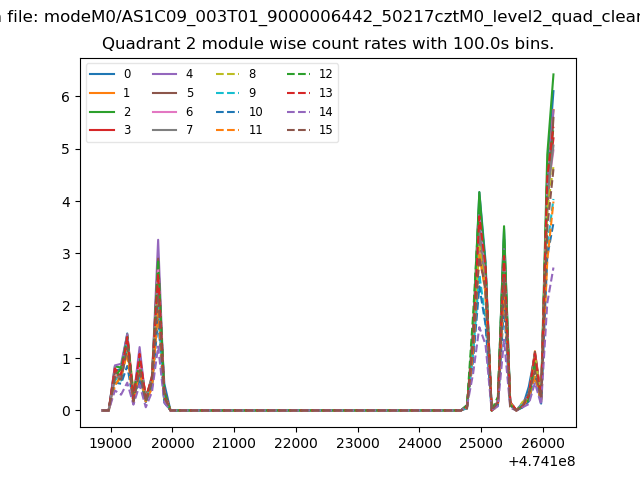
| Module-wise count rates for Quadrant B Data is divided into 100 sec bins |
 |
 |
| Module-wise count rates for Quadrant C Data is divided into 100 sec bins |
 |
 |
| Module-wise count rates for Quadrant D Data is divided into 100 sec bins |
 |
 |
| Parameter | Plot |
|---|---|
| CZT HV Monitor | 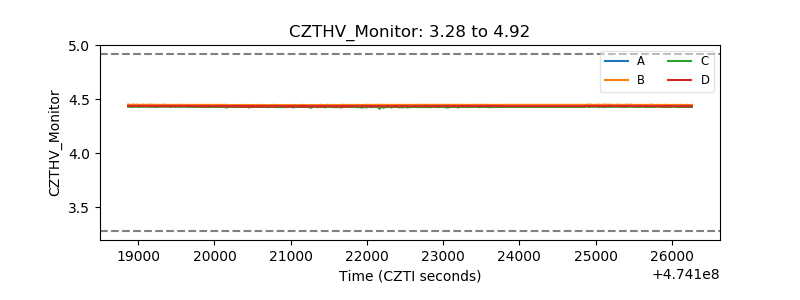 |
| D_VDD | 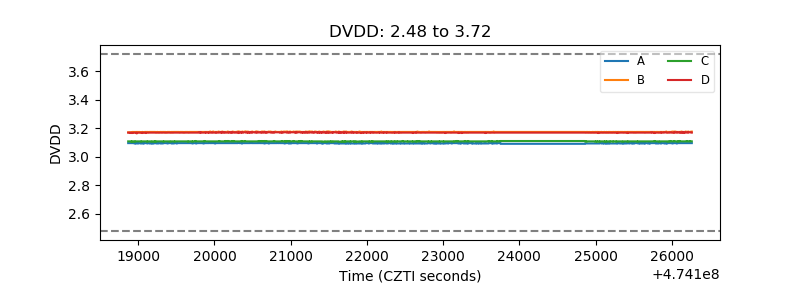 |
| Temperature 1 | 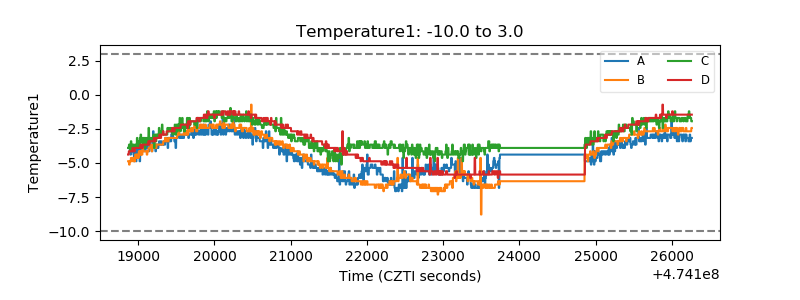 |
| Veto HV Monitor |  |
| Veto LLD | 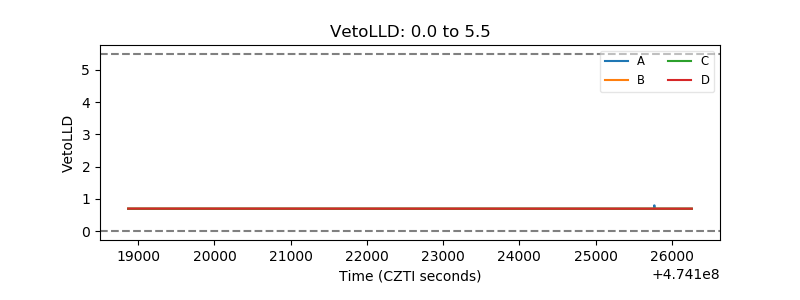 |
| Alpha Counter | 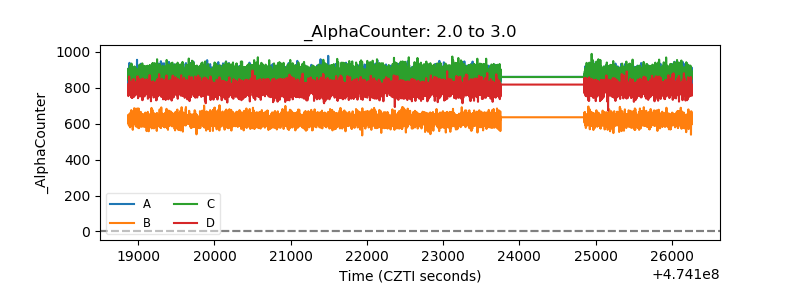 |
| _CPM_Rate | 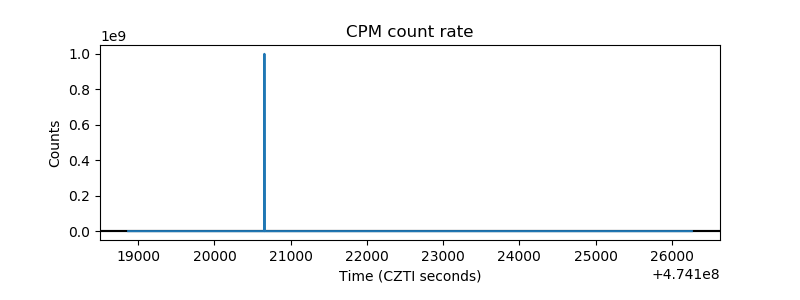 |
| CZT Counter | 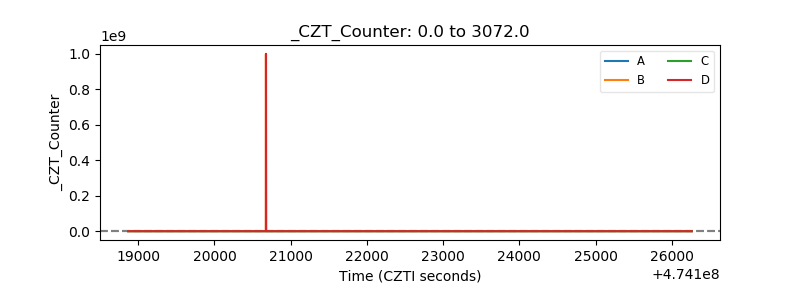 |
| +2.5 Volts monitor | 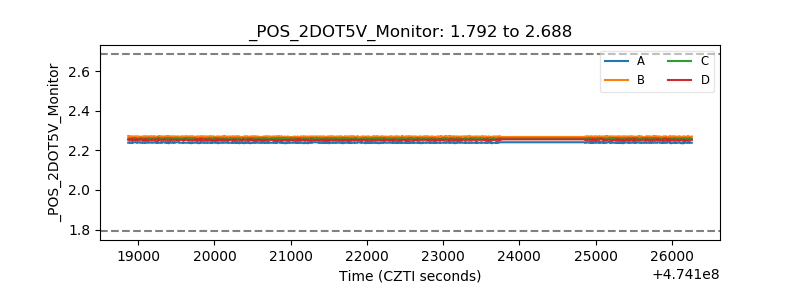 |
| +5 Volts monitor |  |
| _ROLL_ROT | 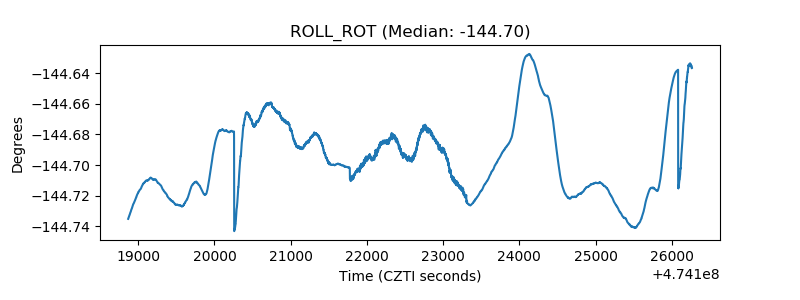 |
| _Roll_DEC | 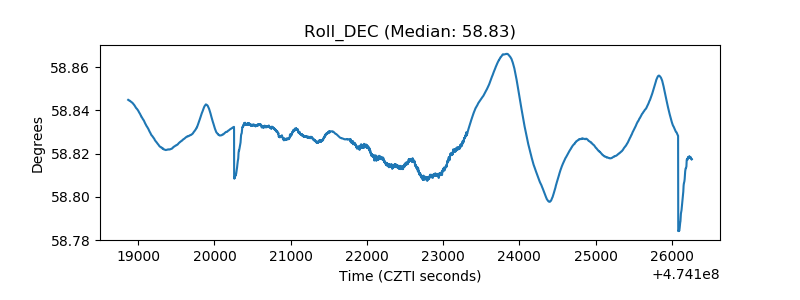 |
| _Roll_RA | 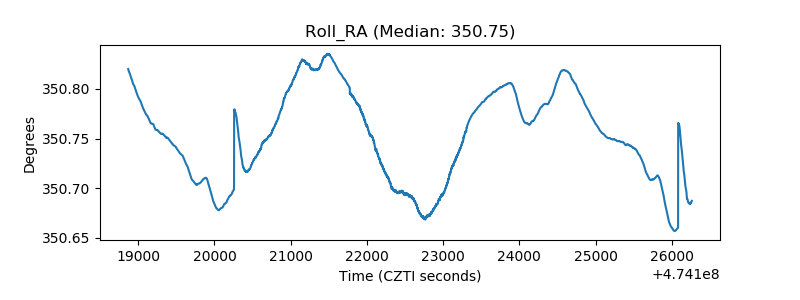 |
| Veto Counter | 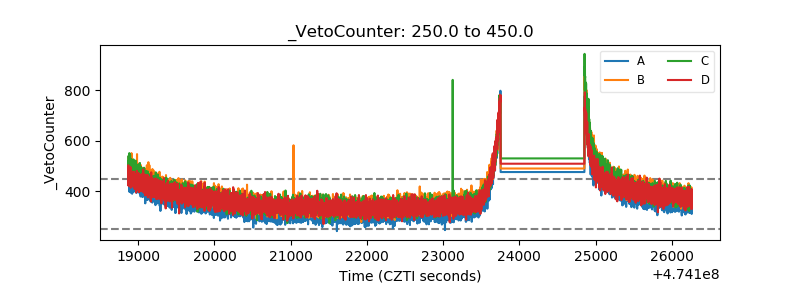 |