| Param | Original file | Final file |
|---|---|---|
| Filename | modeM0/AS1C09_003T01_9000006442_50218cztM0_level2.fits | modeM0/AS1C09_003T01_9000006442_50218cztM0_level2_quad_clean.evt |
| Size (bytes) | 965,471,040 | 67,893,120 |
| Size | 920.7 MB | 64.7 MB |
| Events in quadrant A | 6,678,947 | 483,044 |
| Events in quadrant B | 5,112,629 | 602,978 |
| Events in quadrant C | 11,402,578 | 277,677 |
| Events in quadrant D | 12,077,503 | 268,536 |
| Mode M9 | |||
|---|---|---|---|
| Quadrant | BADHDUFLAG | Total packets | Discarded packets |
| A | 0 | 11 | 0 |
| B | 0 | 11 | 0 |
| C | 0 | 11 | 0 |
| D | 0 | 11 | 0 |
| Mode M0 | |||
|---|---|---|---|
| Quadrant | BADHDUFLAG | Total packets | Discarded packets |
| A | 0 | 23938 | 1 |
| B | 0 | 19385 | 1 |
| C | 0 | 38042 | 1 |
| D | 0 | 40064 | 1 |
| Mode SS | |||
|---|---|---|---|
| Quadrant | BADHDUFLAG | Total packets | Discarded packets |
| A | 0 | 124 | 0 |
| B | 0 | 124 | 0 |
| C | 0 | 124 | 0 |
| D | 0 | 124 | 0 |
| Quadrant | Total seconds | Saturated seconds | Saturation percentage |
|---|---|---|---|
| A | 6054 | 1293 | 21.357780% |
| B | 6055 | 553 | 9.132948% |
| C | 6055 | 3371 | 55.672998% |
| D | 6055 | 3466 | 57.241949% |
Noise dominated data is calculated using 1-second bins in cleaned event files. If a bin has >2000 counts, and if more than 50% of those come from <1% of pixels, then it is considered to be noise-dominated and hence unusable.
| Quadrant | # 1 sec bins | Bins with >0 counts | Bins with >2000 counts | High rate bins dominated by noise | Noise dominated (total time) | Noise dominated (detector-on time) | Marked lightcurve |
|---|---|---|---|---|---|---|---|
| A | 7144 | 6054 | 1146 | 1146 | 16.04% | 18.93% | 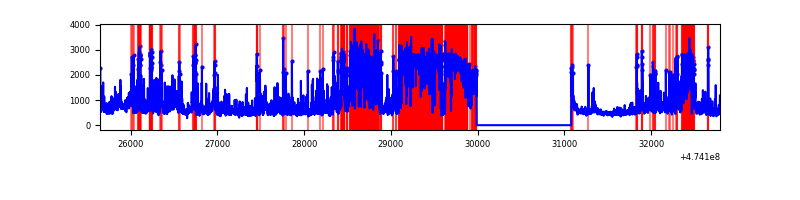 |
| B | 7145 | 6055 | 378 | 378 | 5.29% | 6.24% | 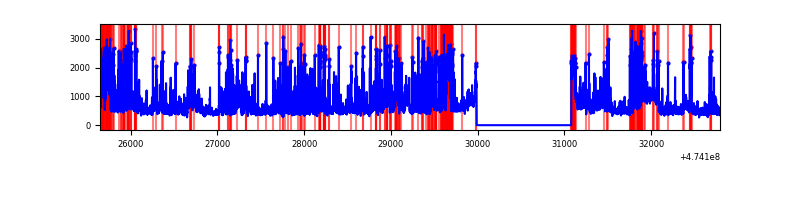 |
| C | 7144 | 6054 | 3210 | 3210 | 44.93% | 53.02% | 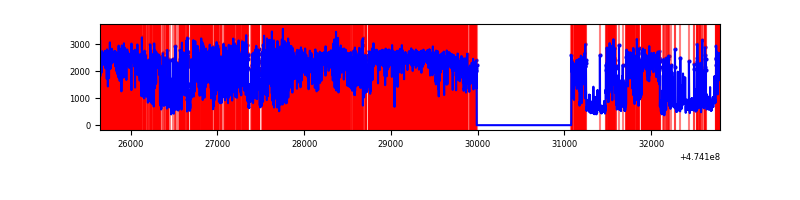 |
| D | 7144 | 6054 | 3466 | 3466 | 48.52% | 57.25% | 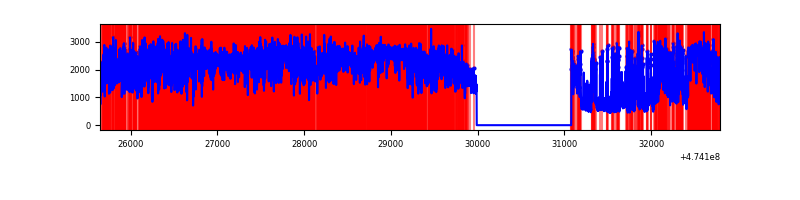 |
Top three noisy pixels from each quadrant. If the there are fewer than three noisy pixels in the level2.evt file, extra rows are filled as -1
| Pixel properties | Quadrant properties | ||||||
|---|---|---|---|---|---|---|---|
| Quadrant | DetID | PixID | Counts | Sigma | Mean | Median | Sigma |
| A | 0 | 98 | 2225471 | 15048.02 | 586 | 571 | 147.9 |
| A | 4 | 249 | 572876 | 3870.76 | 586 | 571 | 147.9 |
| A | 4 | 156 | 272162 | 1836.89 | 586 | 571 | 147.9 |
| B | 4 | 206 | 1854558 | 13970.42 | 622 | 602 | 132.7 |
| B | 10 | 28 | 217623 | 1635.35 | 622 | 602 | 132.7 |
| B | 3 | 249 | 60312 | 449.94 | 622 | 602 | 132.7 |
| C | 4 | 111 | 5781918 | 44276.25 | 473 | 470 | 130.6 |
| C | 15 | 197 | 1662430 | 12727.84 | 473 | 470 | 130.6 |
| C | 15 | 214 | 567818 | 4344.94 | 473 | 470 | 130.6 |
| D | 15 | 108 | 3148918 | 21220.26 | 510 | 489 | 148.4 |
| D | 7 | 61 | 2897950 | 19528.75 | 510 | 489 | 148.4 |
| D | 11 | 245 | 613641 | 4132.61 | 510 | 489 | 148.4 |
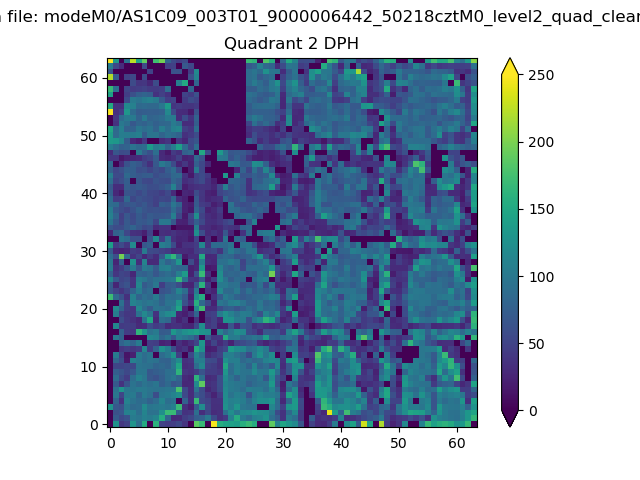
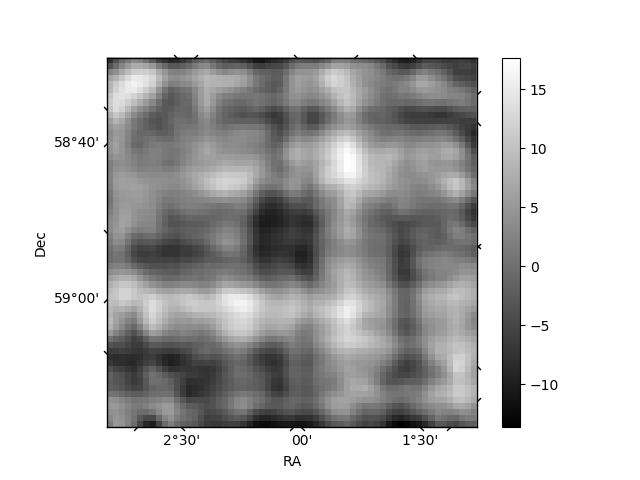
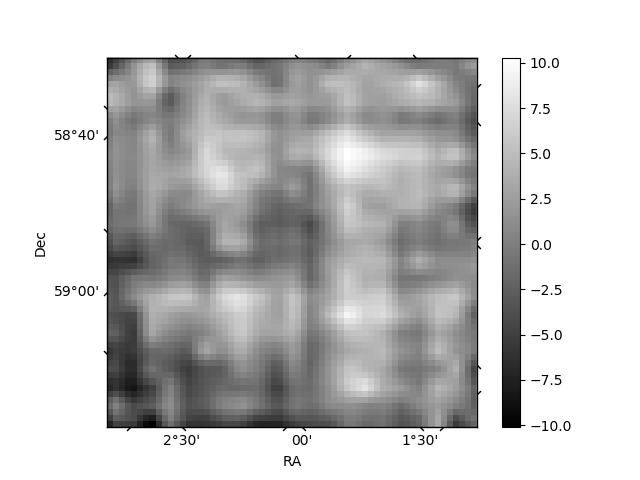
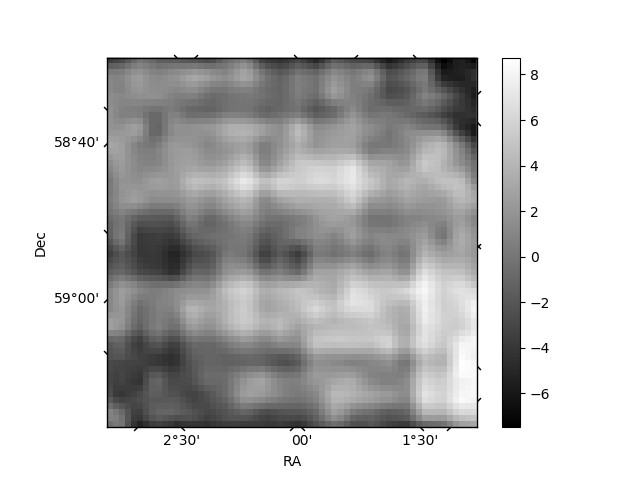
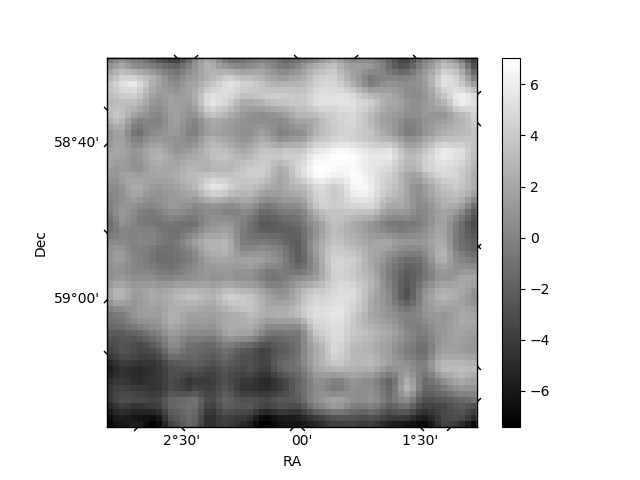
Histogram calculated using DETX and DETY for each event in the final _common_clean file
| Quadrant A | 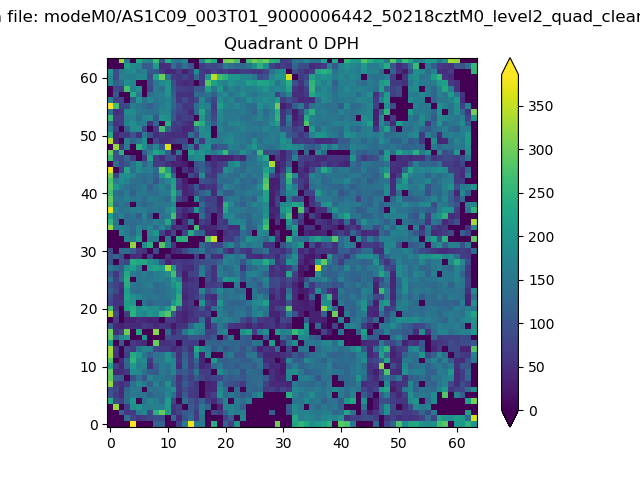 |
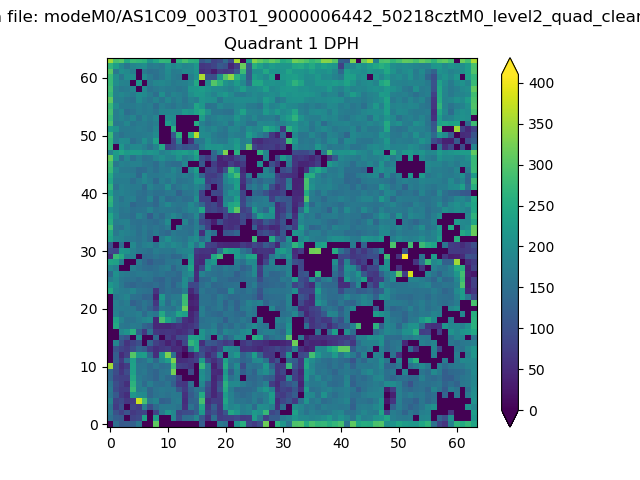 |
Quadrant B |
|---|---|---|---|
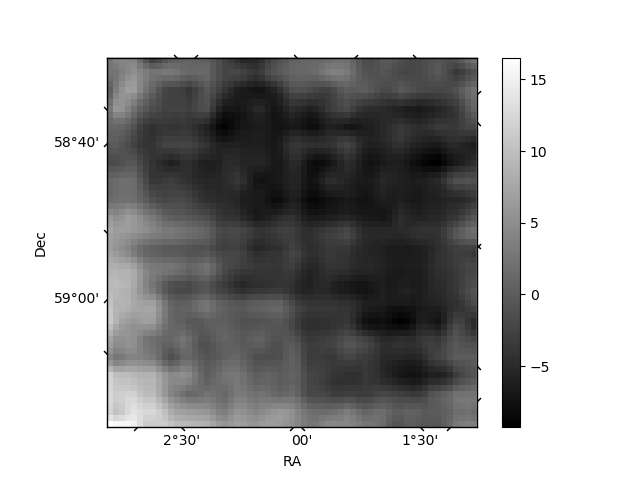
| Quadrant D | 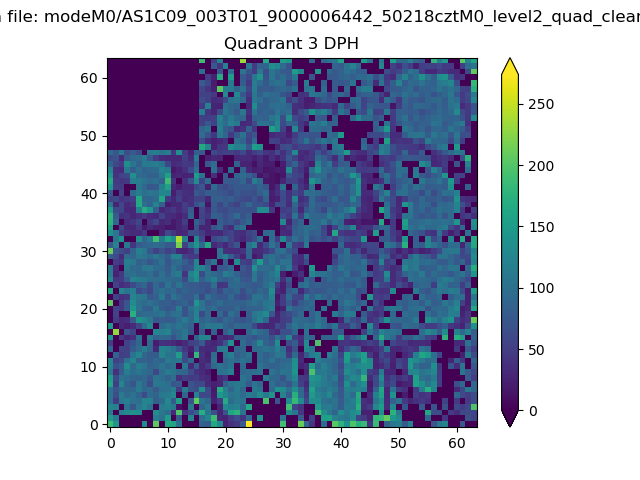 |
 |
Quadrant C |
| Plot type | Count rate plots | Images |
|---|---|---|
| Comparison with Poisson distribution Blue bars denote a histogram of data divided into 1 sec bins. Red curve is a Poisson curve with rate = median count rate of data. |
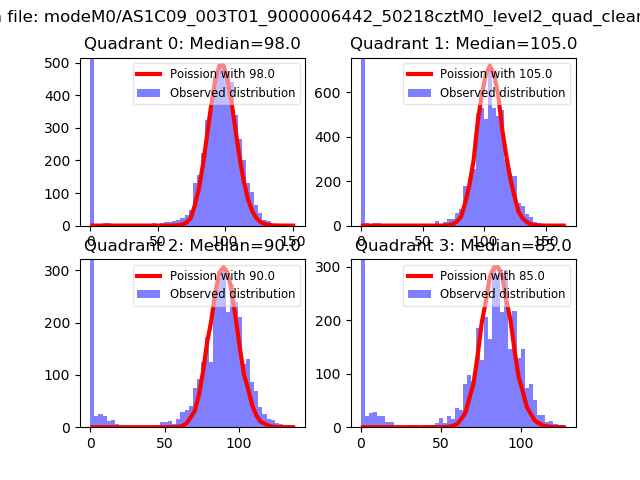 |
 |
| Quadrant-wise count rates Data is divided into 100 sec bins |
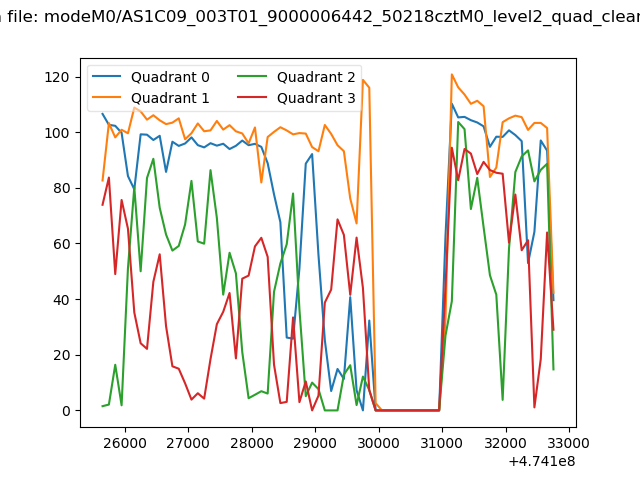 |
|
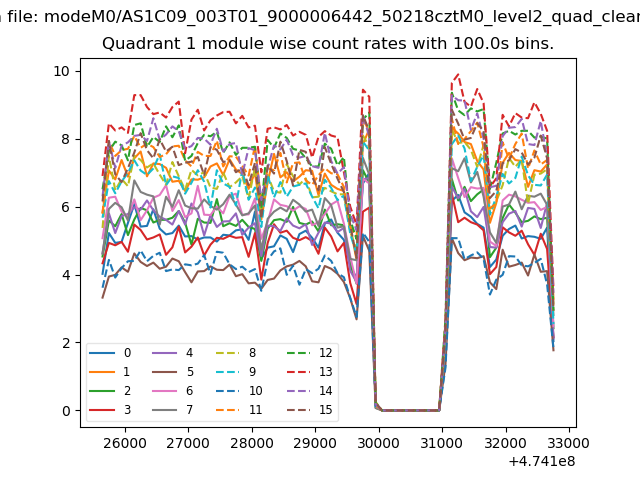
| Module-wise count rates for Quadrant A Data is divided into 100 sec bins |
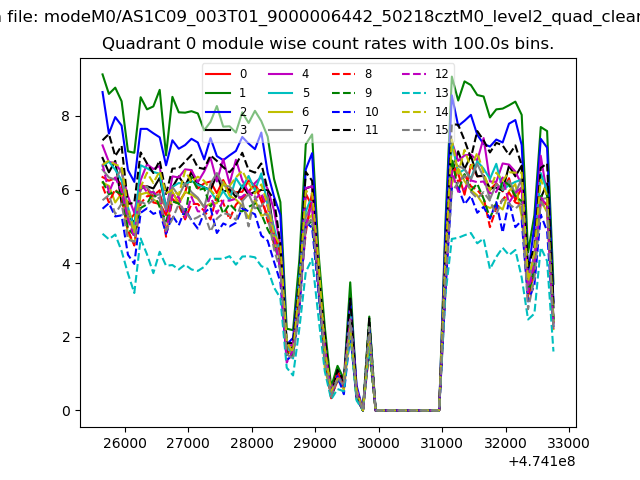 |
 |
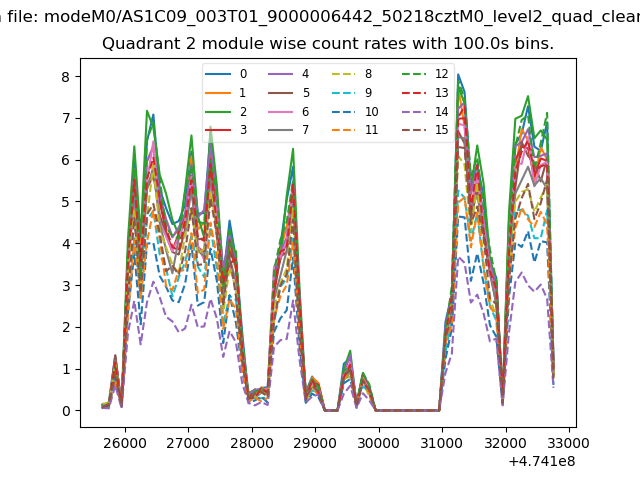
| Module-wise count rates for Quadrant B Data is divided into 100 sec bins |
 |
 |
| Module-wise count rates for Quadrant C Data is divided into 100 sec bins |
 |
 |
| Module-wise count rates for Quadrant D Data is divided into 100 sec bins |
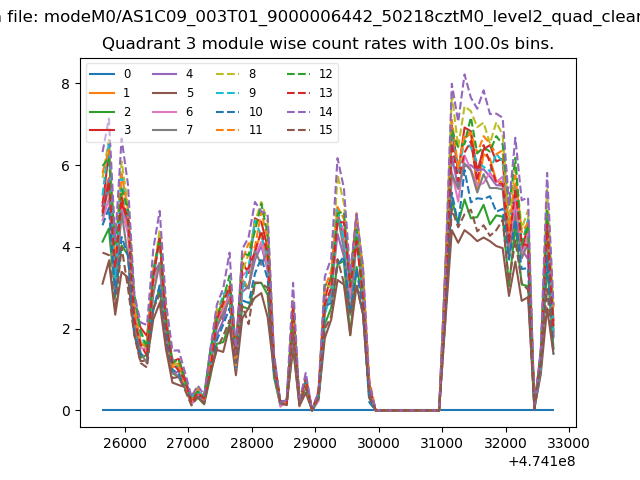 |
 |
| Parameter | Plot |
|---|---|
| CZT HV Monitor | 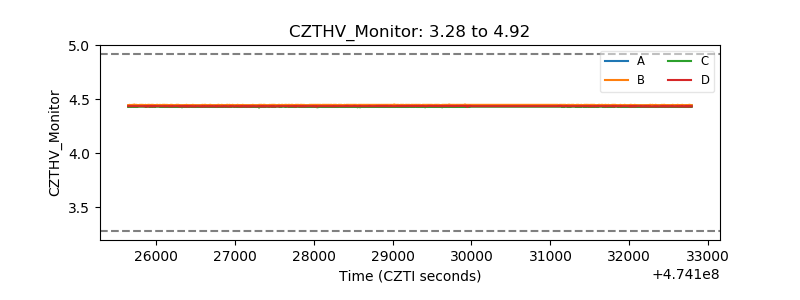 |
| D_VDD | 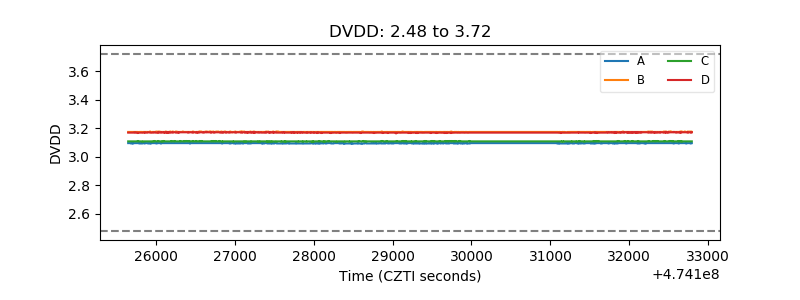 |
| Temperature 1 | 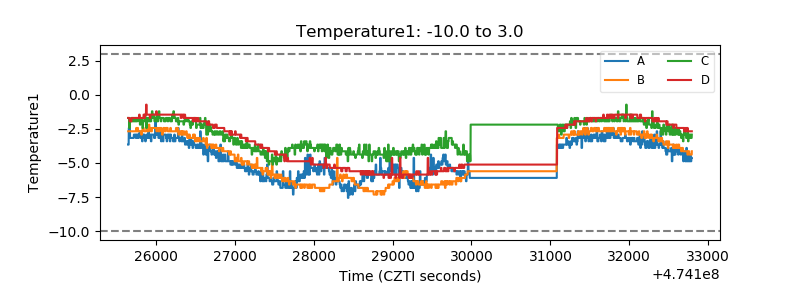 |
| Veto HV Monitor | 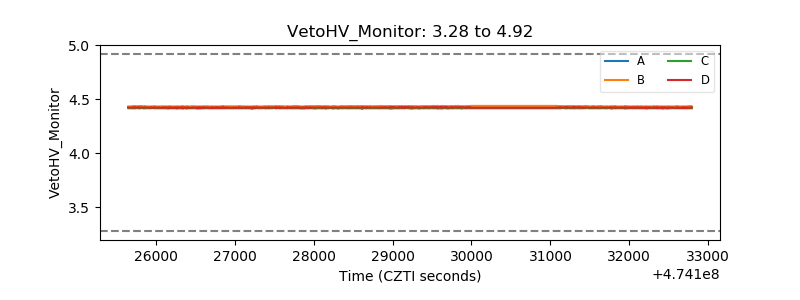 |
| Veto LLD | 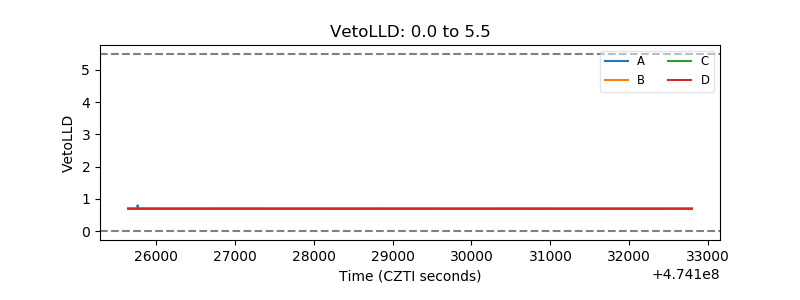 |
| Alpha Counter | 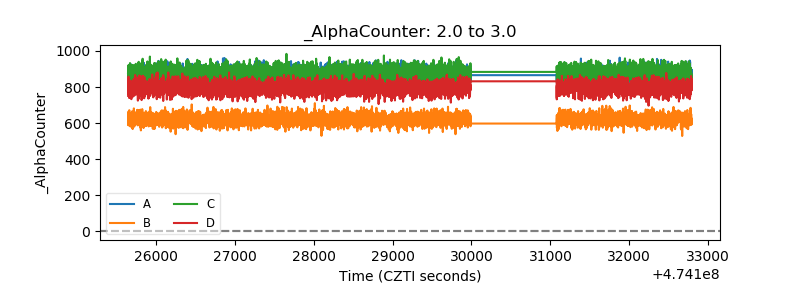 |
| _CPM_Rate | 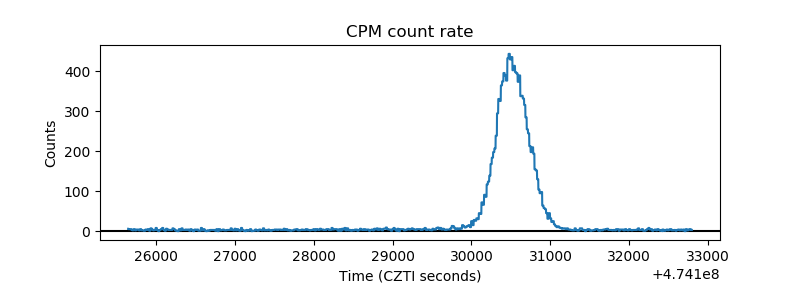 |
| CZT Counter | 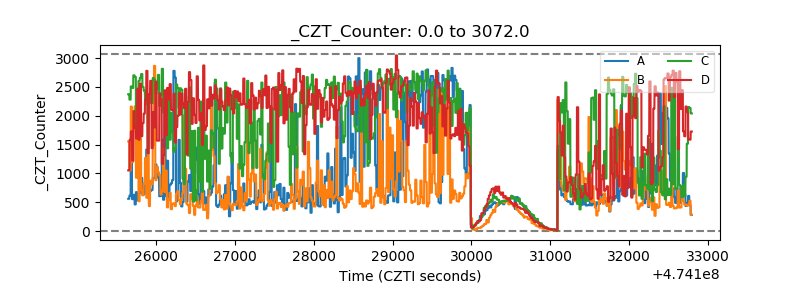 |
| +2.5 Volts monitor |  |
| +5 Volts monitor | 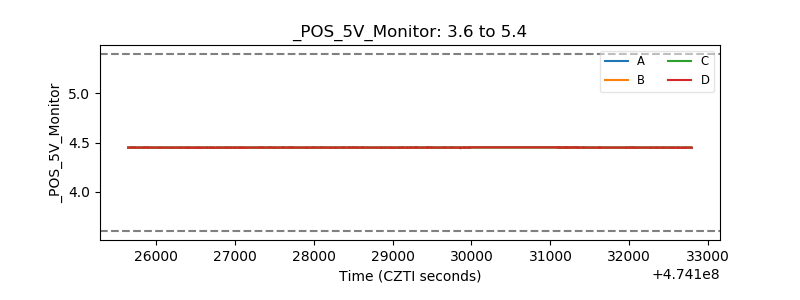 |
| _ROLL_ROT | 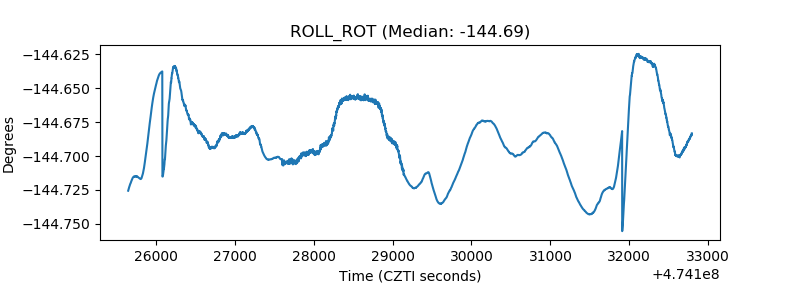 |
| _Roll_DEC | 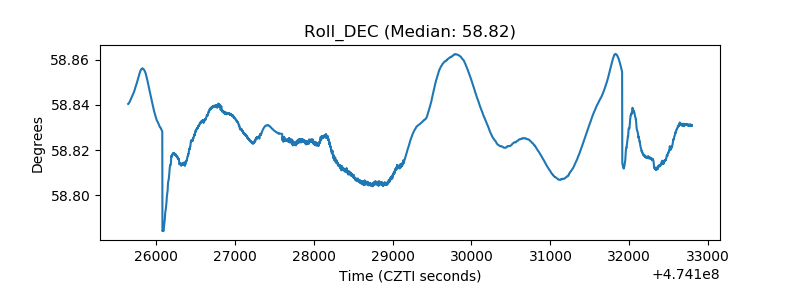 |
| _Roll_RA | 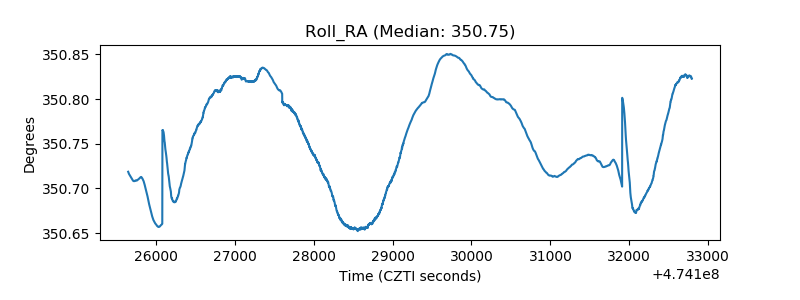 |
| Veto Counter | 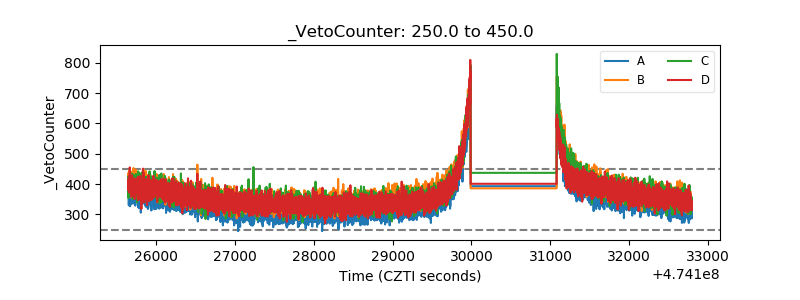 |