| Param | Original file | Final file |
|---|---|---|
| Filename | modeM0/AS1C09_003T01_9000006442_50219cztM0_level2.fits | modeM0/AS1C09_003T01_9000006442_50219cztM0_level2_quad_clean.evt |
| Size (bytes) | 959,031,360 | 68,785,920 |
| Size | 914.6 MB | 65.6 MB |
| Events in quadrant A | 6,903,891 | 469,000 |
| Events in quadrant B | 5,276,996 | 595,201 |
| Events in quadrant C | 11,925,013 | 211,685 |
| Events in quadrant D | 10,915,114 | 372,790 |
| Mode M9 | |||
|---|---|---|---|
| Quadrant | BADHDUFLAG | Total packets | Discarded packets |
| A | 0 | 10 | 0 |
| B | 0 | 10 | 0 |
| C | 0 | 10 | 0 |
| D | 0 | 10 | 0 |
| Mode M0 | |||
|---|---|---|---|
| Quadrant | BADHDUFLAG | Total packets | Discarded packets |
| A | 0 | 24659 | 4 |
| B | 0 | 19970 | 1 |
| C | 0 | 39681 | 1 |
| D | 0 | 36766 | 1 |
| Mode SS | |||
|---|---|---|---|
| Quadrant | BADHDUFLAG | Total packets | Discarded packets |
| A | 0 | 126 | 0 |
| B | 0 | 126 | 0 |
| C | 0 | 126 | 0 |
| D | 0 | 126 | 0 |
| Quadrant | Total seconds | Saturated seconds | Saturation percentage |
|---|---|---|---|
| A | 6213 | 1493 | 24.030259% |
| B | 6214 | 666 | 10.717734% |
| C | 6214 | 4059 | 65.320245% |
| D | 6214 | 2303 | 37.061474% |
Noise dominated data is calculated using 1-second bins in cleaned event files. If a bin has >2000 counts, and if more than 50% of those come from <1% of pixels, then it is considered to be noise-dominated and hence unusable.
| Quadrant | # 1 sec bins | Bins with >0 counts | Bins with >2000 counts | High rate bins dominated by noise | Noise dominated (total time) | Noise dominated (detector-on time) | Marked lightcurve |
|---|---|---|---|---|---|---|---|
| A | 7197 | 6212 | 1291 | 1291 | 17.94% | 20.78% | 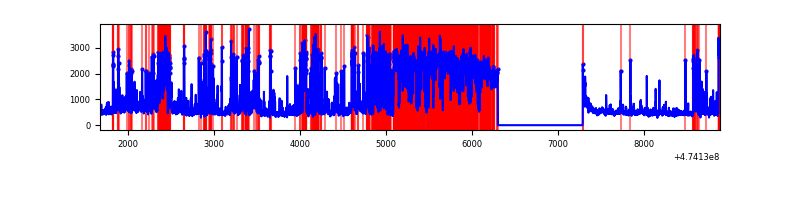 |
| B | 7199 | 6214 | 421 | 421 | 5.85% | 6.78% | 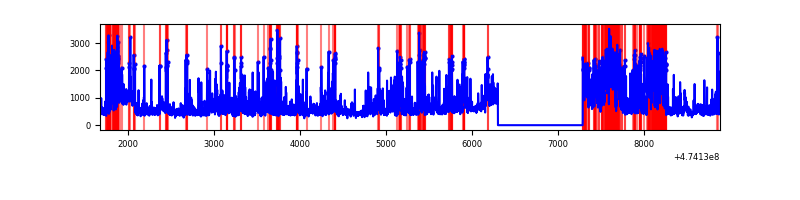 |
| C | 7199 | 6214 | 3575 | 3575 | 49.66% | 57.53% |  |
| D | 7199 | 6214 | 2300 | 2300 | 31.95% | 37.01% | 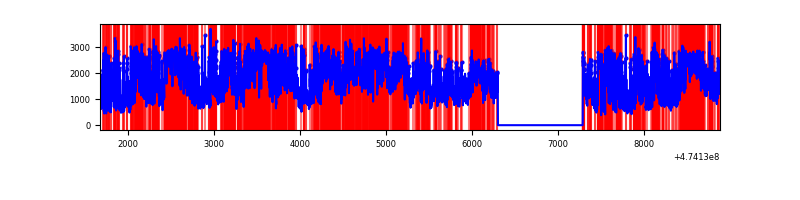 |
Top three noisy pixels from each quadrant. If the there are fewer than three noisy pixels in the level2.evt file, extra rows are filled as -1
| Pixel properties | Quadrant properties | ||||||
|---|---|---|---|---|---|---|---|
| Quadrant | DetID | PixID | Counts | Sigma | Mean | Median | Sigma |
| A | 0 | 98 | 2394396 | 16235.2 | 589 | 576 | 147.4 |
| A | 4 | 249 | 1030264 | 6983.48 | 589 | 576 | 147.4 |
| A | 4 | 156 | 345067 | 2336.38 | 589 | 576 | 147.4 |
| B | 4 | 206 | 2093646 | 15498.26 | 634 | 613 | 135.0 |
| B | 5 | 185 | 173419 | 1279.58 | 634 | 613 | 135.0 |
| B | 8 | 128 | 61595 | 451.55 | 634 | 613 | 135.0 |
| C | 4 | 111 | 5785497 | 54754.9 | 378 | 375 | 105.7 |
| C | 15 | 197 | 1090616 | 10318.89 | 378 | 375 | 105.7 |
| C | 15 | 199 | 1041357 | 9852.66 | 378 | 375 | 105.7 |
| D | 15 | 108 | 2081475 | 13155.12 | 558 | 539 | 158.2 |
| D | 15 | 94 | 1025241 | 6477.89 | 558 | 539 | 158.2 |
| D | 11 | 245 | 933309 | 5896.72 | 558 | 539 | 158.2 |
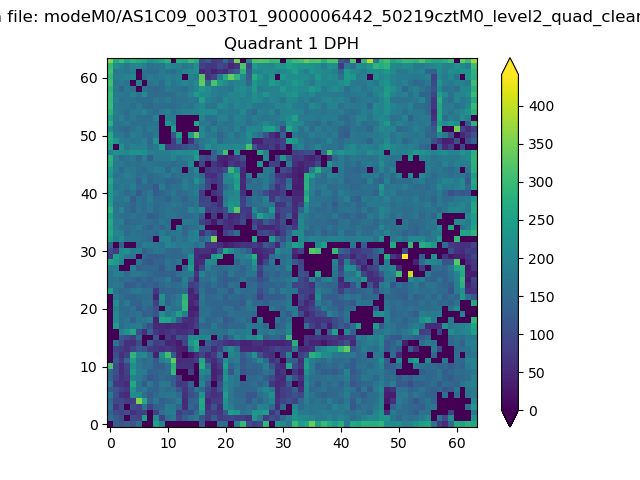
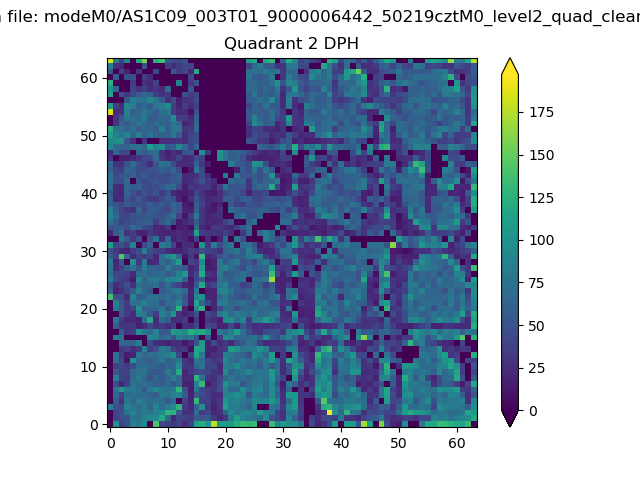
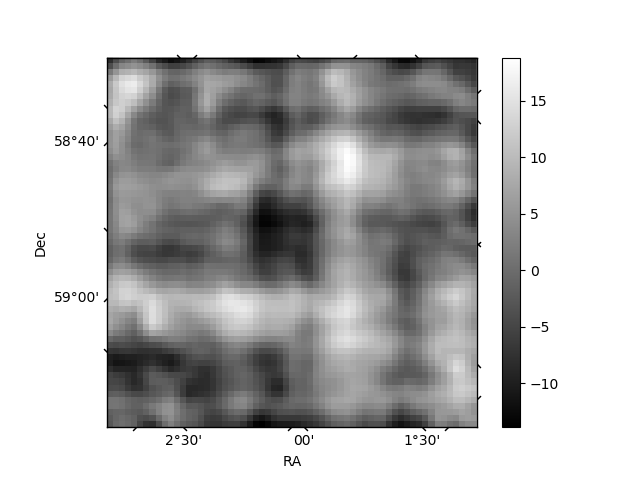
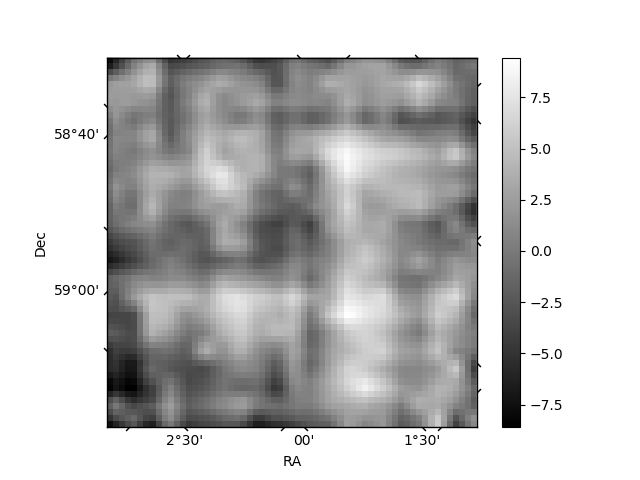
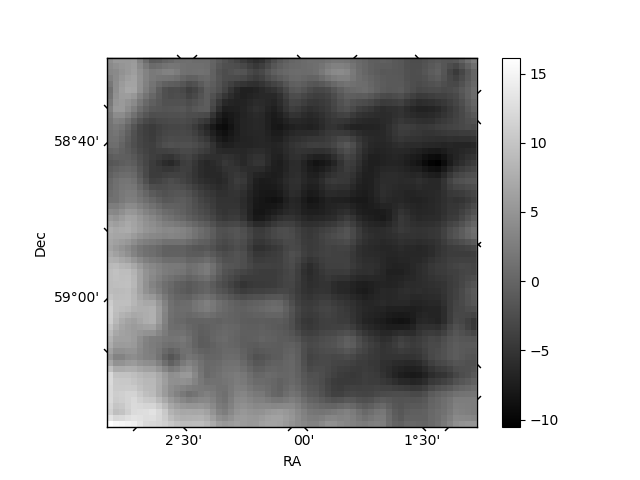
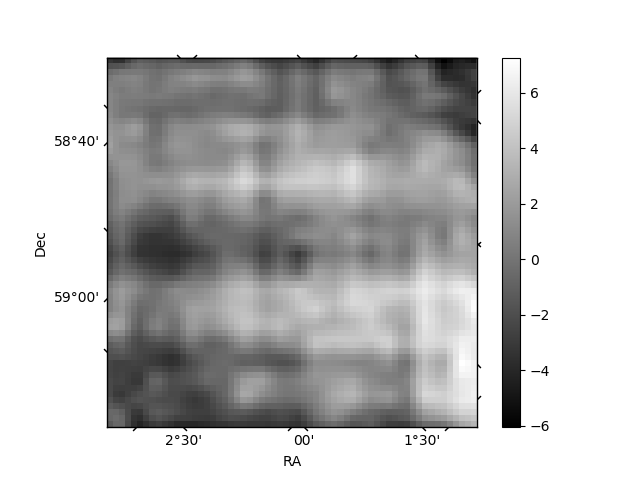
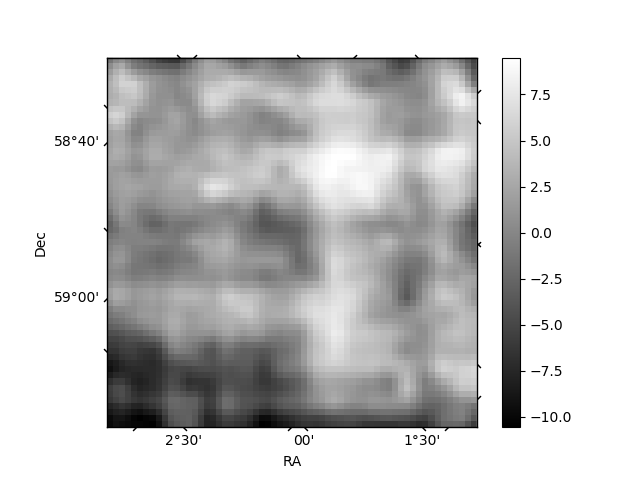
Histogram calculated using DETX and DETY for each event in the final _common_clean file
| Quadrant A | 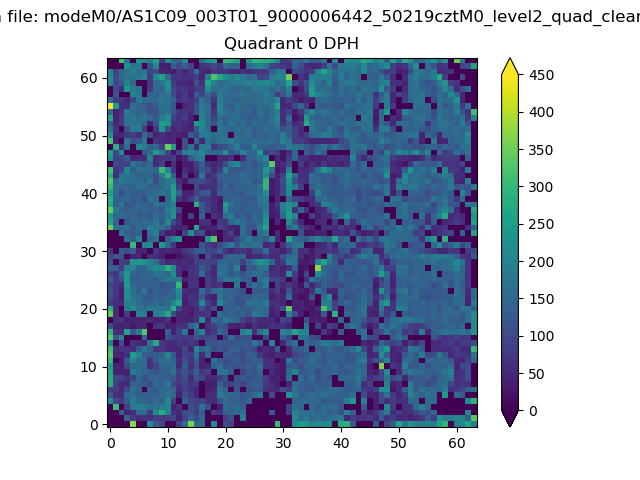 |
 |
Quadrant B |
|---|---|---|---|
| Quadrant D | 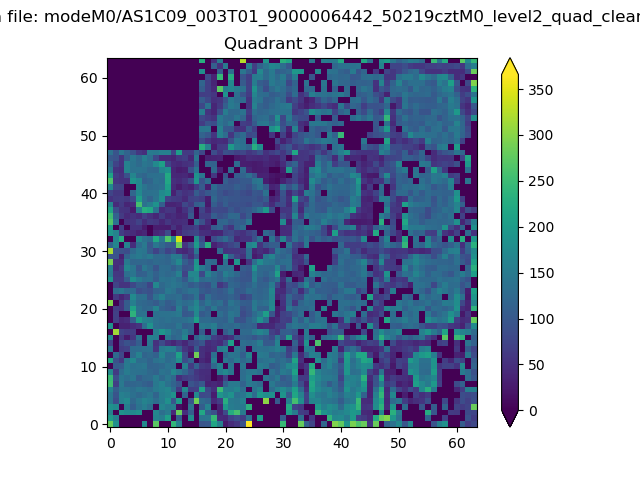 |
 |
Quadrant C |
| Plot type | Count rate plots | Images |
|---|---|---|
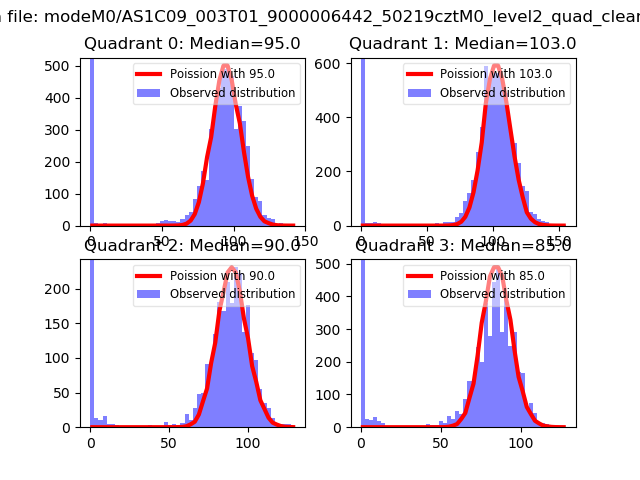
| Comparison with Poisson distribution Blue bars denote a histogram of data divided into 1 sec bins. Red curve is a Poisson curve with rate = median count rate of data. |
 |
 |
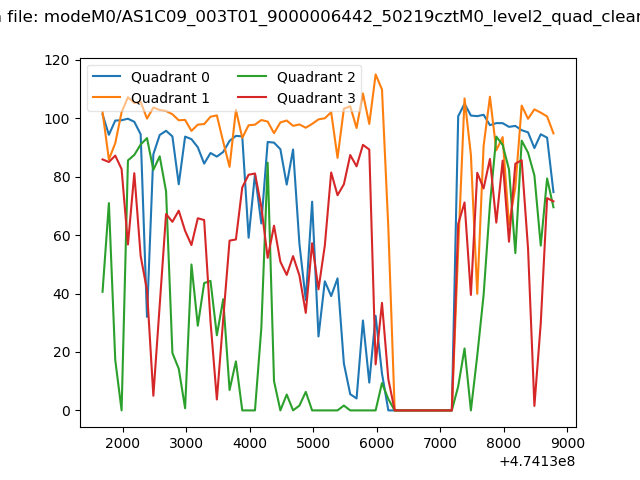
| Quadrant-wise count rates Data is divided into 100 sec bins |
 |
|
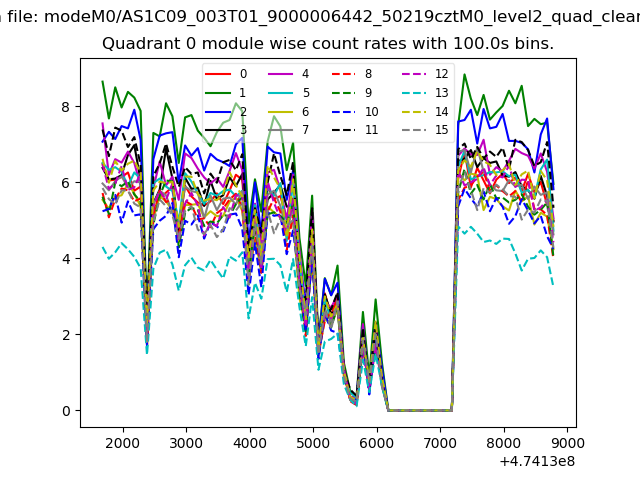
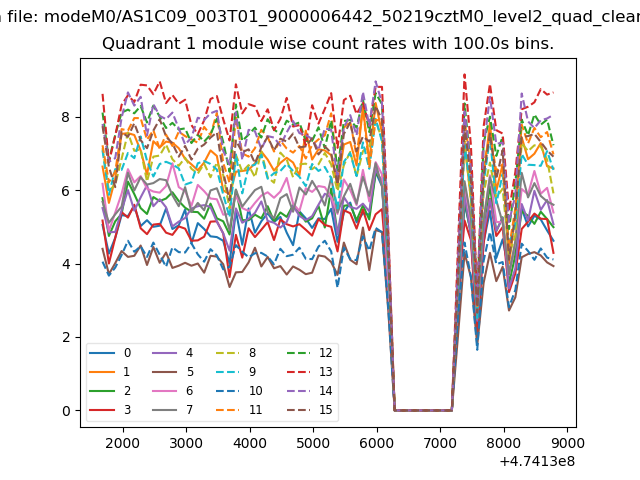
| Module-wise count rates for Quadrant A Data is divided into 100 sec bins |
 |
 |
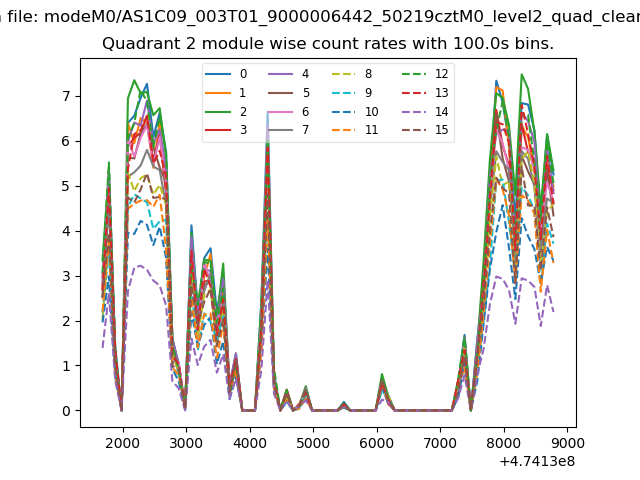
| Module-wise count rates for Quadrant B Data is divided into 100 sec bins |
 |
 |
| Module-wise count rates for Quadrant C Data is divided into 100 sec bins |
 |
 |
| Module-wise count rates for Quadrant D Data is divided into 100 sec bins |
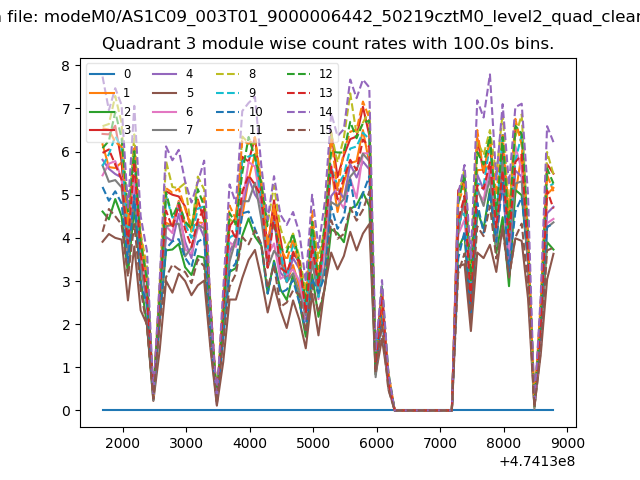 |
 |
| Parameter | Plot |
|---|---|
| CZT HV Monitor | 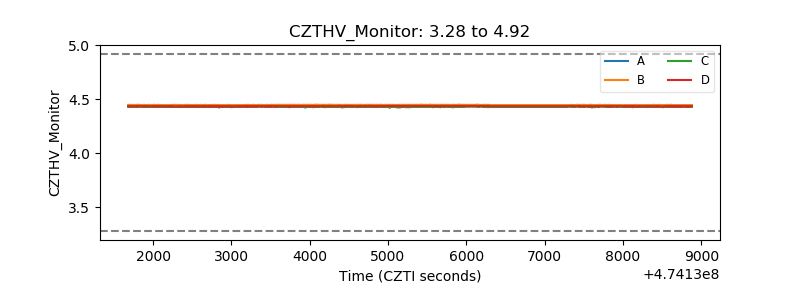 |
| D_VDD | 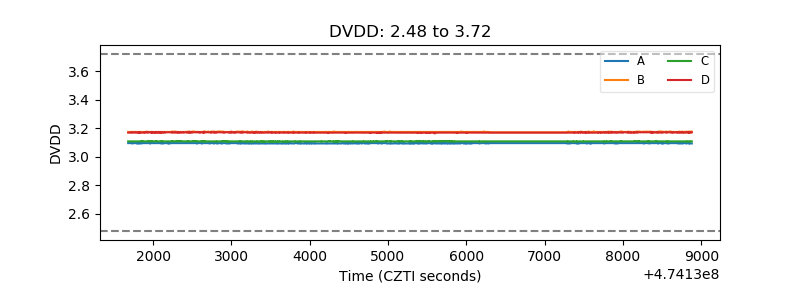 |
| Temperature 1 | 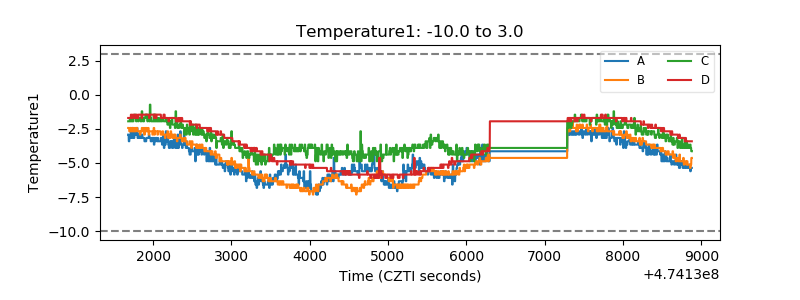 |
| Veto HV Monitor | 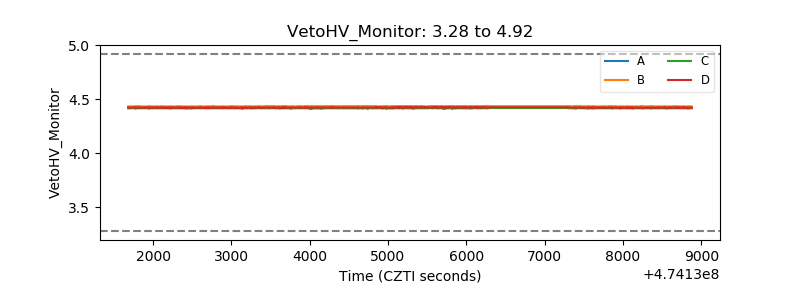 |
| Veto LLD | 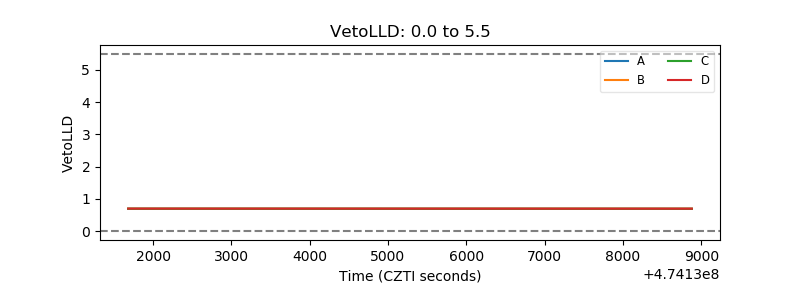 |
| Alpha Counter | 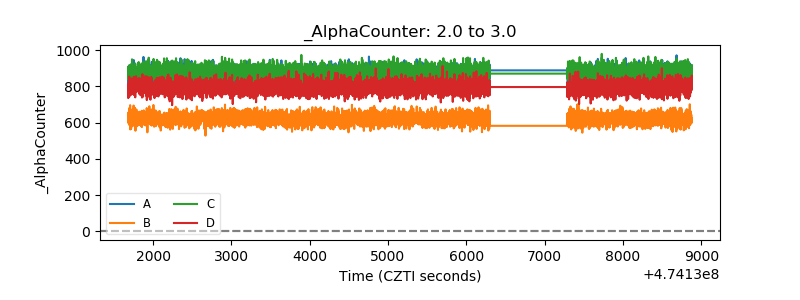 |
| _CPM_Rate | 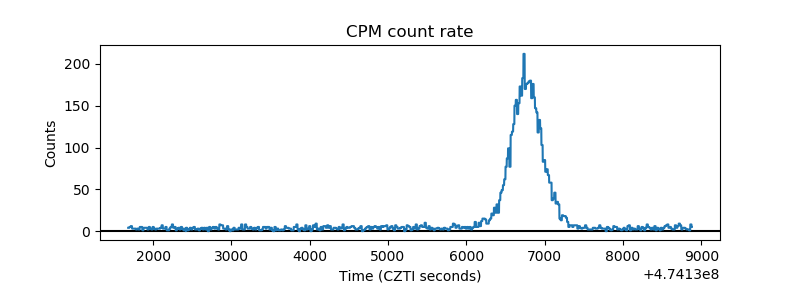 |
| CZT Counter | 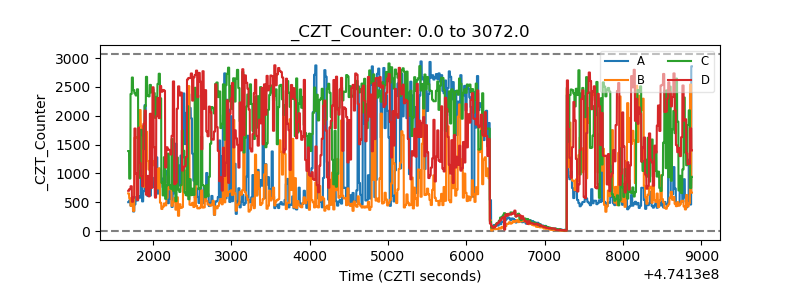 |
| +2.5 Volts monitor | 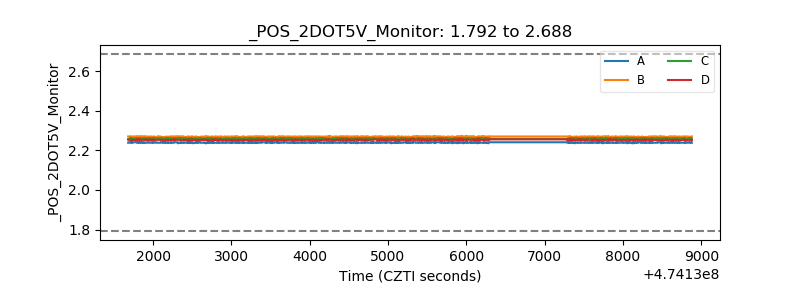 |
| +5 Volts monitor | 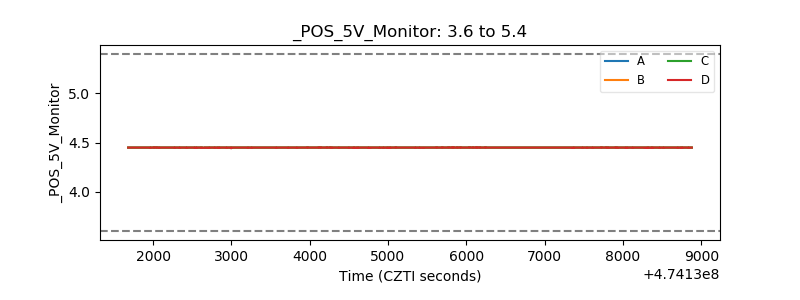 |
| _ROLL_ROT | 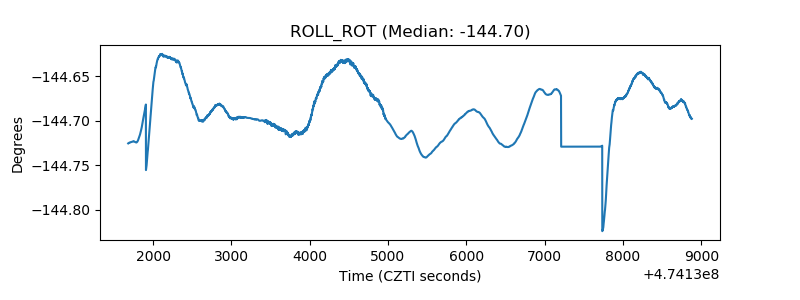 |
| _Roll_DEC | 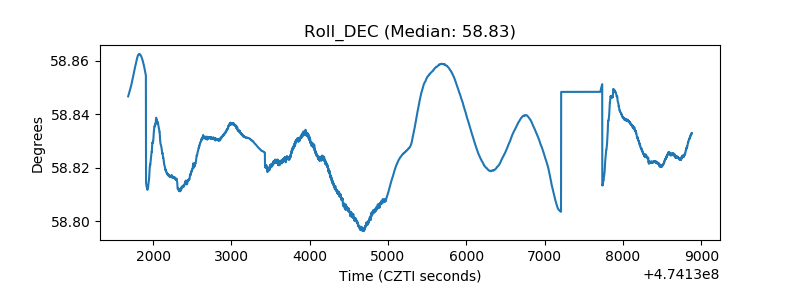 |
| _Roll_RA | 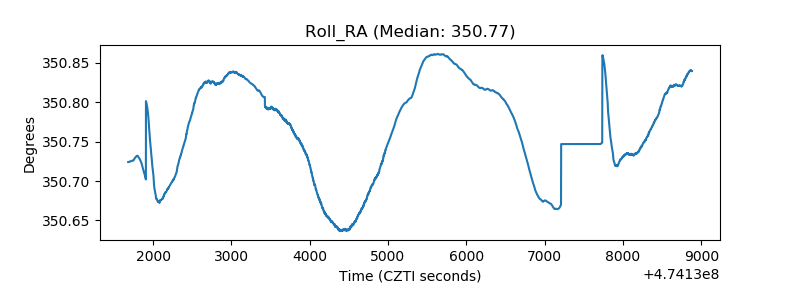 |
| Veto Counter | 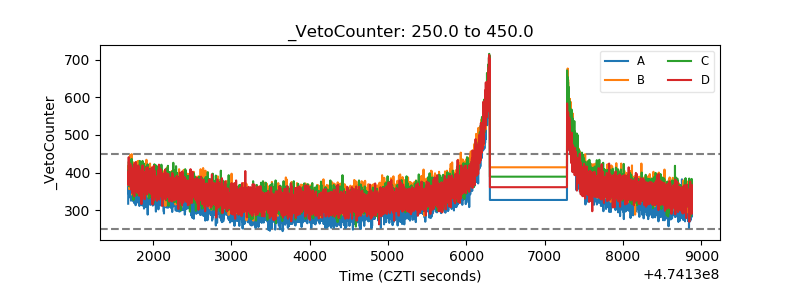 |