| Param | Original file | Final file |
|---|---|---|
| Filename | modeM0/AS1C09_003T01_9000006442_50220cztM0_level2.fits | modeM0/AS1C09_003T01_9000006442_50220cztM0_level2_quad_clean.evt |
| Size (bytes) | 1,046,234,880 | 72,676,800 |
| Size | 997.8 MB | 69.3 MB |
| Events in quadrant A | 8,608,474 | 458,516 |
| Events in quadrant B | 5,226,403 | 638,732 |
| Events in quadrant C | 12,507,303 | 271,287 |
| Events in quadrant D | 11,878,733 | 372,189 |
| Mode M9 | |||
|---|---|---|---|
| Quadrant | BADHDUFLAG | Total packets | Discarded packets |
| A | 0 | 7 | 0 |
| B | 0 | 7 | 0 |
| C | 0 | 7 | 0 |
| D | 0 | 7 | 0 |
| Mode M0 | |||
|---|---|---|---|
| Quadrant | BADHDUFLAG | Total packets | Discarded packets |
| A | 0 | 30109 | 1 |
| B | 0 | 20087 | 1 |
| C | 0 | 41698 | 1 |
| D | 0 | 39793 | 2 |
| Mode SS | |||
|---|---|---|---|
| Quadrant | BADHDUFLAG | Total packets | Discarded packets |
| A | 0 | 134 | 0 |
| B | 0 | 134 | 0 |
| C | 0 | 134 | 0 |
| D | 0 | 134 | 0 |
| Quadrant | Total seconds | Saturated seconds | Saturation percentage |
|---|---|---|---|
| A | 6586 | 1974 | 29.972669% |
| B | 6586 | 482 | 7.318555% |
| C | 6586 | 3775 | 57.318555% |
| D | 6585 | 2593 | 39.377373% |
Noise dominated data is calculated using 1-second bins in cleaned event files. If a bin has >2000 counts, and if more than 50% of those come from <1% of pixels, then it is considered to be noise-dominated and hence unusable.
| Quadrant | # 1 sec bins | Bins with >0 counts | Bins with >2000 counts | High rate bins dominated by noise | Noise dominated (total time) | Noise dominated (detector-on time) | Marked lightcurve |
|---|---|---|---|---|---|---|---|
| A | 7286 | 6586 | 1837 | 1837 | 25.21% | 27.89% | 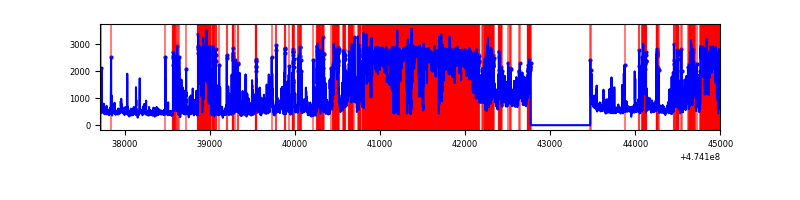 |
| B | 7286 | 6587 | 315 | 315 | 4.32% | 4.78% | 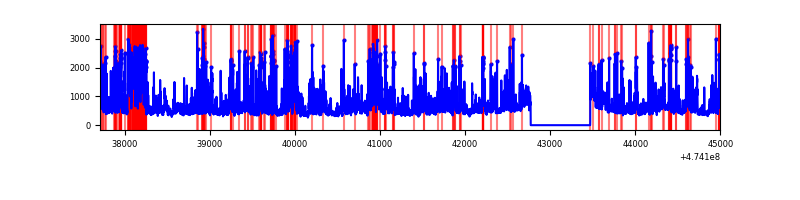 |
| C | 7285 | 6585 | 3674 | 3674 | 50.43% | 55.79% | 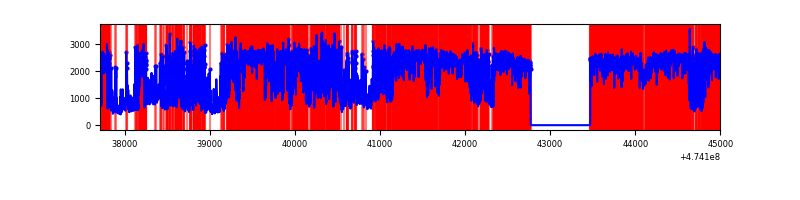 |
| D | 7285 | 6585 | 2660 | 2660 | 36.51% | 40.39% | 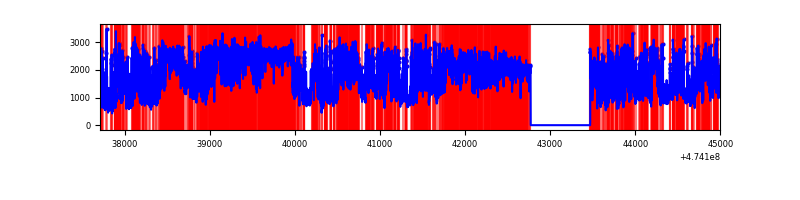 |
Top three noisy pixels from each quadrant. If the there are fewer than three noisy pixels in the level2.evt file, extra rows are filled as -1
| Pixel properties | Quadrant properties | ||||||
|---|---|---|---|---|---|---|---|
| Quadrant | DetID | PixID | Counts | Sigma | Mean | Median | Sigma |
| A | 0 | 98 | 2152325 | 14630.38 | 595 | 580 | 147.1 |
| A | 4 | 249 | 1805136 | 12269.73 | 595 | 580 | 147.1 |
| A | 8 | 38 | 519878 | 3530.87 | 595 | 580 | 147.1 |
| B | 4 | 206 | 1849359 | 12935.14 | 677 | 655 | 142.9 |
| B | 5 | 185 | 168217 | 1172.41 | 677 | 655 | 142.9 |
| B | 3 | 249 | 69188 | 479.52 | 677 | 655 | 142.9 |
| C | 4 | 111 | 5862525 | 47062.7 | 444 | 441 | 124.6 |
| C | 15 | 197 | 1785889 | 14334.15 | 444 | 441 | 124.6 |
| C | 15 | 213 | 811006 | 6507.48 | 444 | 441 | 124.6 |
| D | 15 | 108 | 2518753 | 15183.77 | 580 | 559 | 165.8 |
| D | 7 | 61 | 1815481 | 10943.3 | 580 | 559 | 165.8 |
| D | 15 | 94 | 935736 | 5638.77 | 580 | 559 | 165.8 |
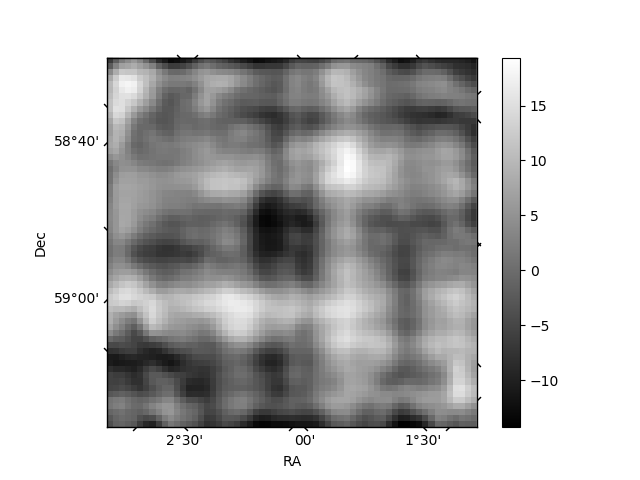
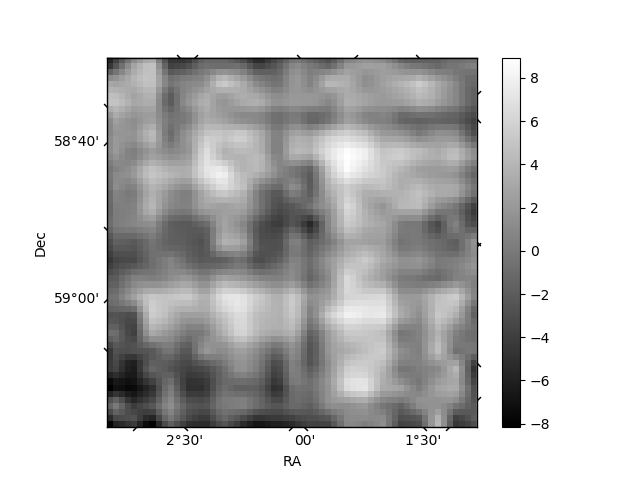
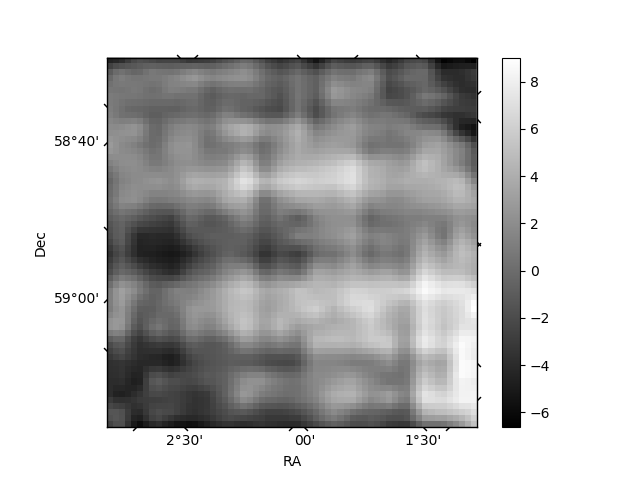
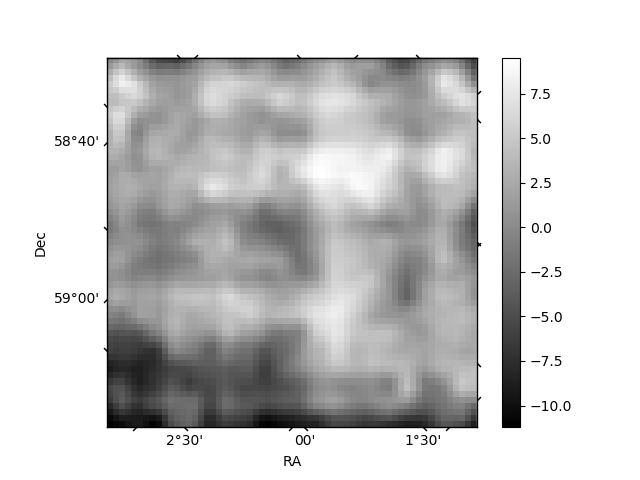
Histogram calculated using DETX and DETY for each event in the final _common_clean file
| Quadrant A | 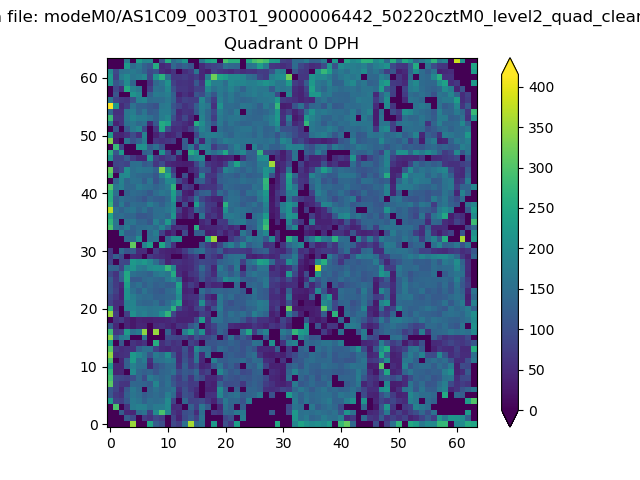 |
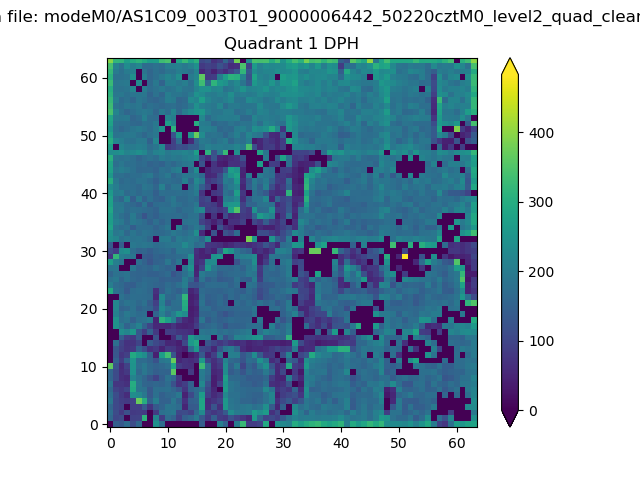 |
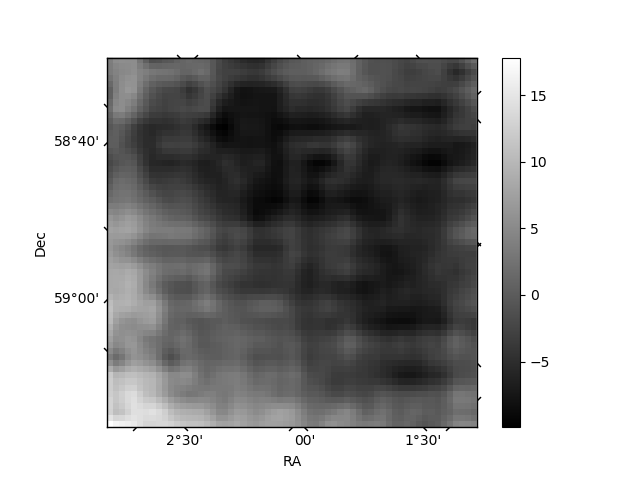
Quadrant B |
|---|---|---|---|
| Quadrant D | 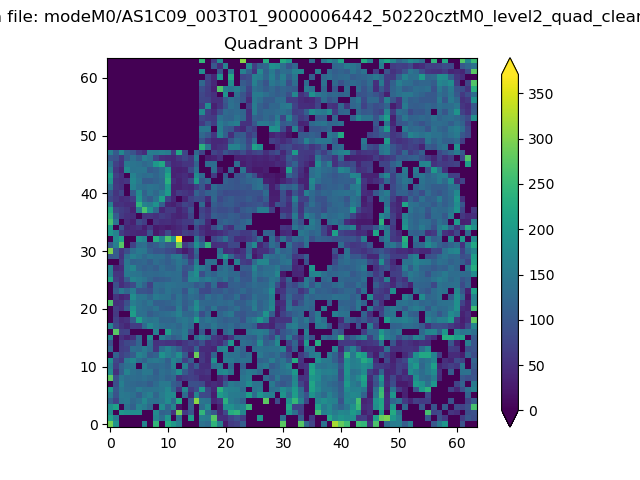 |
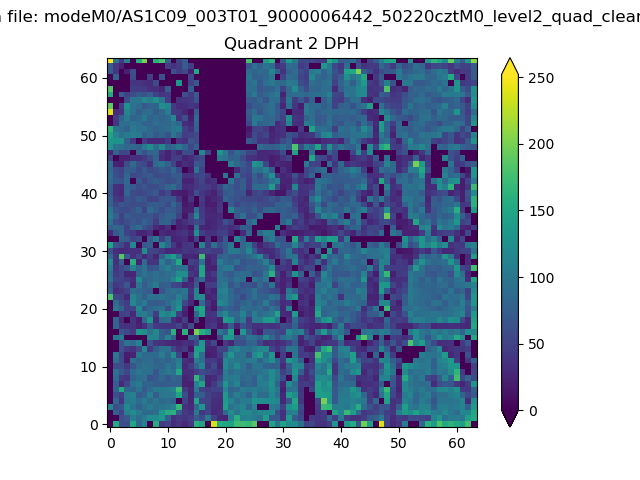 |
Quadrant C |
| Plot type | Count rate plots | Images |
|---|---|---|
| Comparison with Poisson distribution Blue bars denote a histogram of data divided into 1 sec bins. Red curve is a Poisson curve with rate = median count rate of data. |
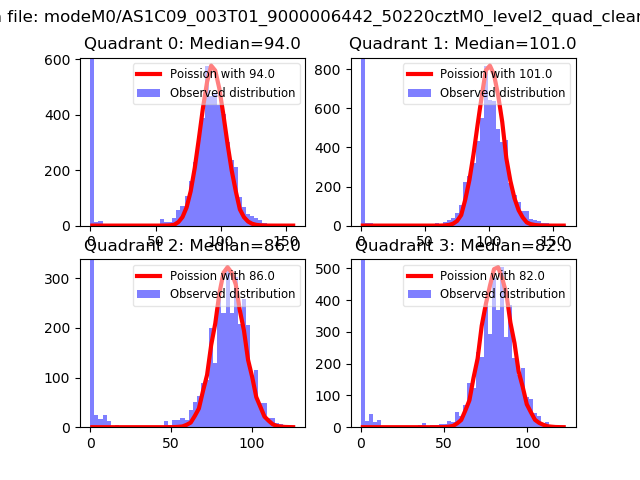 |
 |
| Quadrant-wise count rates Data is divided into 100 sec bins |
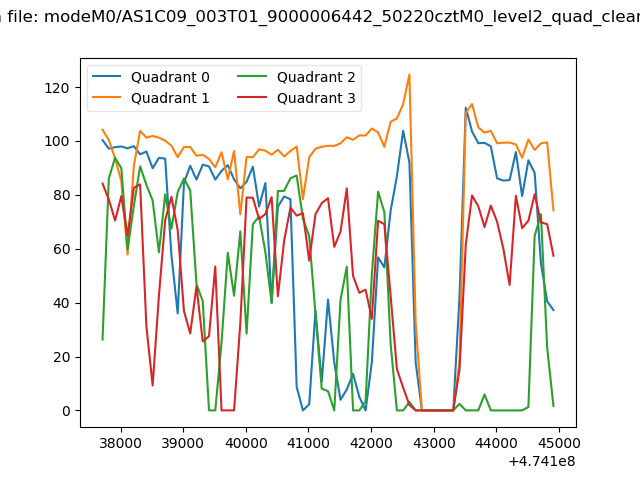 |
|
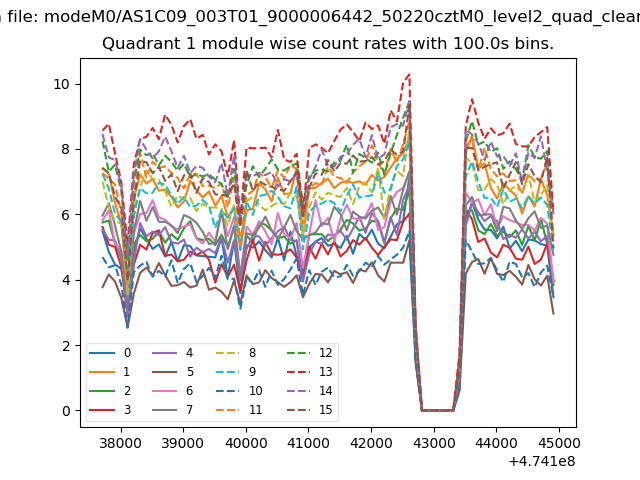
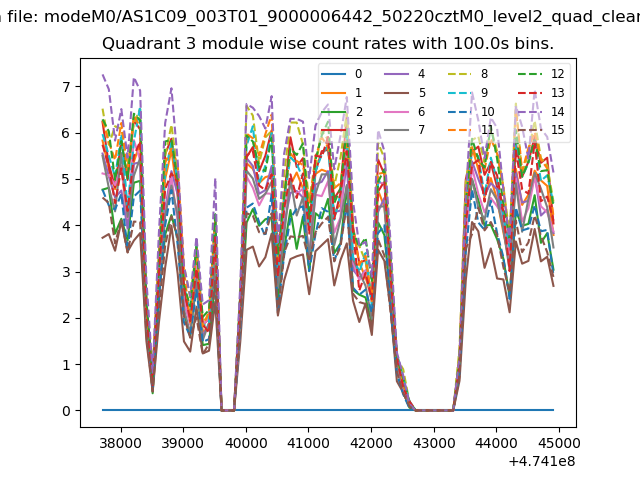
| Module-wise count rates for Quadrant A Data is divided into 100 sec bins |
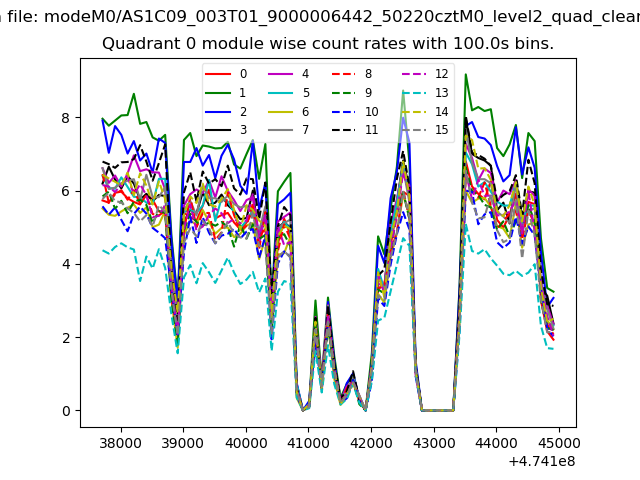 |
 |
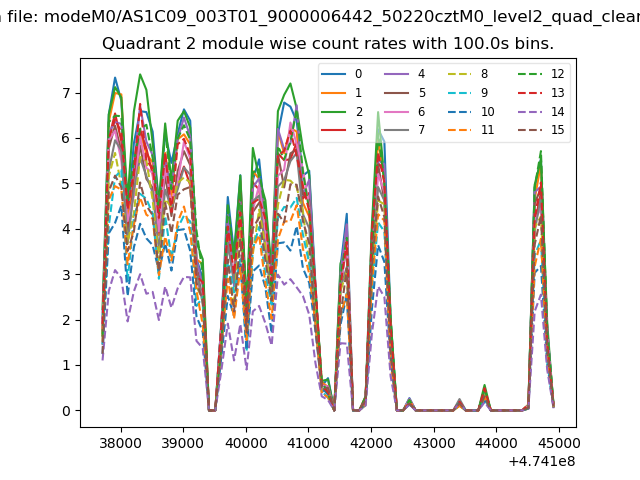
| Module-wise count rates for Quadrant B Data is divided into 100 sec bins |
 |
 |
| Module-wise count rates for Quadrant C Data is divided into 100 sec bins |
 |
 |
| Module-wise count rates for Quadrant D Data is divided into 100 sec bins |
 |
 |
| Parameter | Plot |
|---|---|
| CZT HV Monitor | 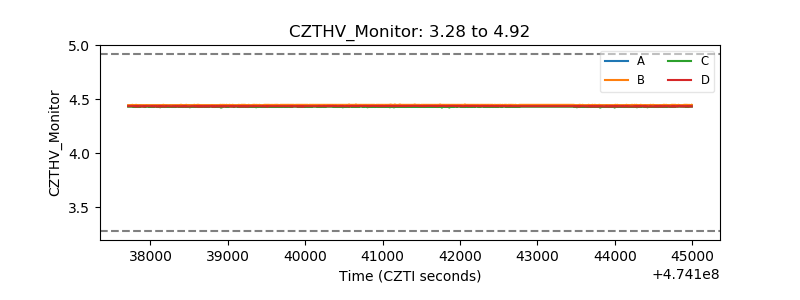 |
| D_VDD | 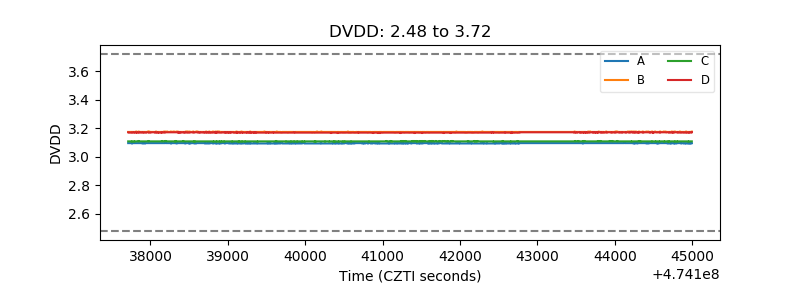 |
| Temperature 1 |  |
| Veto HV Monitor |  |
| Veto LLD | 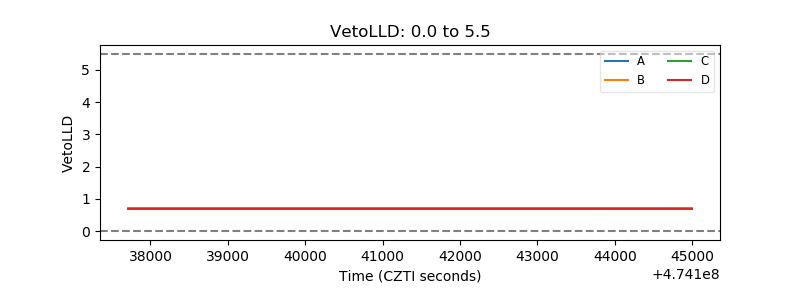 |
| Alpha Counter | 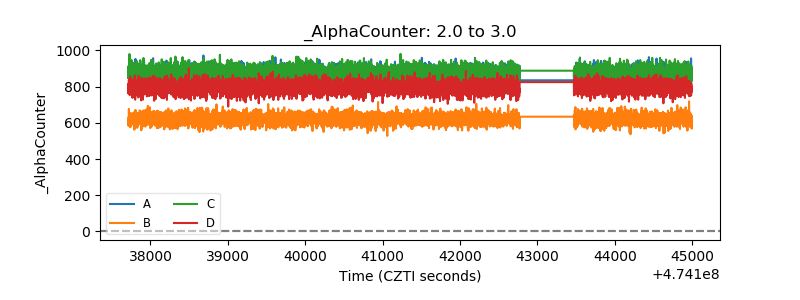 |
| _CPM_Rate | 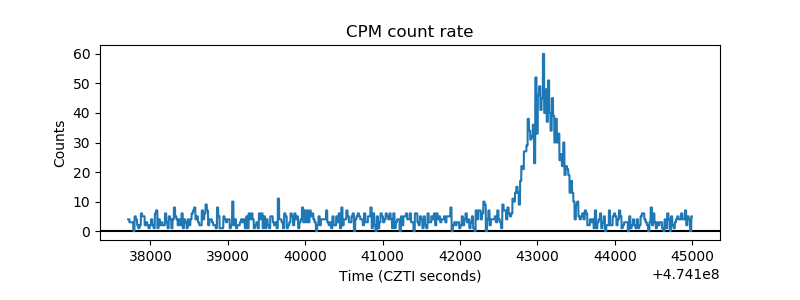 |
| CZT Counter | 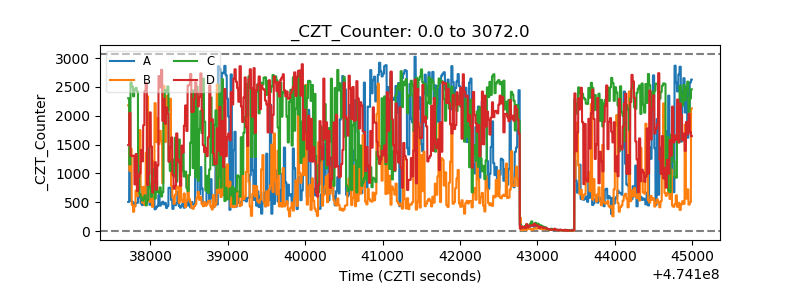 |
| +2.5 Volts monitor |  |
| +5 Volts monitor |  |
| _ROLL_ROT | 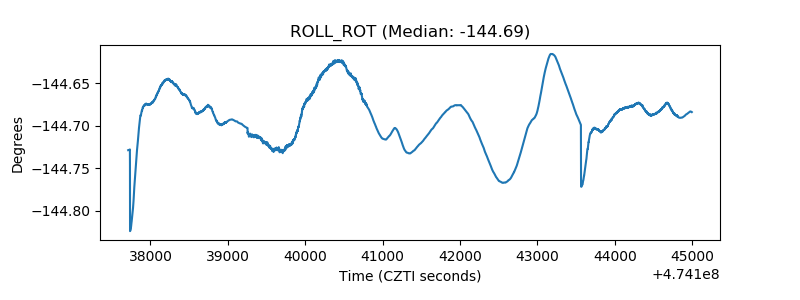 |
| _Roll_DEC | 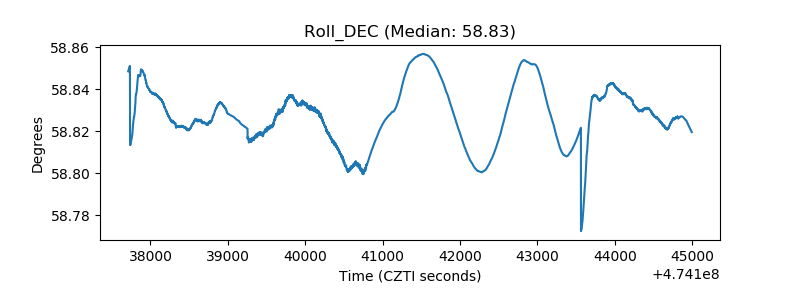 |
| _Roll_RA | 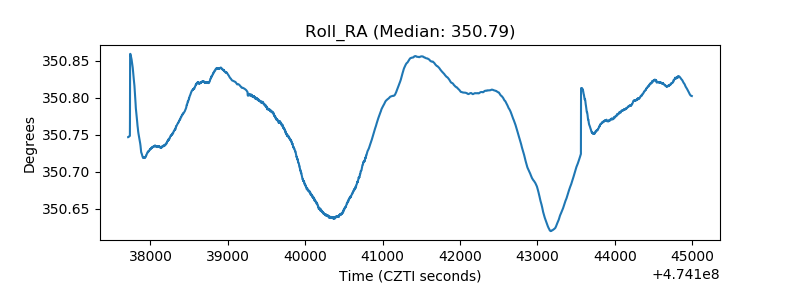 |
| Veto Counter | 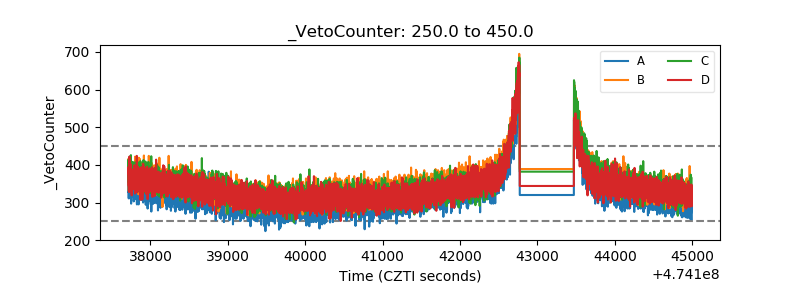 |