| Param | Original file | Final file |
|---|---|---|
| Filename | modeM0/AS1C09_003T01_9000006442_50221cztM0_level2.fits | modeM0/AS1C09_003T01_9000006442_50221cztM0_level2_quad_clean.evt |
| Size (bytes) | 1,282,219,200 | 80,988,480 |
| Size | 1.2 GB | 77.2 MB |
| Events in quadrant A | 10,868,194 | 491,306 |
| Events in quadrant B | 6,627,983 | 731,196 |
| Events in quadrant C | 15,478,877 | 281,013 |
| Events in quadrant D | 13,895,858 | 412,060 |
| Mode M0 | |||
|---|---|---|---|
| Quadrant | BADHDUFLAG | Total packets | Discarded packets |
| A | 0 | 37624 | 0 |
| B | 0 | 25046 | 0 |
| C | 0 | 51286 | 0 |
| D | 0 | 46613 | 4 |
| Mode SS | |||
|---|---|---|---|
| Quadrant | BADHDUFLAG | Total packets | Discarded packets |
| A | 0 | 154 | 0 |
| B | 0 | 154 | 0 |
| C | 0 | 154 | 0 |
| D | 0 | 154 | 0 |
| Quadrant | Total seconds | Saturated seconds | Saturation percentage |
|---|---|---|---|
| A | 7705 | 2694 | 34.964309% |
| B | 7705 | 762 | 9.889682% |
| C | 7706 | 4863 | 63.106670% |
| D | 7705 | 3210 | 41.661259% |
Noise dominated data is calculated using 1-second bins in cleaned event files. If a bin has >2000 counts, and if more than 50% of those come from <1% of pixels, then it is considered to be noise-dominated and hence unusable.
| Quadrant | # 1 sec bins | Bins with >0 counts | Bins with >2000 counts | High rate bins dominated by noise | Noise dominated (total time) | Noise dominated (detector-on time) | Marked lightcurve |
|---|---|---|---|---|---|---|---|
| A | 7705 | 7705 | 2443 | 2443 | 31.71% | 31.71% | 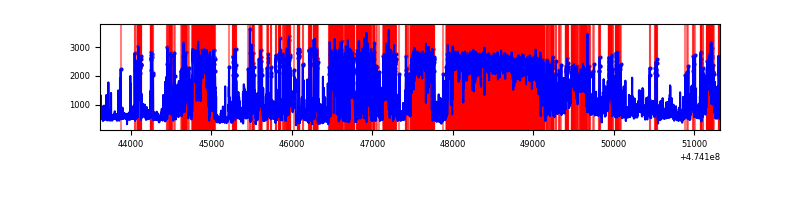 |
| B | 7705 | 7705 | 518 | 518 | 6.72% | 6.72% | 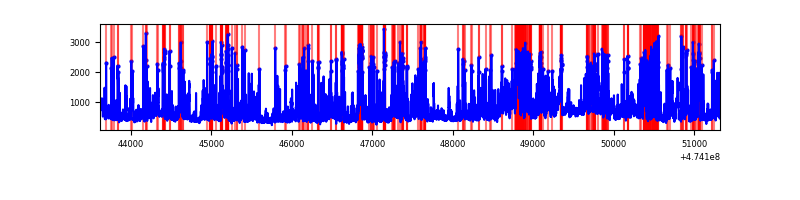 |
| C | 7705 | 7705 | 4747 | 4747 | 61.61% | 61.61% | 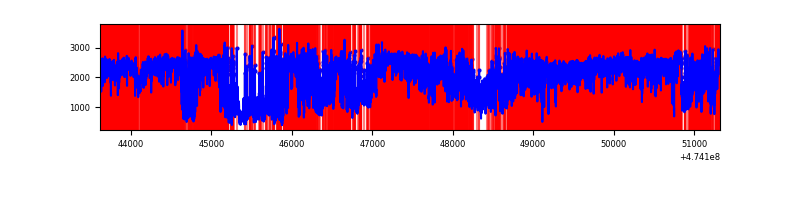 |
| D | 7704 | 7704 | 3069 | 3069 | 39.84% | 39.84% | 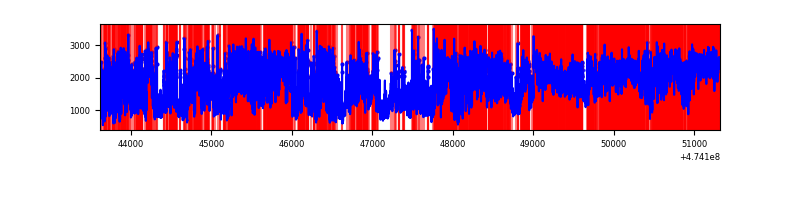 |
Top three noisy pixels from each quadrant. If the there are fewer than three noisy pixels in the level2.evt file, extra rows are filled as -1
| Pixel properties | Quadrant properties | ||||||
|---|---|---|---|---|---|---|---|
| Quadrant | DetID | PixID | Counts | Sigma | Mean | Median | Sigma |
| A | 0 | 98 | 4780070 | 26897.75 | 708 | 689 | 177.7 |
| A | 4 | 249 | 1131842 | 6365.99 | 708 | 689 | 177.7 |
| A | 4 | 156 | 354863 | 1993.25 | 708 | 689 | 177.7 |
| B | 4 | 206 | 2536962 | 15235.83 | 792 | 765 | 166.5 |
| B | 5 | 185 | 210897 | 1262.34 | 792 | 765 | 166.5 |
| B | 8 | 128 | 104541 | 623.42 | 792 | 765 | 166.5 |
| C | 4 | 111 | 4050854 | 27244.0 | 531 | 526 | 148.7 |
| C | 15 | 197 | 3590745 | 24149.14 | 531 | 526 | 148.7 |
| C | 15 | 213 | 1249504 | 8401.09 | 531 | 526 | 148.7 |
| D | 15 | 108 | 3053583 | 15550.91 | 692 | 669 | 196.3 |
| D | 7 | 61 | 2344216 | 11937.54 | 692 | 669 | 196.3 |
| D | 15 | 94 | 1228501 | 6254.32 | 692 | 669 | 196.3 |
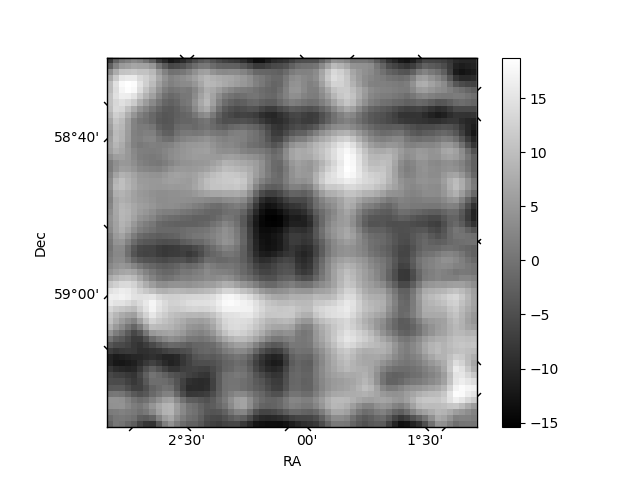
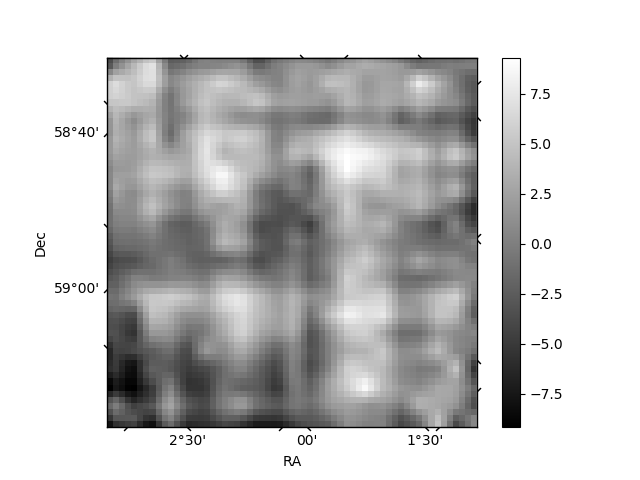
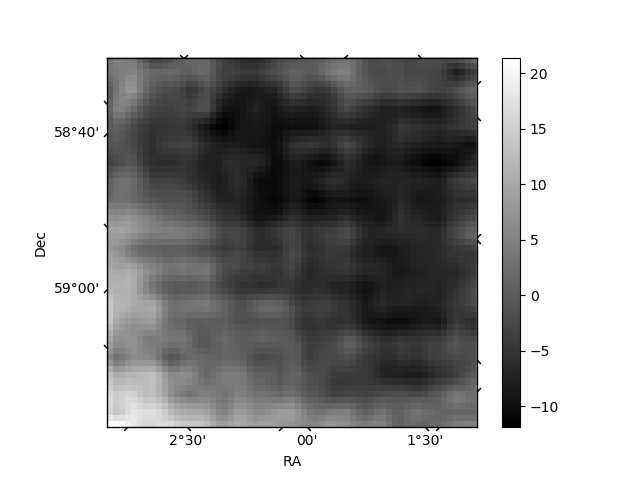
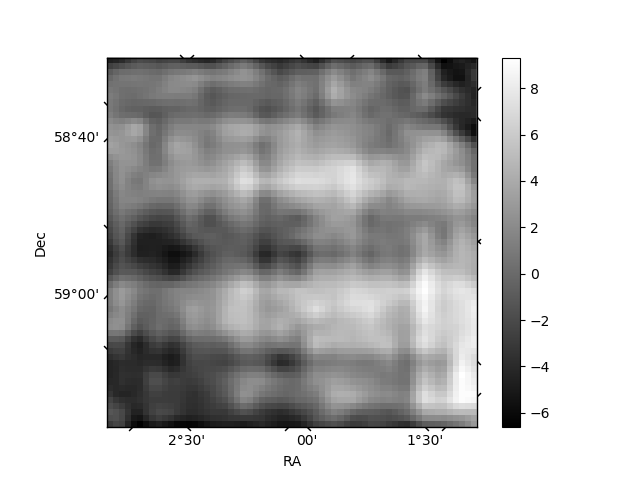
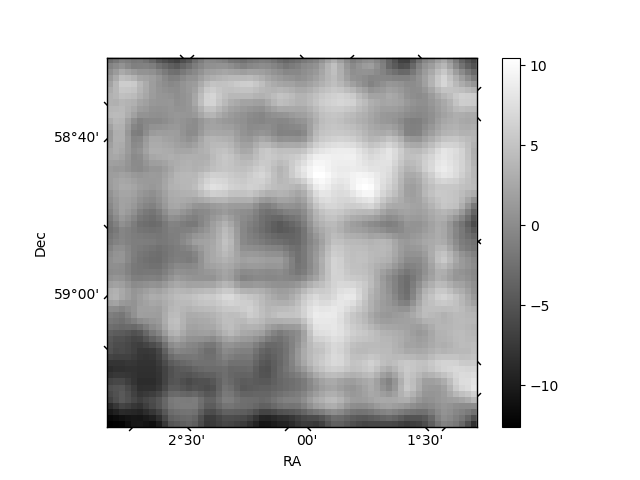
Histogram calculated using DETX and DETY for each event in the final _common_clean file
| Quadrant A | 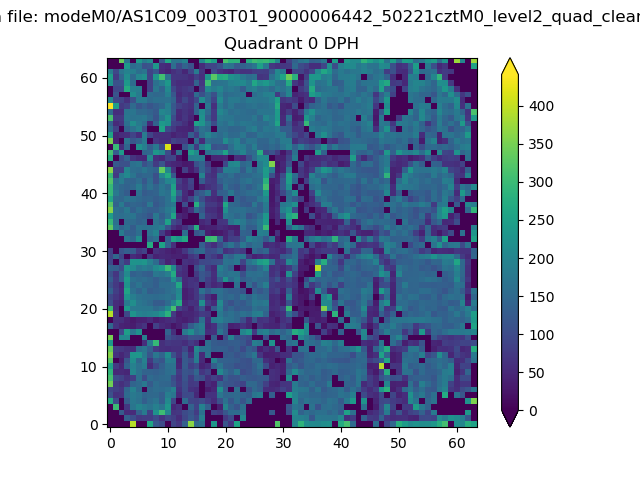 |
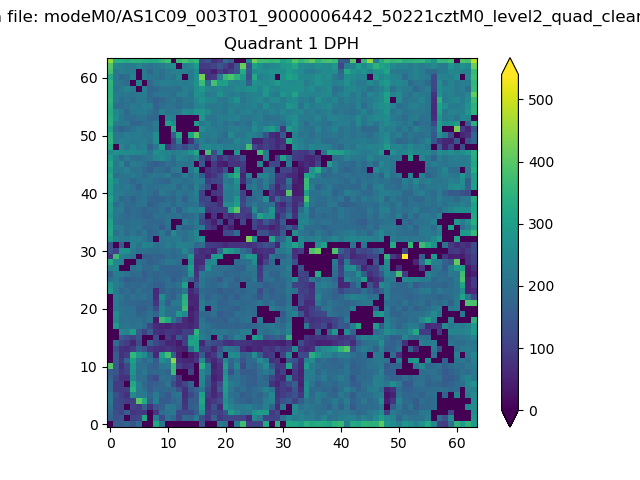 |
Quadrant B |
|---|---|---|---|
| Quadrant D | 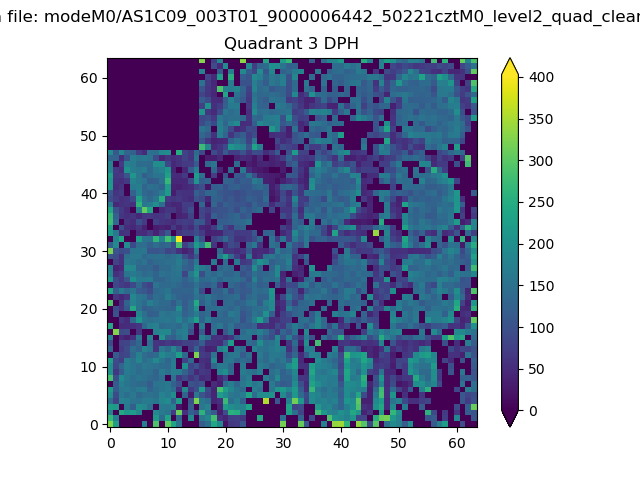 |
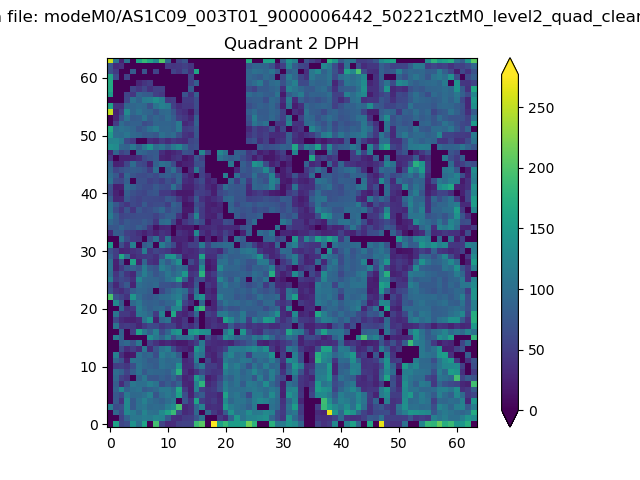 |
Quadrant C |
| Plot type | Count rate plots | Images |
|---|---|---|
| Comparison with Poisson distribution Blue bars denote a histogram of data divided into 1 sec bins. Red curve is a Poisson curve with rate = median count rate of data. |
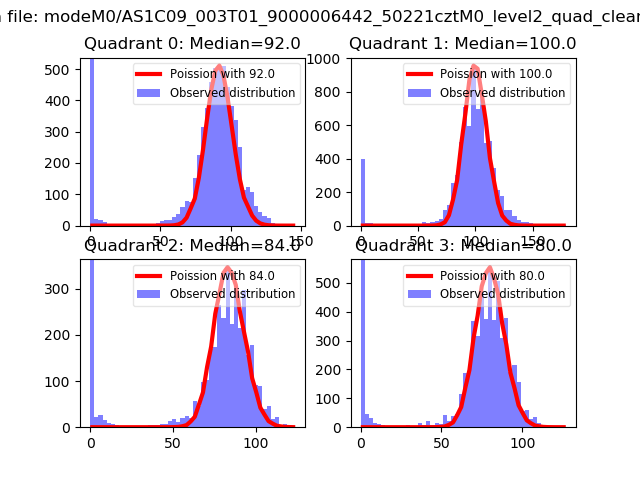 |
 |
| Quadrant-wise count rates Data is divided into 100 sec bins |
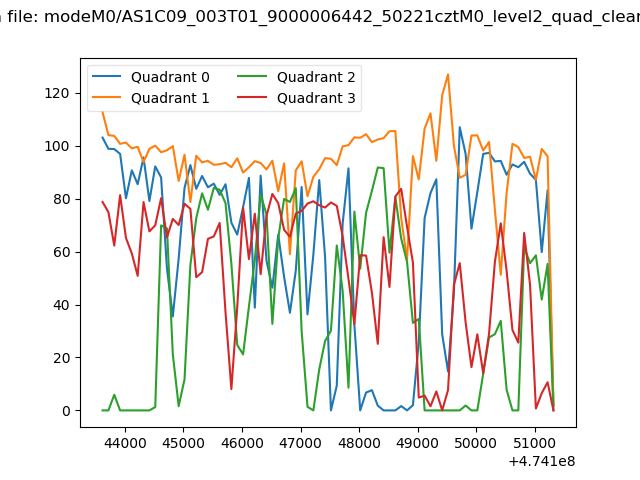 |
|
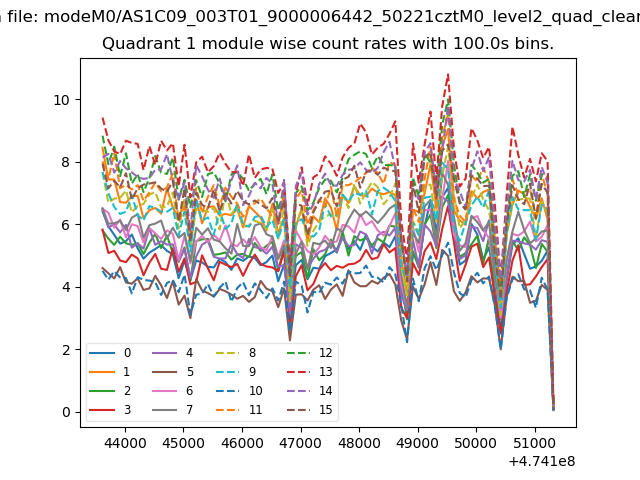
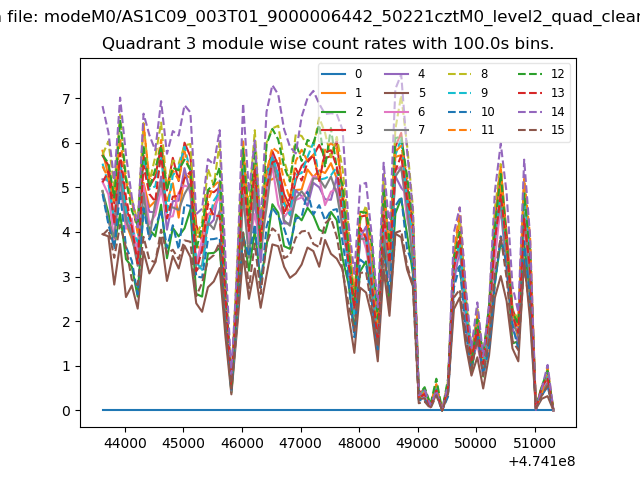
| Module-wise count rates for Quadrant A Data is divided into 100 sec bins |
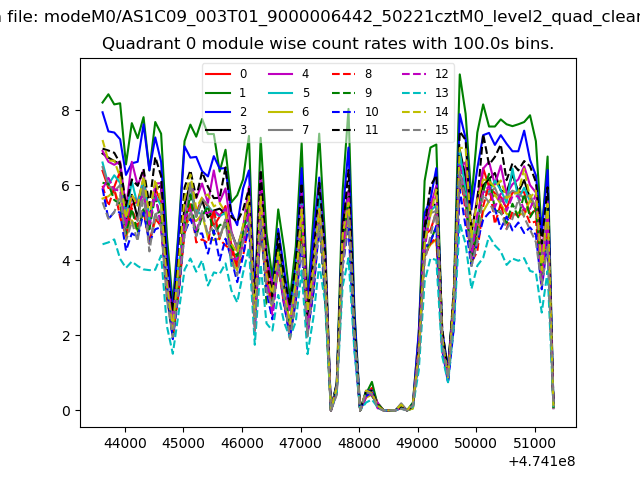 |
 |
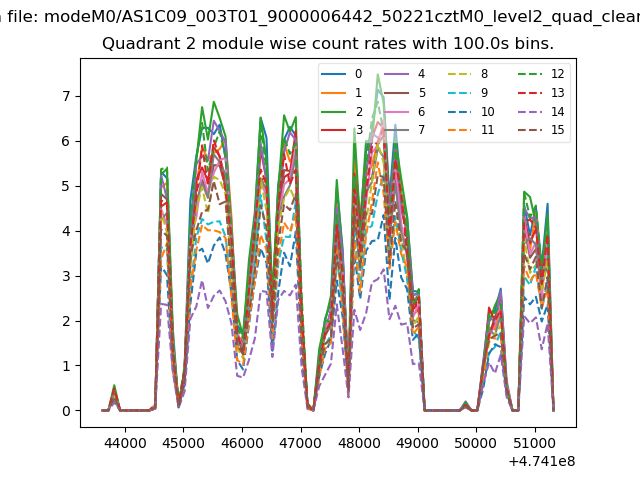
| Module-wise count rates for Quadrant B Data is divided into 100 sec bins |
 |
 |
| Module-wise count rates for Quadrant C Data is divided into 100 sec bins |
 |
 |
| Module-wise count rates for Quadrant D Data is divided into 100 sec bins |
 |
 |
| Parameter | Plot |
|---|---|
| CZT HV Monitor |  |
| D_VDD | 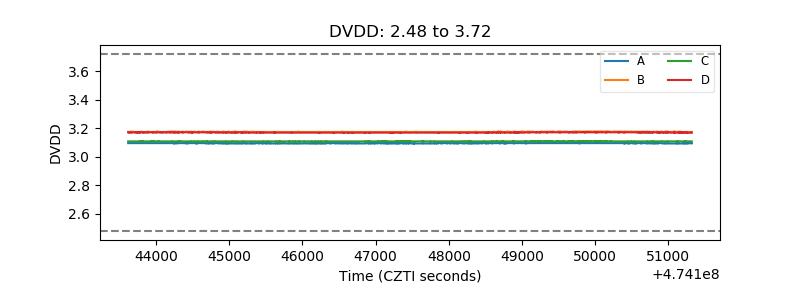 |
| Temperature 1 | 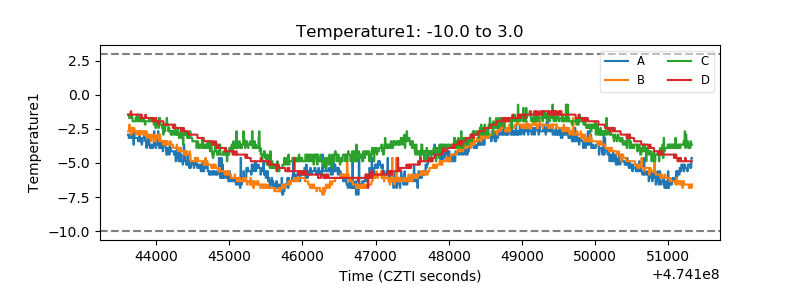 |
| Veto HV Monitor | 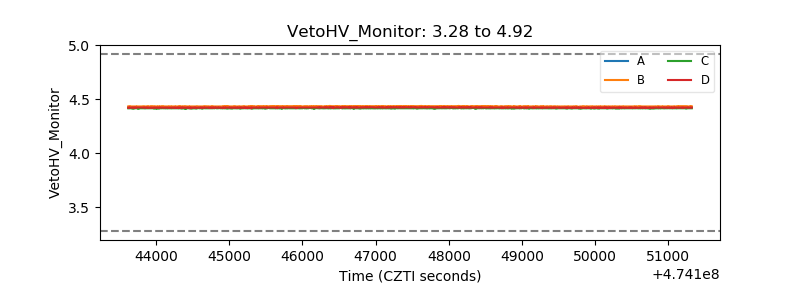 |
| Veto LLD | 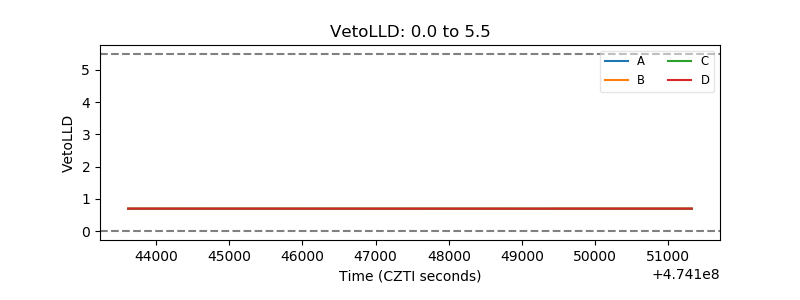 |
| Alpha Counter | 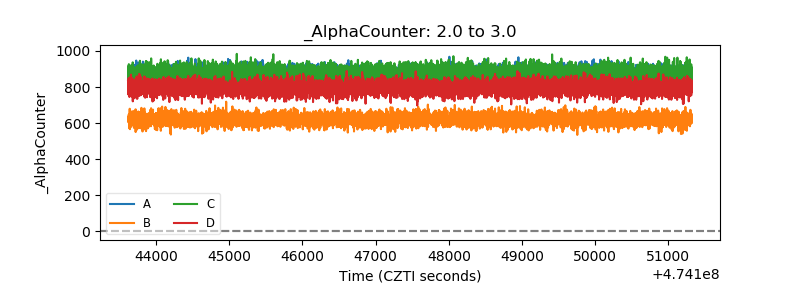 |
| _CPM_Rate | 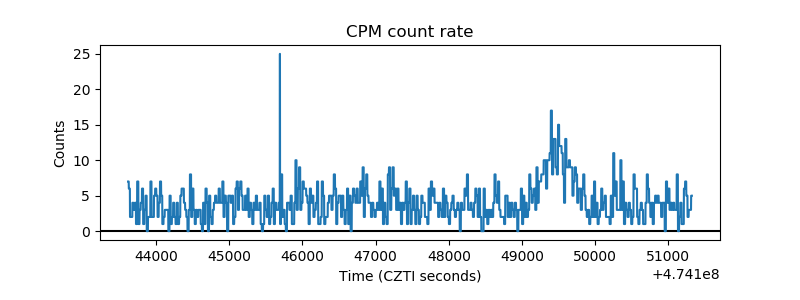 |
| CZT Counter | 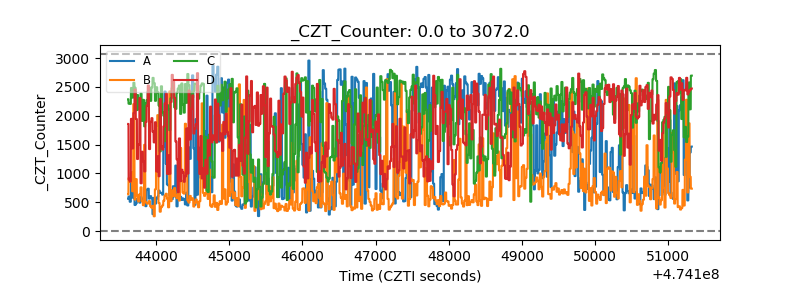 |
| +2.5 Volts monitor | 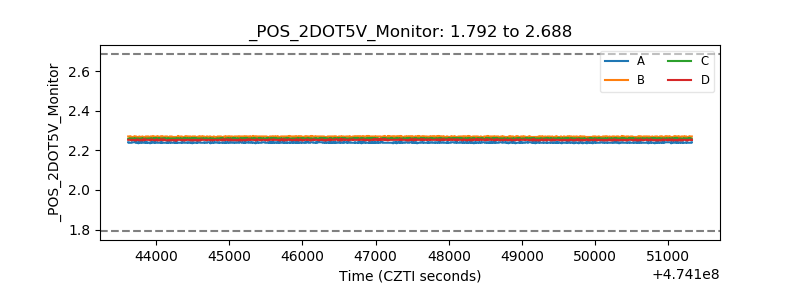 |
| +5 Volts monitor |  |
| _ROLL_ROT | 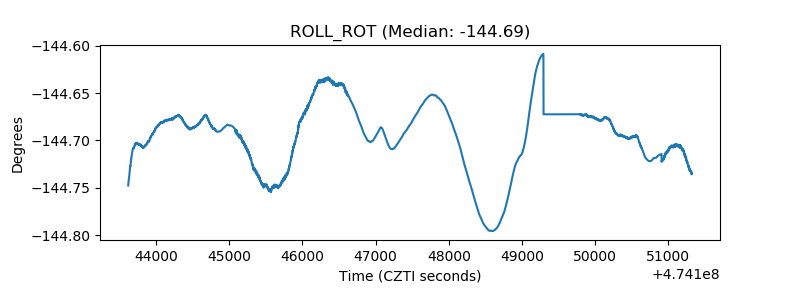 |
| _Roll_DEC | 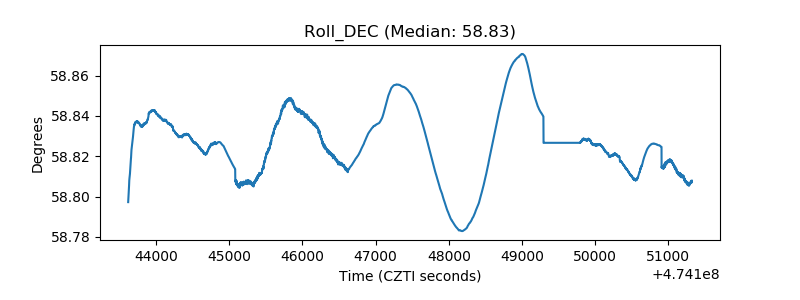 |
| _Roll_RA | 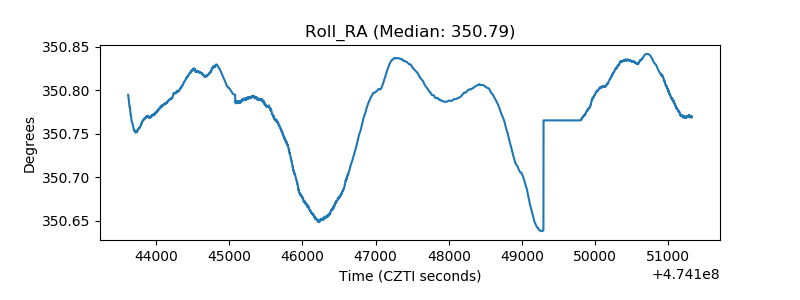 |
| Veto Counter | 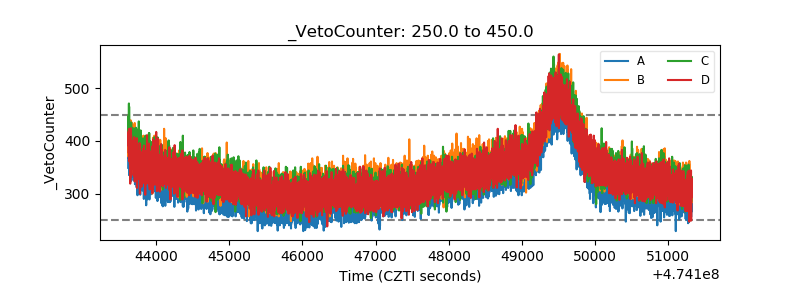 |