| Param | Original file | Final file |
|---|---|---|
| Filename | modeM0/AS1C09_003T01_9000006442_50222cztM0_level2.fits | modeM0/AS1C09_003T01_9000006442_50222cztM0_level2_quad_clean.evt |
| Size (bytes) | 1,583,038,080 | 57,202,560 |
| Size | 1.5 GB | 54.6 MB |
| Events in quadrant A | 14,991,811 | 306,535 |
| Events in quadrant B | 6,294,382 | 751,563 |
| Events in quadrant C | 18,759,534 | 51,444 |
| Events in quadrant D | 17,954,989 | 80,165 |
| Mode M0 | |||
|---|---|---|---|
| Quadrant | BADHDUFLAG | Total packets | Discarded packets |
| A | 0 | 49955 | 0 |
| B | 0 | 24099 | 0 |
| C | 0 | 61126 | 0 |
| D | 0 | 58594 | 0 |
| Mode SS | |||
|---|---|---|---|
| Quadrant | BADHDUFLAG | Total packets | Discarded packets |
| A | 0 | 156 | 0 |
| B | 0 | 156 | 0 |
| C | 0 | 156 | 0 |
| D | 0 | 156 | 0 |
| Quadrant | Total seconds | Saturated seconds | Saturation percentage |
|---|---|---|---|
| A | 7789 | 4778 | 61.342920% |
| B | 7789 | 453 | 5.815894% |
| C | 7789 | 7311 | 93.863140% |
| D | 7789 | 7046 | 90.460906% |
Noise dominated data is calculated using 1-second bins in cleaned event files. If a bin has >2000 counts, and if more than 50% of those come from <1% of pixels, then it is considered to be noise-dominated and hence unusable.
| Quadrant | # 1 sec bins | Bins with >0 counts | Bins with >2000 counts | High rate bins dominated by noise | Noise dominated (total time) | Noise dominated (detector-on time) | Marked lightcurve |
|---|---|---|---|---|---|---|---|
| A | 7789 | 7789 | 4671 | 4671 | 59.97% | 59.97% | 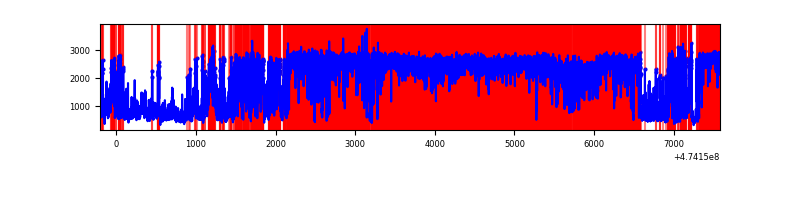 |
| B | 7789 | 7789 | 344 | 344 | 4.42% | 4.42% | 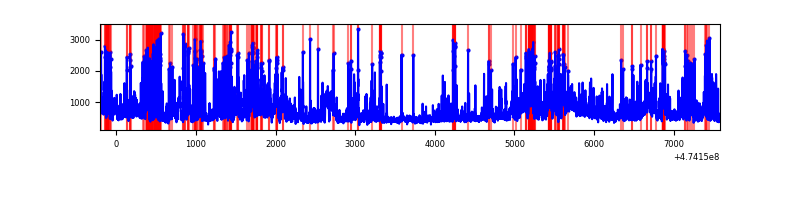 |
| C | 7788 | 7788 | 6875 | 6875 | 88.28% | 88.28% | 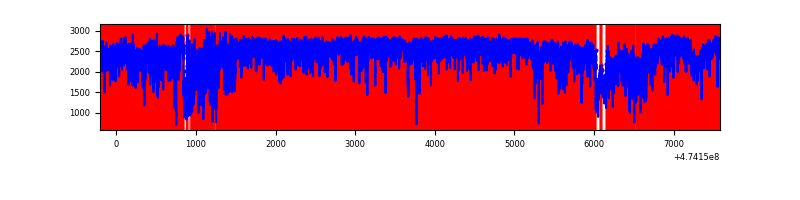 |
| D | 7788 | 7788 | 6702 | 6702 | 86.06% | 86.06% | 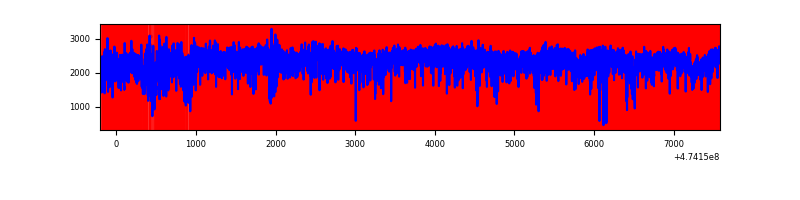 |
Top three noisy pixels from each quadrant. If the there are fewer than three noisy pixels in the level2.evt file, extra rows are filled as -1
| Pixel properties | Quadrant properties | ||||||
|---|---|---|---|---|---|---|---|
| Quadrant | DetID | PixID | Counts | Sigma | Mean | Median | Sigma |
| A | 0 | 98 | 9806251 | 64938.26 | 587 | 570 | 151.0 |
| A | 4 | 249 | 675536 | 4469.97 | 587 | 570 | 151.0 |
| A | 7 | 206 | 468047 | 3095.87 | 587 | 570 | 151.0 |
| B | 4 | 206 | 1758196 | 10395.08 | 797 | 770 | 169.1 |
| B | 10 | 28 | 285054 | 1681.52 | 797 | 770 | 169.1 |
| B | 9 | 218 | 130221 | 765.7 | 797 | 770 | 169.1 |
| C | 15 | 197 | 9664986 | 108204.37 | 301 | 296 | 89.3 |
| C | 4 | 111 | 2676284 | 29959.95 | 301 | 296 | 89.3 |
| C | 15 | 213 | 1717383 | 19224.24 | 301 | 296 | 89.3 |
| D | 7 | 61 | 6056948 | 45854.42 | 426 | 409 | 132.1 |
| D | 15 | 108 | 2942056 | 22271.38 | 426 | 409 | 132.1 |
| D | 7 | 43 | 1396122 | 10567.03 | 426 | 409 | 132.1 |
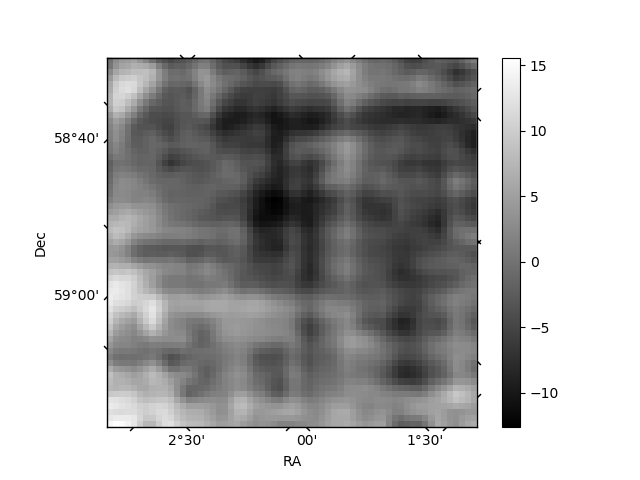
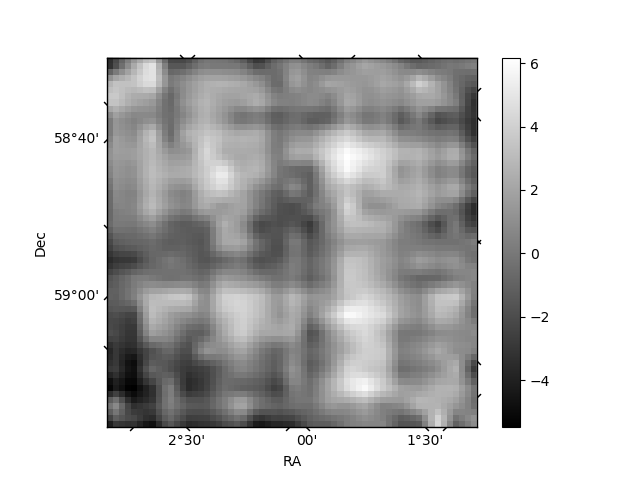
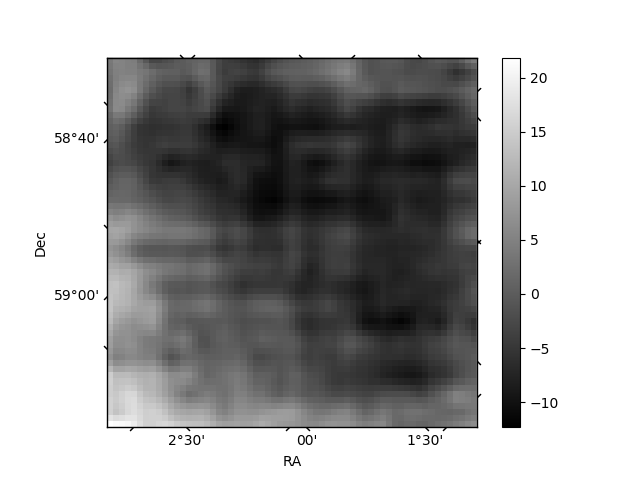
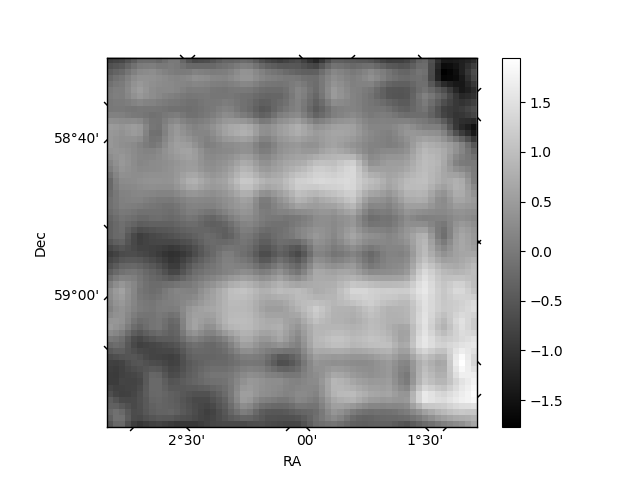
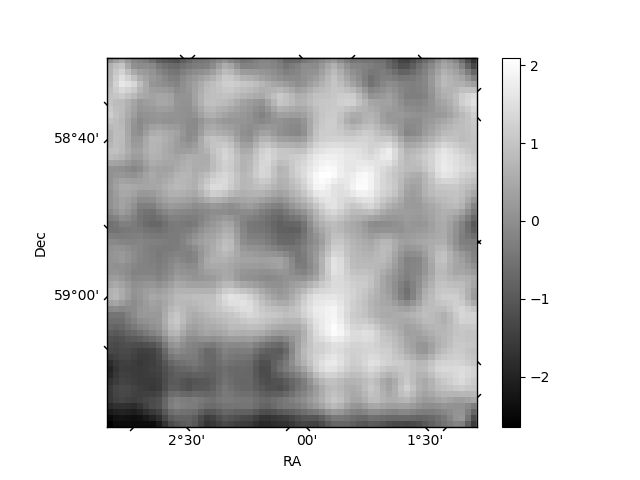
Histogram calculated using DETX and DETY for each event in the final _common_clean file
| Quadrant A | 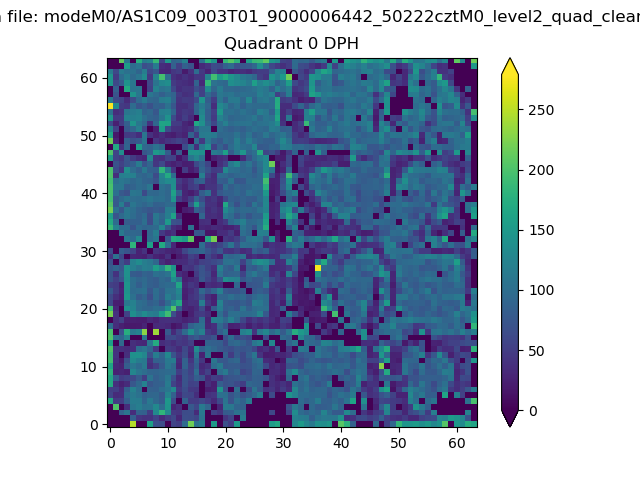 |
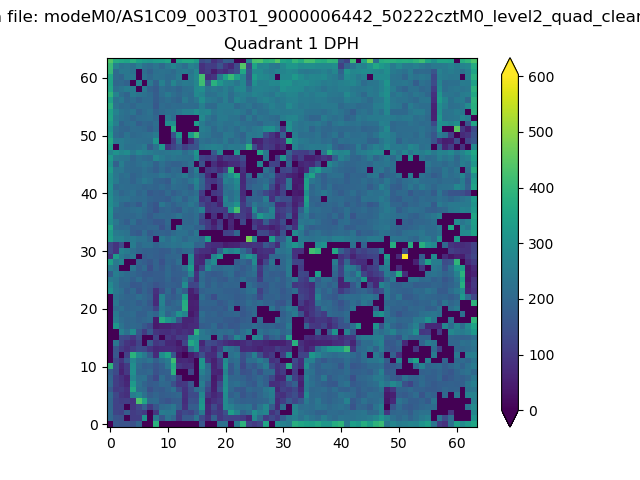 |
Quadrant B |
|---|---|---|---|
| Quadrant D | 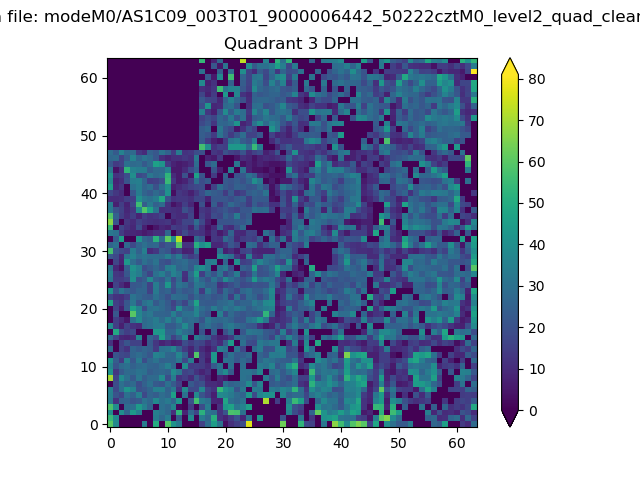 |
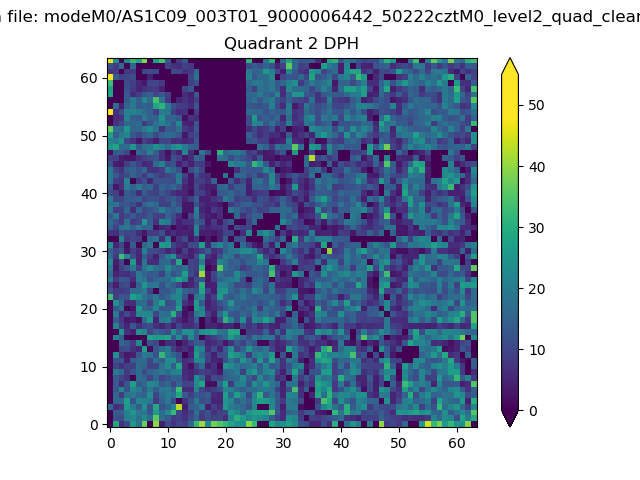 |
Quadrant C |
| Plot type | Count rate plots | Images |
|---|---|---|
| Comparison with Poisson distribution Blue bars denote a histogram of data divided into 1 sec bins. Red curve is a Poisson curve with rate = median count rate of data. |
 |
 |
| Quadrant-wise count rates Data is divided into 100 sec bins |
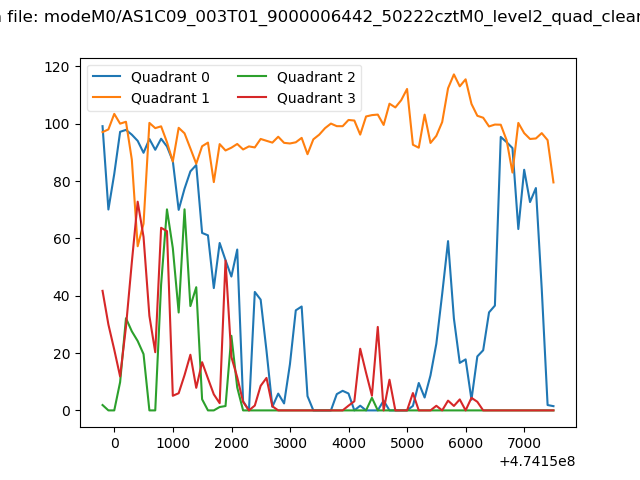 |
|
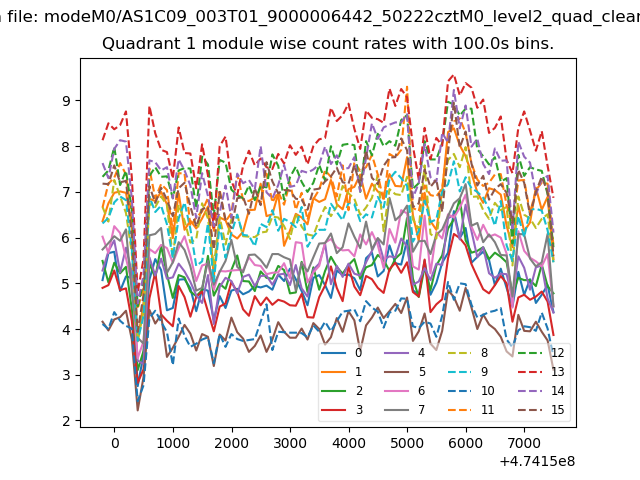
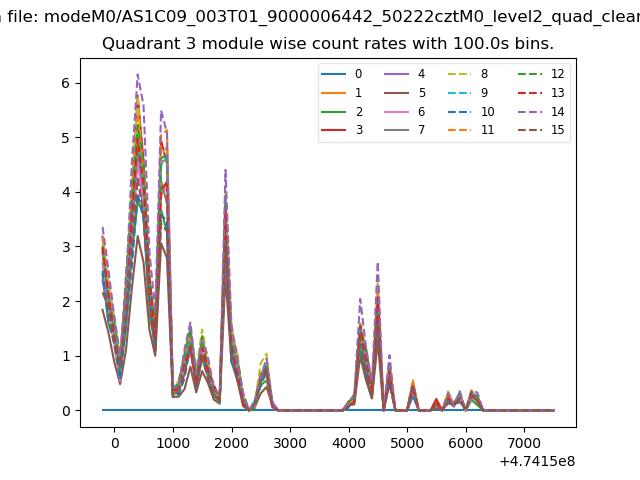
| Module-wise count rates for Quadrant A Data is divided into 100 sec bins |
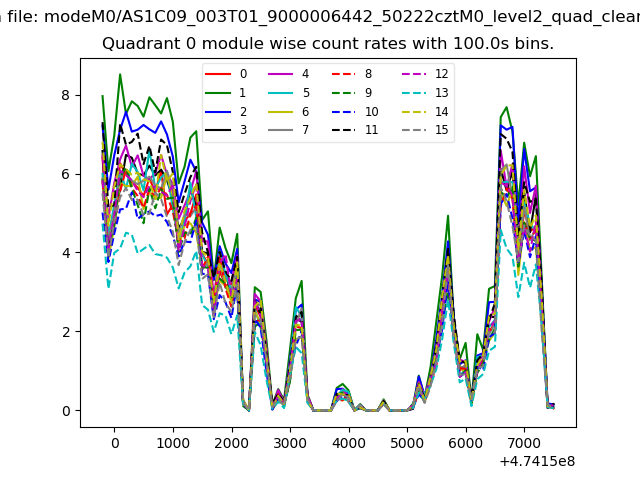 |
 |
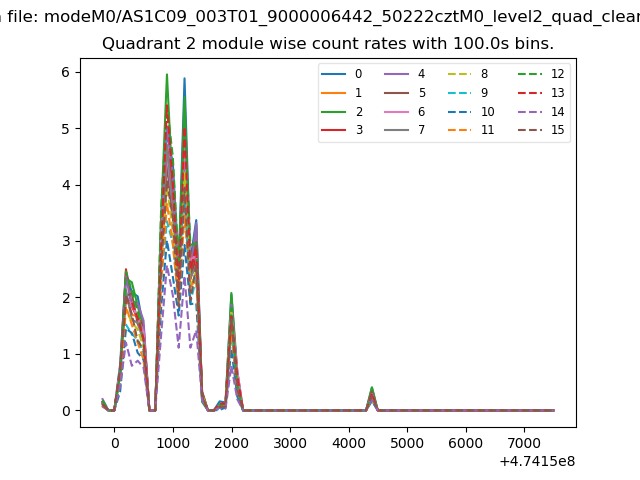
| Module-wise count rates for Quadrant B Data is divided into 100 sec bins |
 |
 |
| Module-wise count rates for Quadrant C Data is divided into 100 sec bins |
 |
 |
| Module-wise count rates for Quadrant D Data is divided into 100 sec bins |
 |
 |
| Parameter | Plot |
|---|---|
| CZT HV Monitor |  |
| D_VDD | 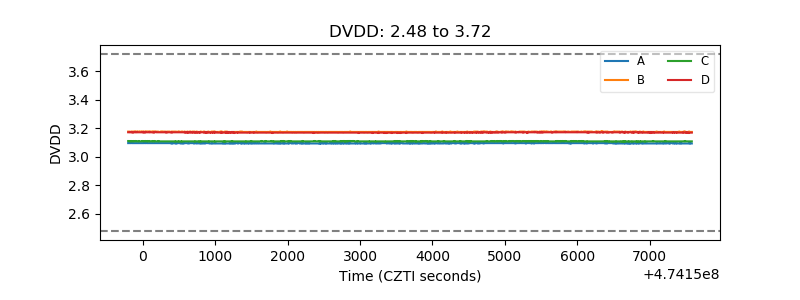 |
| Temperature 1 | 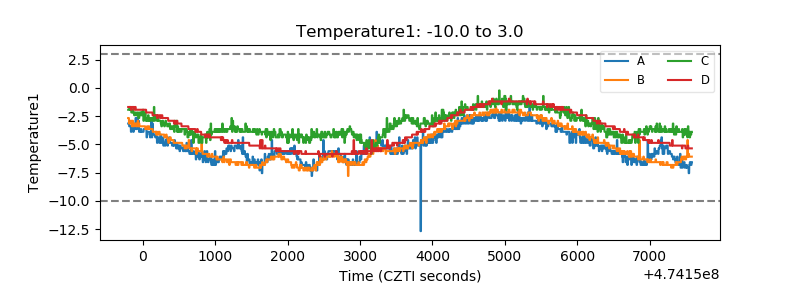 |
| Veto HV Monitor | 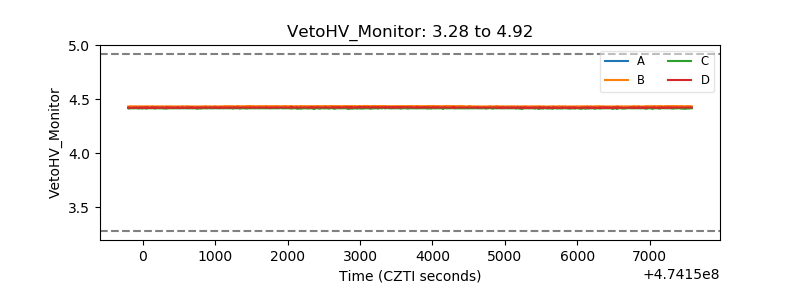 |
| Veto LLD | 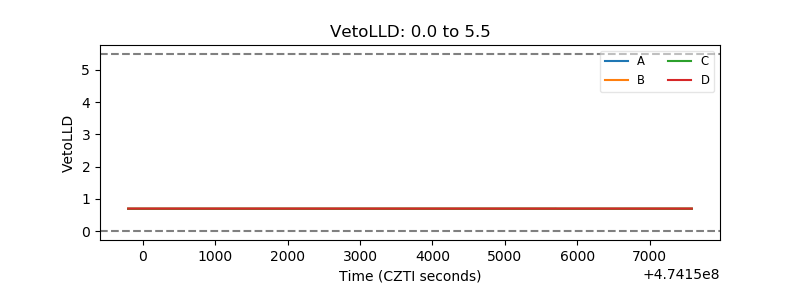 |
| Alpha Counter | 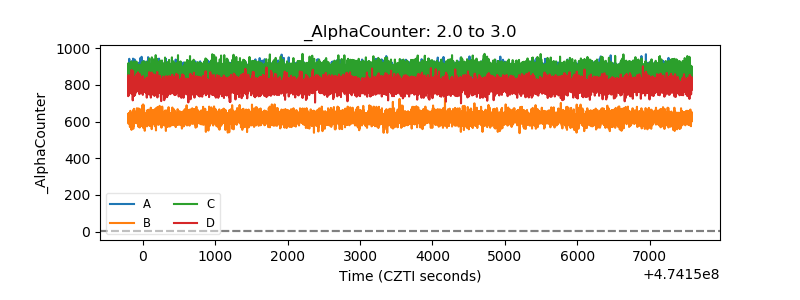 |
| _CPM_Rate | 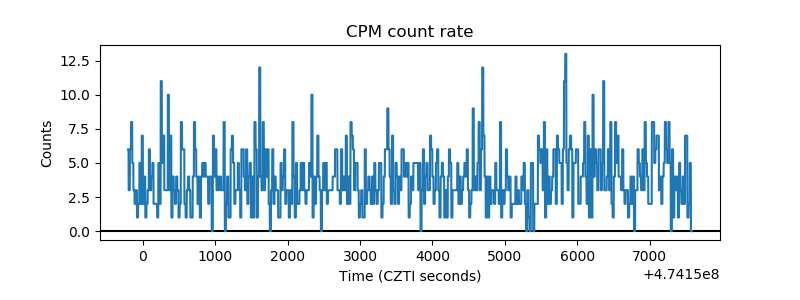 |
| CZT Counter | 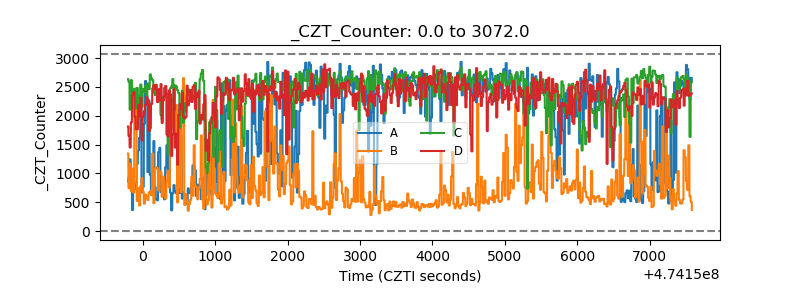 |
| +2.5 Volts monitor |  |
| +5 Volts monitor | 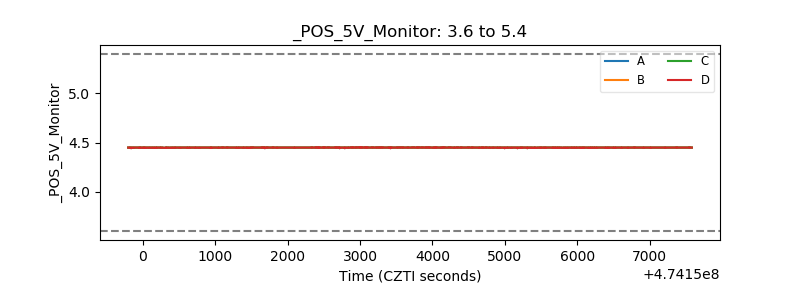 |
| _ROLL_ROT | 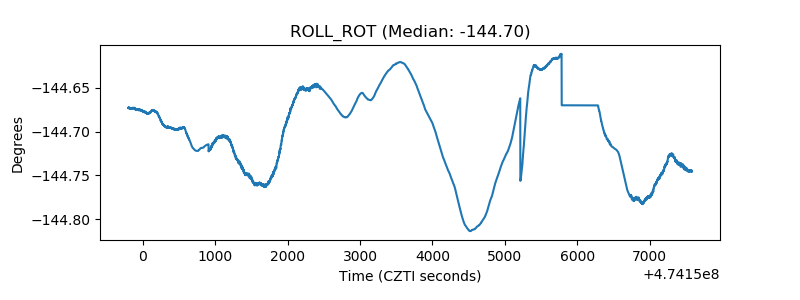 |
| _Roll_DEC | 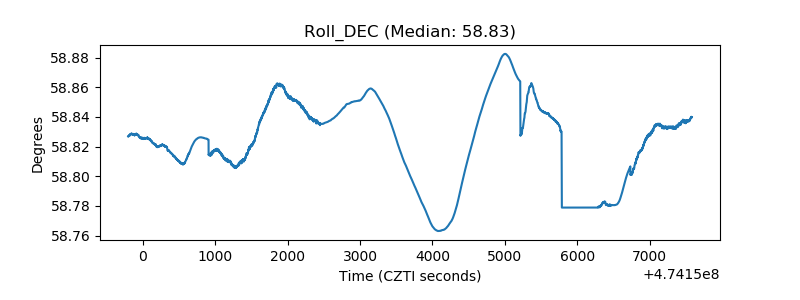 |
| _Roll_RA | 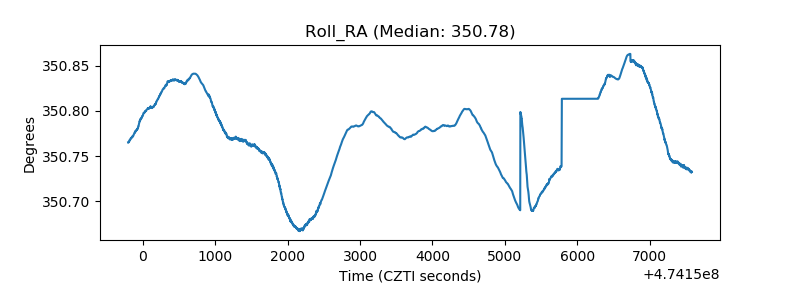 |
| Veto Counter | 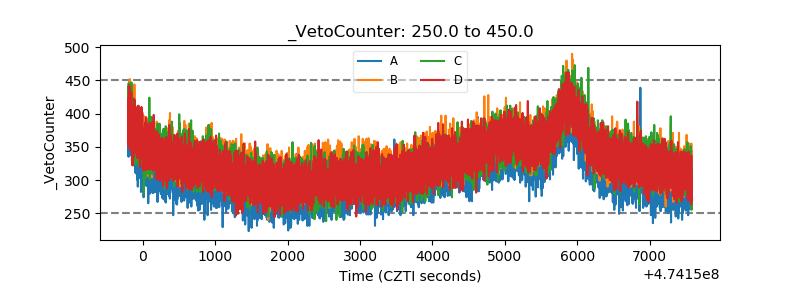 |