| Param | Original file | Final file |
|---|---|---|
| Filename | modeM0/AS1C09_003T01_9000006442_50223cztM0_level2.fits | modeM0/AS1C09_003T01_9000006442_50223cztM0_level2_quad_clean.evt |
| Size (bytes) | 1,594,598,400 | 66,392,640 |
| Size | 1.5 GB | 63.3 MB |
| Events in quadrant A | 16,639,483 | 503,859 |
| Events in quadrant B | 7,082,972 | 739,482 |
| Events in quadrant C | 17,078,389 | 84,956 |
| Events in quadrant D | 17,634,515 | 136,462 |
| Mode M0 | |||
|---|---|---|---|
| Quadrant | BADHDUFLAG | Total packets | Discarded packets |
| A | 0 | 54684 | 0 |
| B | 0 | 26397 | 0 |
| C | 0 | 56081 | 0 |
| D | 0 | 57561 | 0 |
| Mode SS | |||
|---|---|---|---|
| Quadrant | BADHDUFLAG | Total packets | Discarded packets |
| A | 0 | 154 | 0 |
| B | 0 | 154 | 0 |
| C | 0 | 154 | 0 |
| D | 0 | 154 | 0 |
| Quadrant | Total seconds | Saturated seconds | Saturation percentage |
|---|---|---|---|
| A | 7689 | 5707 | 74.222916% |
| B | 7689 | 854 | 11.106776% |
| C | 7689 | 7689 | 100.000000% |
| D | 7688 | 7685 | 99.960978% |
Noise dominated data is calculated using 1-second bins in cleaned event files. If a bin has >2000 counts, and if more than 50% of those come from <1% of pixels, then it is considered to be noise-dominated and hence unusable.
| Quadrant | # 1 sec bins | Bins with >0 counts | Bins with >2000 counts | High rate bins dominated by noise | Noise dominated (total time) | Noise dominated (detector-on time) | Marked lightcurve |
|---|---|---|---|---|---|---|---|
| A | 7688 | 7688 | 5612 | 5612 | 73.00% | 73.00% | 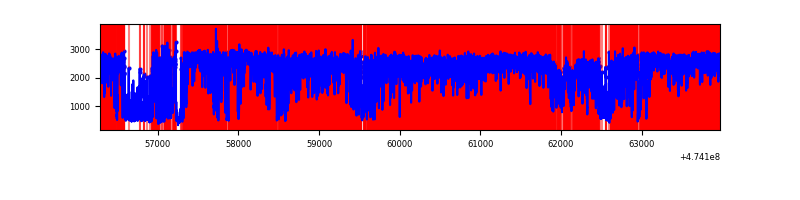 |
| B | 7688 | 7688 | 660 | 660 | 8.58% | 8.58% | 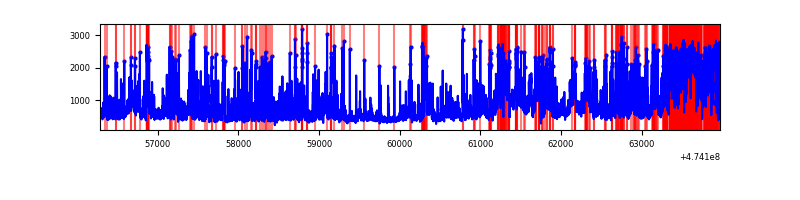 |
| C | 7688 | 7688 | 5751 | 5751 | 74.80% | 74.80% | 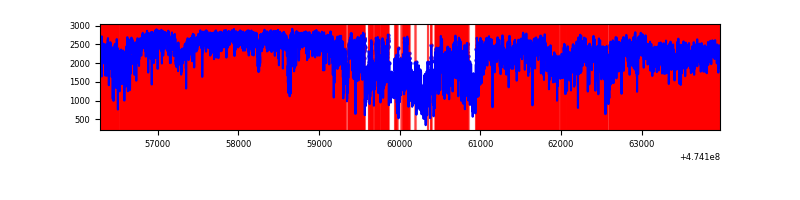 |
| D | 7687 | 7687 | 6645 | 6645 | 86.44% | 86.44% | 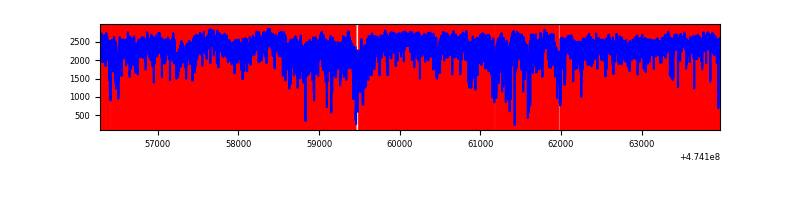 |
Top three noisy pixels from each quadrant. If the there are fewer than three noisy pixels in the level2.evt file, extra rows are filled as -1
| Pixel properties | Quadrant properties | ||||||
|---|---|---|---|---|---|---|---|
| Quadrant | DetID | PixID | Counts | Sigma | Mean | Median | Sigma |
| A | 0 | 98 | 12656770 | 89855.92 | 566 | 552 | 140.9 |
| A | 12 | 250 | 342861 | 2430.31 | 566 | 552 | 140.9 |
| A | 4 | 156 | 241969 | 1714.0 | 566 | 552 | 140.9 |
| B | 4 | 206 | 2136472 | 12923.64 | 772 | 745 | 165.3 |
| B | 5 | 185 | 825588 | 4991.26 | 772 | 745 | 165.3 |
| B | 9 | 218 | 221335 | 1334.83 | 772 | 745 | 165.3 |
| C | 15 | 197 | 10365974 | 231761.32 | 112 | 109 | 44.7 |
| C | 15 | 214 | 2138509 | 47810.62 | 112 | 109 | 44.7 |
| C | 4 | 111 | 1195388 | 26724.2 | 112 | 109 | 44.7 |
| D | 7 | 61 | 10881496 | 168855.7 | 184 | 175 | 64.4 |
| D | 15 | 108 | 1283347 | 19912.19 | 184 | 175 | 64.4 |
| D | 7 | 43 | 1139906 | 17686.28 | 184 | 175 | 64.4 |
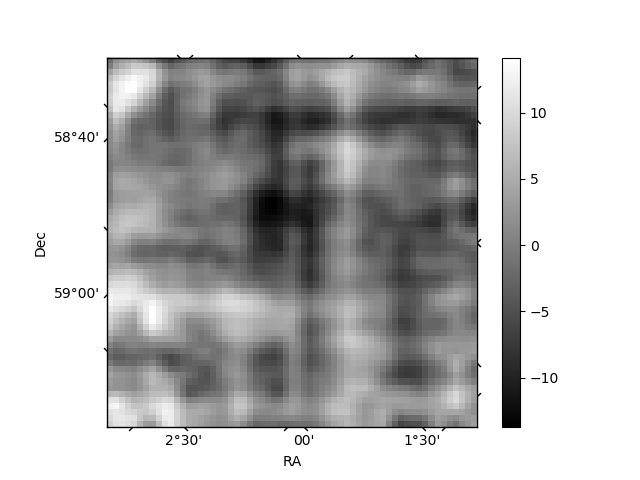
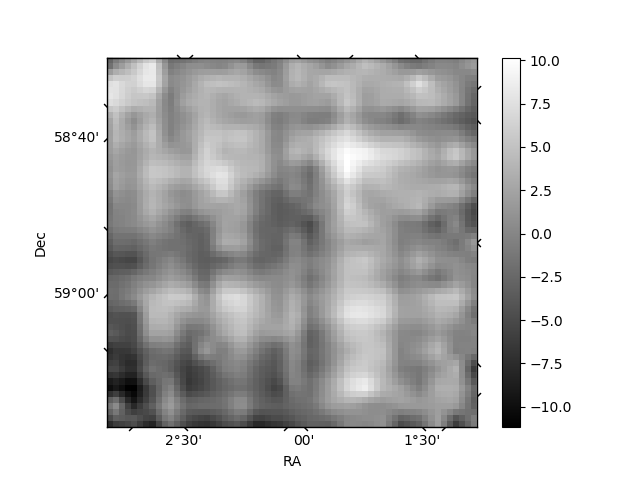
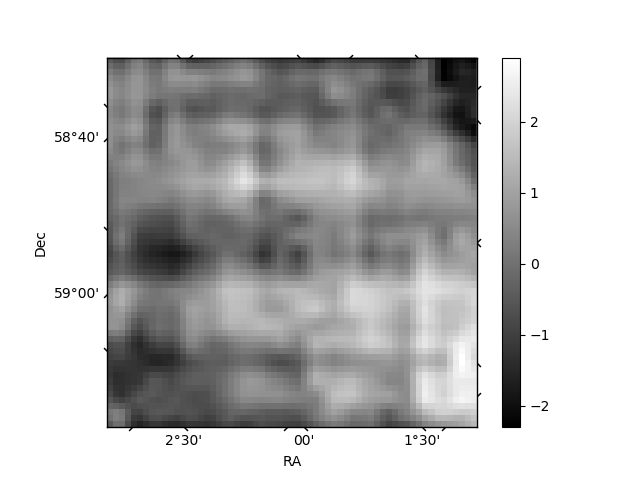
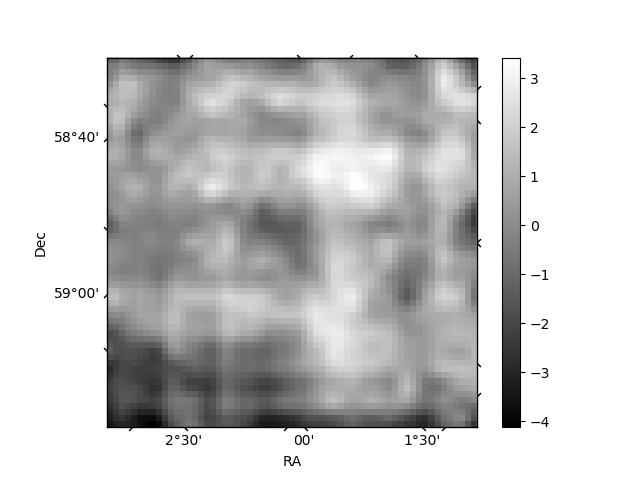
Histogram calculated using DETX and DETY for each event in the final _common_clean file
| Quadrant A | 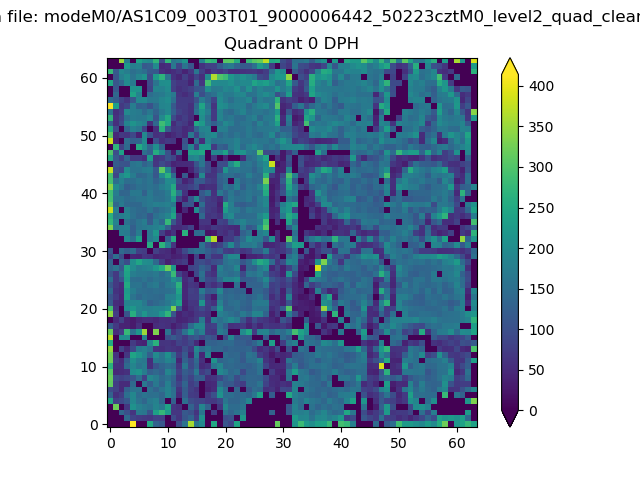 |
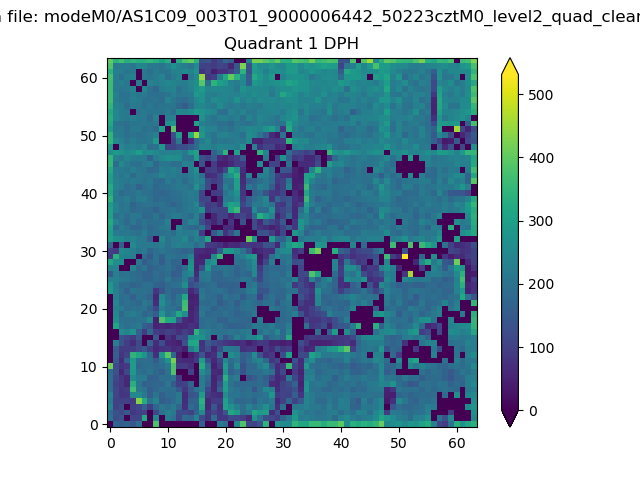 |
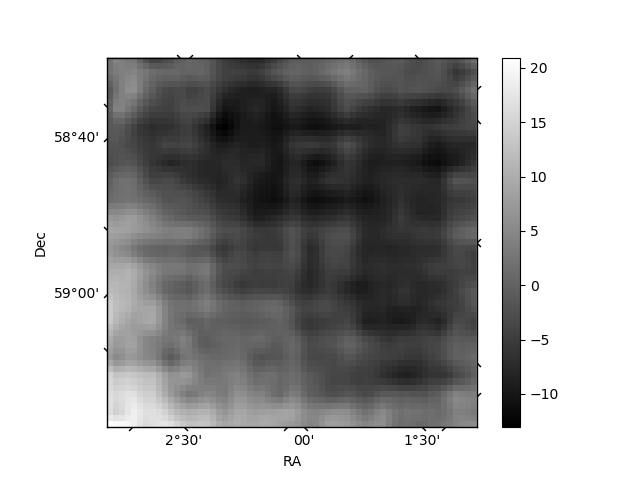
Quadrant B |
|---|---|---|---|
| Quadrant D | 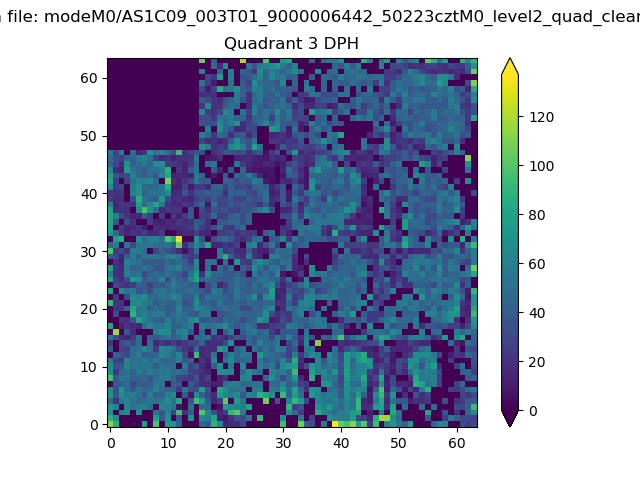 |
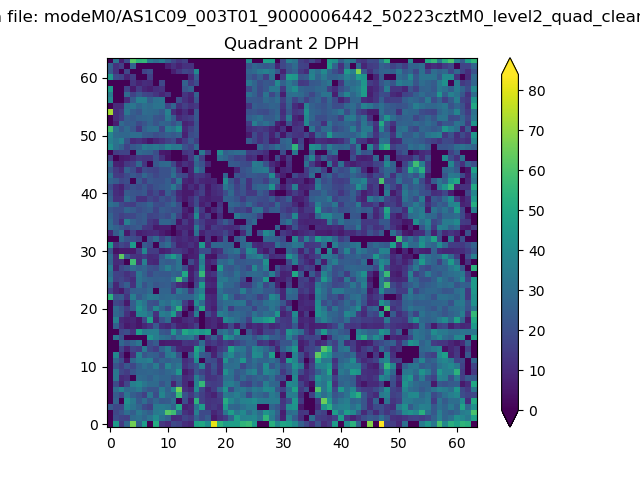 |
Quadrant C |
| Plot type | Count rate plots | Images |
|---|---|---|
| Comparison with Poisson distribution Blue bars denote a histogram of data divided into 1 sec bins. Red curve is a Poisson curve with rate = median count rate of data. |
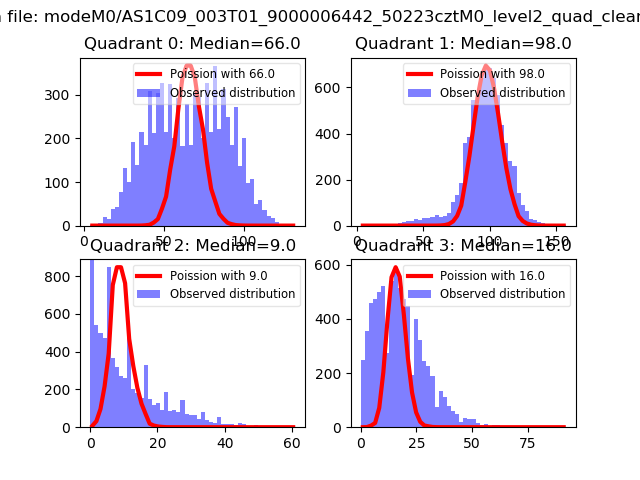 |
 |
| Quadrant-wise count rates Data is divided into 100 sec bins |
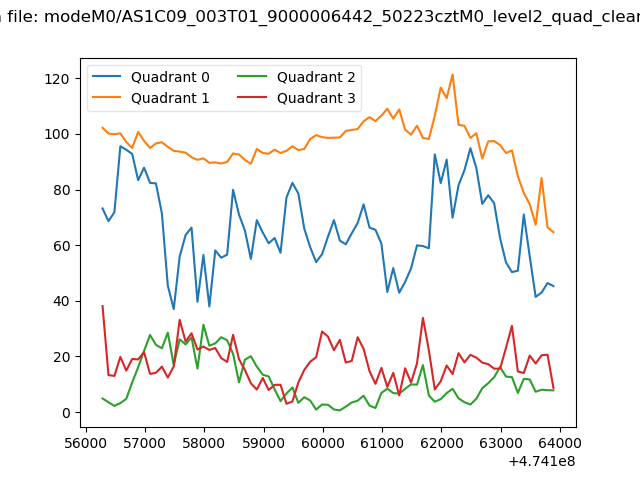 |
|
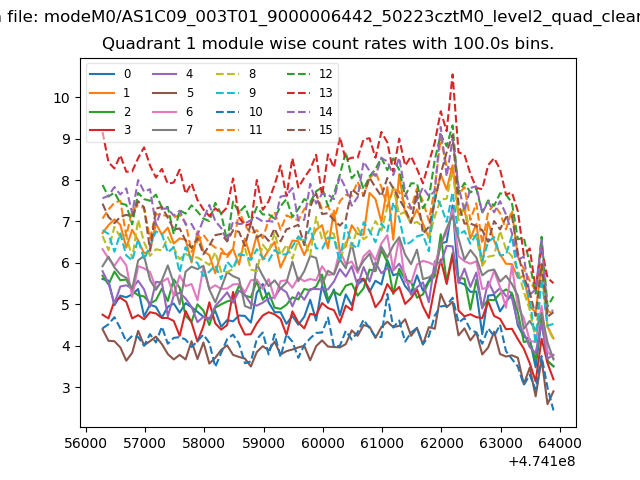
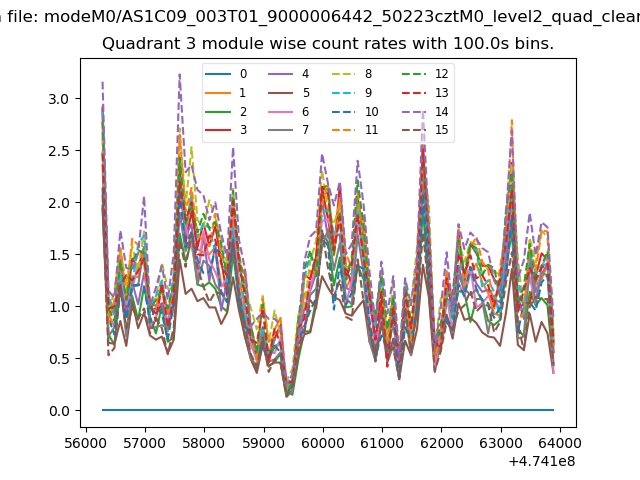
| Module-wise count rates for Quadrant A Data is divided into 100 sec bins |
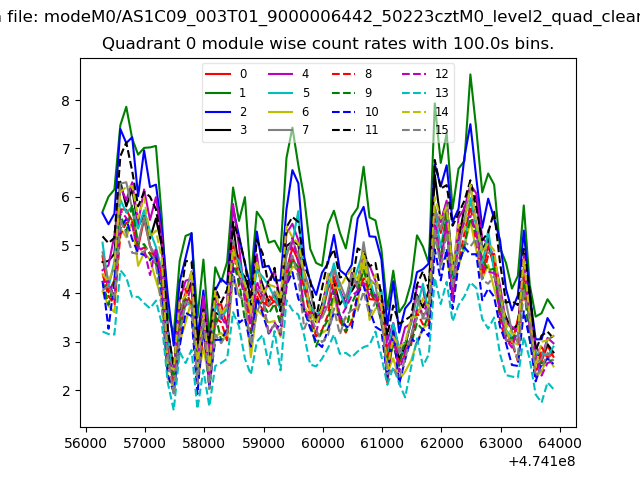 |
 |
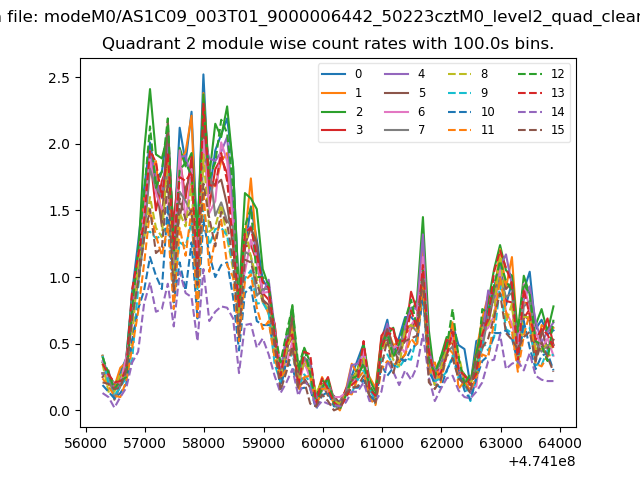
| Module-wise count rates for Quadrant B Data is divided into 100 sec bins |
 |
 |
| Module-wise count rates for Quadrant C Data is divided into 100 sec bins |
 |
 |
| Module-wise count rates for Quadrant D Data is divided into 100 sec bins |
 |
 |
| Parameter | Plot |
|---|---|
| CZT HV Monitor | 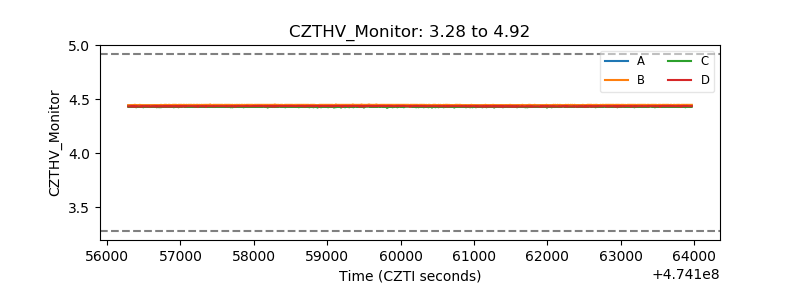 |
| D_VDD | 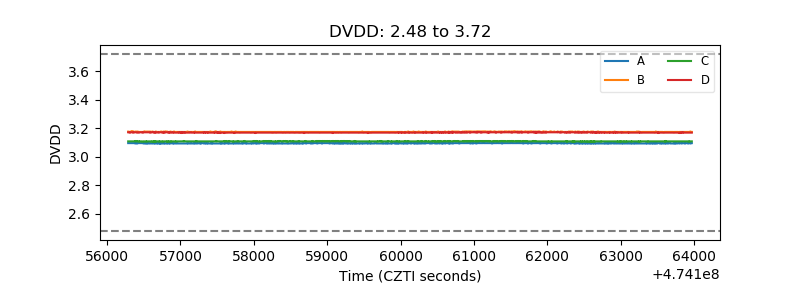 |
| Temperature 1 | 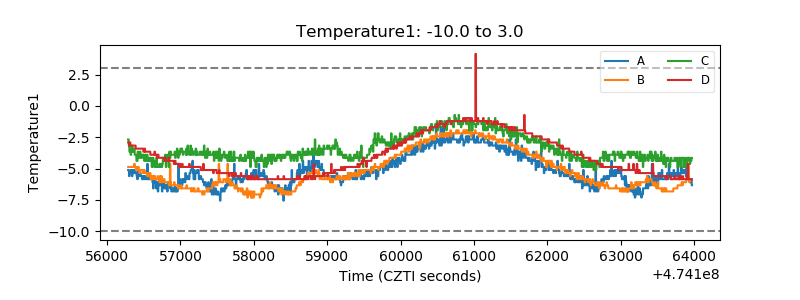 |
| Veto HV Monitor | 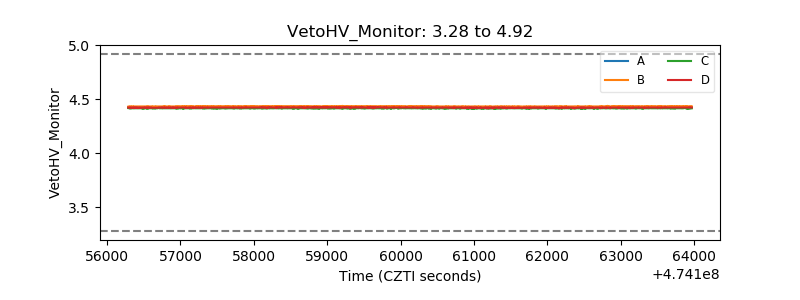 |
| Veto LLD | 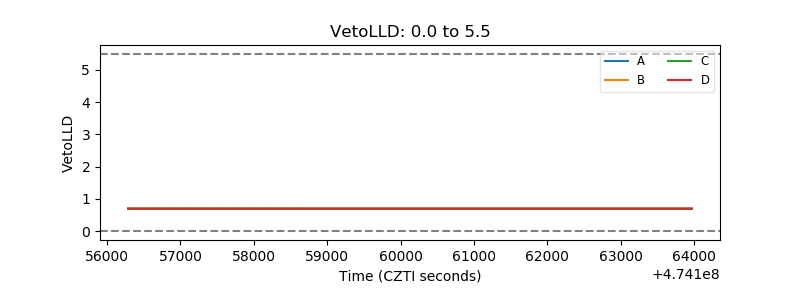 |
| Alpha Counter | 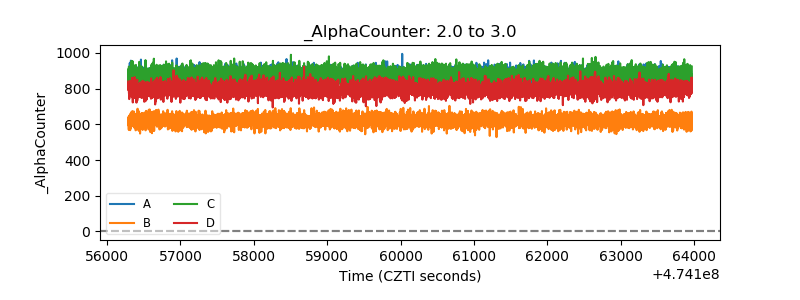 |
| _CPM_Rate | 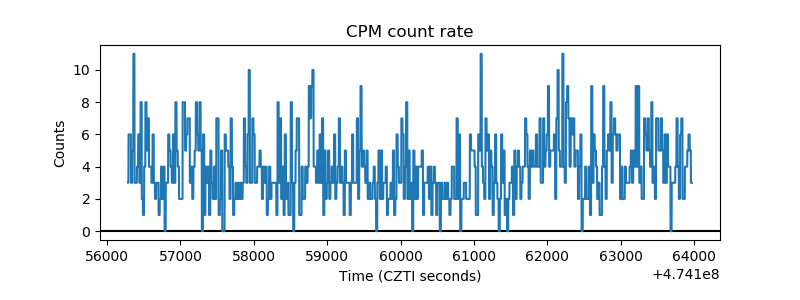 |
| CZT Counter | 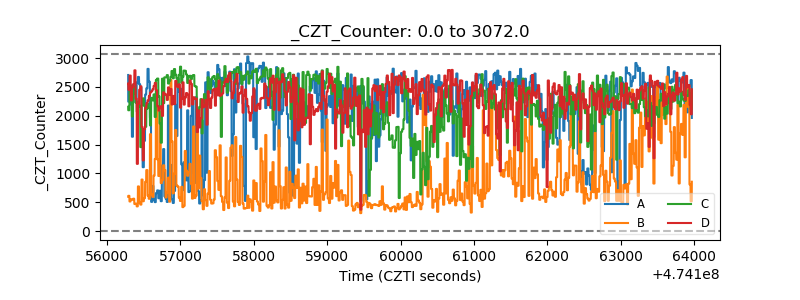 |
| +2.5 Volts monitor | 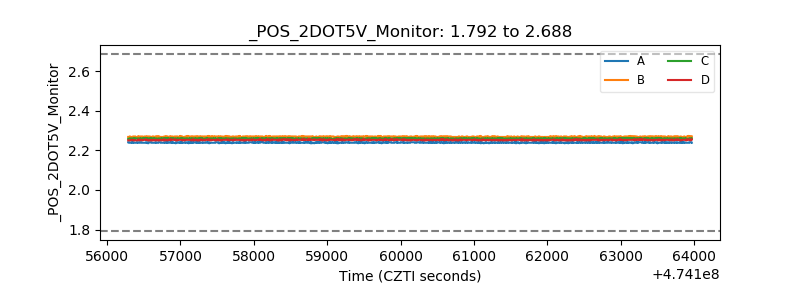 |
| +5 Volts monitor |  |
| _ROLL_ROT | 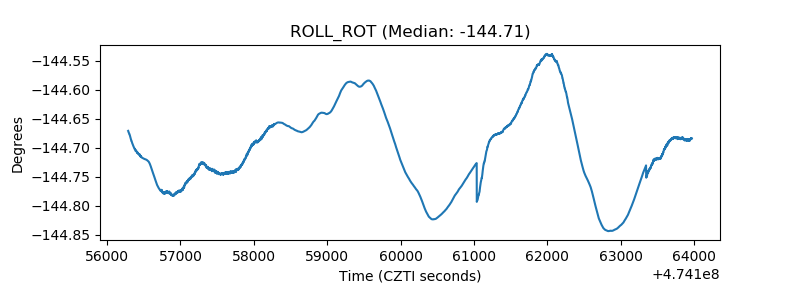 |
| _Roll_DEC | 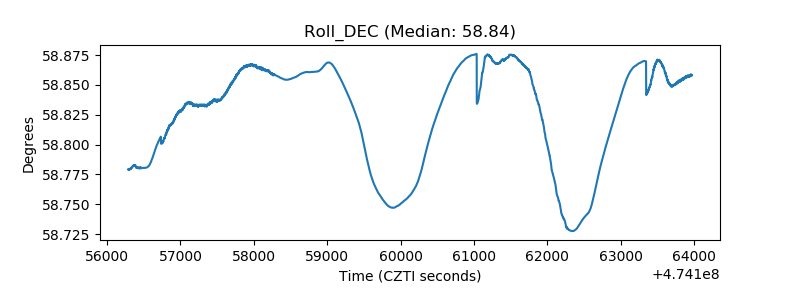 |
| _Roll_RA | 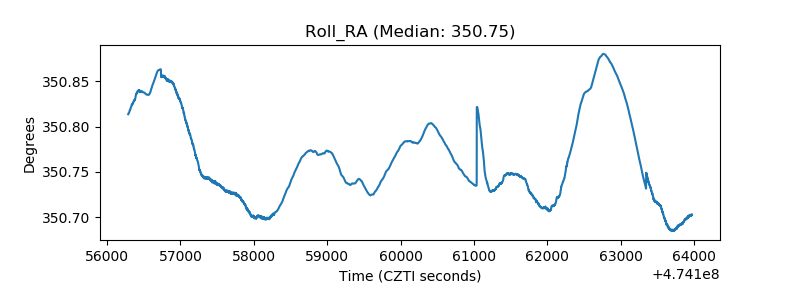 |
| Veto Counter | 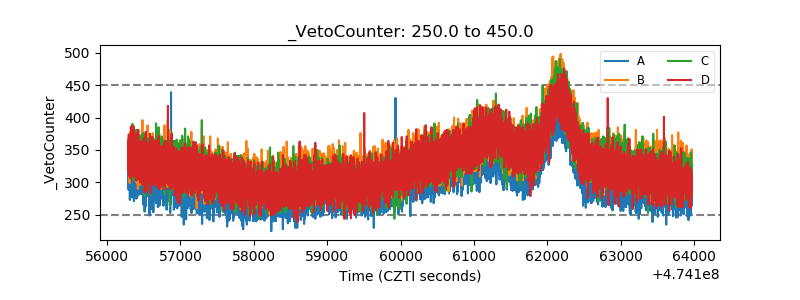 |