| Param | Original file | Final file |
|---|---|---|
| Filename | modeM0/AS1C09_003T01_9000006442_50226cztM0_level2.fits | modeM0/AS1C09_003T01_9000006442_50226cztM0_level2_quad_clean.evt |
| Size (bytes) | 3,508,966,080 | 144,829,440 |
| Size | 3.3 GB | 138.1 MB |
| Events in quadrant A | 27,891,909 | 1,125,647 |
| Events in quadrant B | 14,934,348 | 1,624,353 |
| Events in quadrant C | 42,887,579 | 175,333 |
| Events in quadrant D | 42,738,421 | 165,625 |
| Mode M9 | |||
|---|---|---|---|
| Quadrant | BADHDUFLAG | Total packets | Discarded packets |
| A | 0 | 11 | 0 |
| B | 0 | 11 | 0 |
| C | 0 | 11 | 0 |
| D | 0 | 11 | 0 |
| Mode M0 | |||
|---|---|---|---|
| Quadrant | BADHDUFLAG | Total packets | Discarded packets |
| A | 0 | 96359 | 3 |
| B | 0 | 57505 | 3 |
| C | 0 | 140113 | 3 |
| D | 0 | 139782 | 3 |
| Mode SS | |||
|---|---|---|---|
| Quadrant | BADHDUFLAG | Total packets | Discarded packets |
| A | 0 | 380 | 0 |
| B | 0 | 380 | 0 |
| C | 0 | 380 | 0 |
| D | 0 | 380 | 0 |
| Quadrant | Total seconds | Saturated seconds | Saturation percentage |
|---|---|---|---|
| A | 18753 | 6476 | 34.533141% |
| B | 18754 | 2209 | 11.778821% |
| C | 18754 | 17085 | 91.100565% |
| D | 18754 | 16886 | 90.039458% |
Noise dominated data is calculated using 1-second bins in cleaned event files. If a bin has >2000 counts, and if more than 50% of those come from <1% of pixels, then it is considered to be noise-dominated and hence unusable.
| Quadrant | # 1 sec bins | Bins with >0 counts | Bins with >2000 counts | High rate bins dominated by noise | Noise dominated (total time) | Noise dominated (detector-on time) | Marked lightcurve |
|---|---|---|---|---|---|---|---|
| A | 19883 | 18753 | 6198 | 6198 | 31.17% | 33.05% | 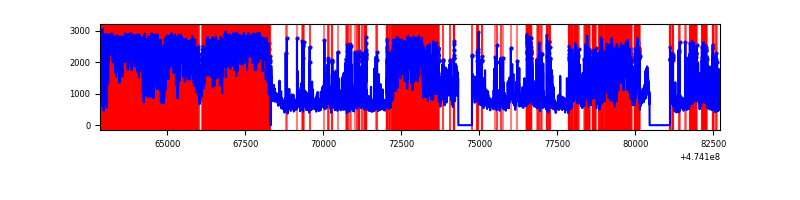 |
| B | 19884 | 18755 | 1586 | 1586 | 7.98% | 8.46% | 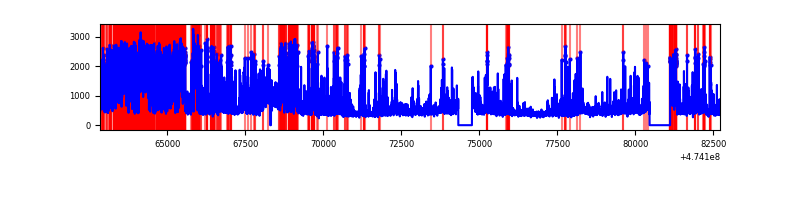 |
| C | 19884 | 18754 | 15204 | 15204 | 76.46% | 81.07% | 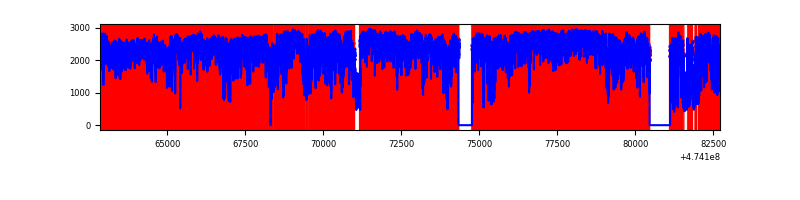 |
| D | 19884 | 18754 | 15082 | 15082 | 75.85% | 80.42% | 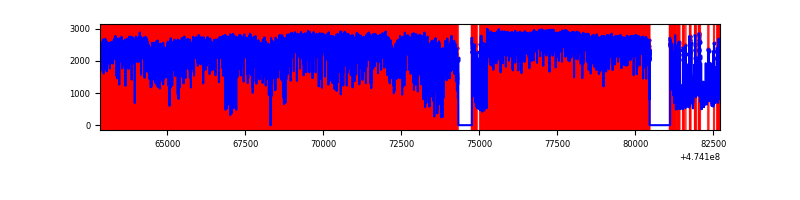 |
Top three noisy pixels from each quadrant. If the there are fewer than three noisy pixels in the level2.evt file, extra rows are filled as -1
| Pixel properties | Quadrant properties | ||||||
|---|---|---|---|---|---|---|---|
| Quadrant | DetID | PixID | Counts | Sigma | Mean | Median | Sigma |
| A | 0 | 98 | 13579905 | 31714.67 | 1739 | 1694 | 428.1 |
| A | 3 | 14 | 2635864 | 6152.64 | 1739 | 1694 | 428.1 |
| A | 8 | 8 | 645266 | 1503.19 | 1739 | 1694 | 428.1 |
| B | 5 | 185 | 2857571 | 7088.38 | 1904 | 1835 | 402.9 |
| B | 4 | 206 | 1187920 | 2944.05 | 1904 | 1835 | 402.9 |
| B | 3 | 249 | 987981 | 2447.77 | 1904 | 1835 | 402.9 |
| C | 15 | 197 | 21817430 | 103557.1 | 690 | 682 | 210.7 |
| C | 4 | 111 | 9792487 | 46478.56 | 690 | 682 | 210.7 |
| C | 15 | 127 | 3164554 | 15017.88 | 690 | 682 | 210.7 |
| D | 7 | 61 | 17605284 | 59408.85 | 759 | 717 | 296.3 |
| D | 15 | 170 | 3836601 | 12944.68 | 759 | 717 | 296.3 |
| D | 15 | 108 | 3367274 | 11360.88 | 759 | 717 | 296.3 |
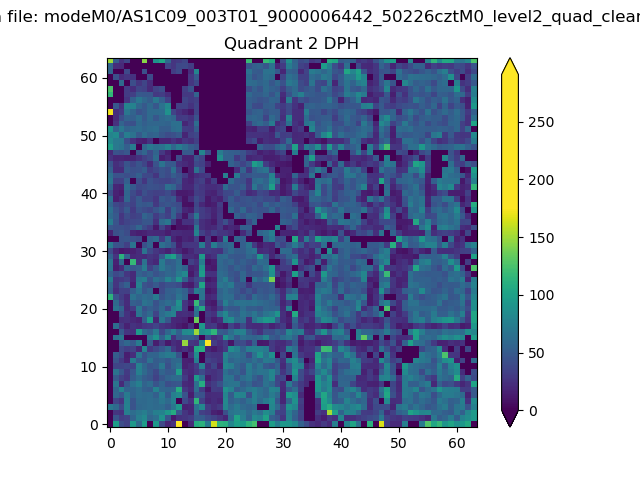
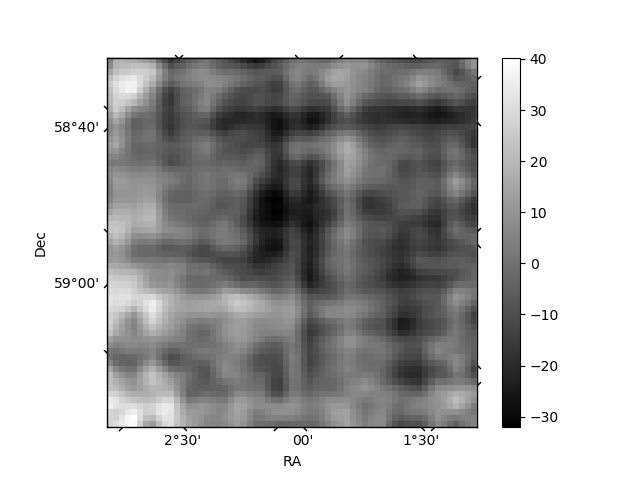
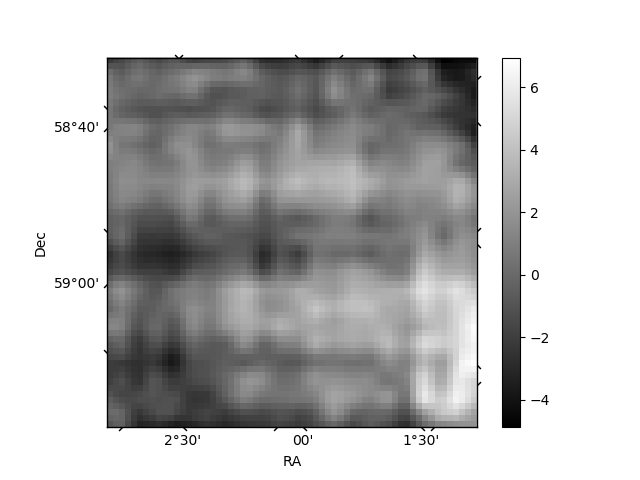
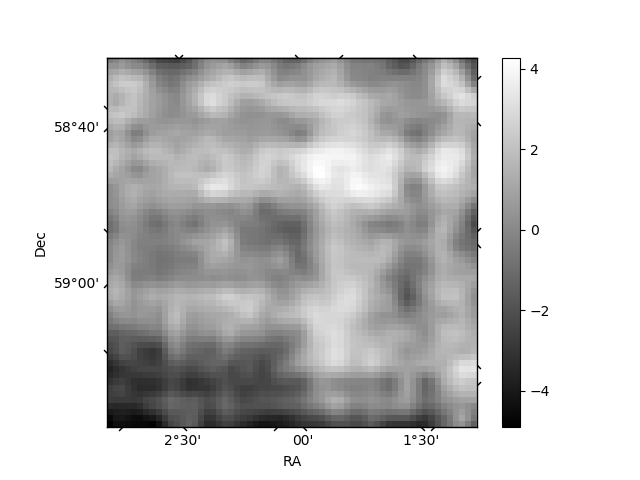
Histogram calculated using DETX and DETY for each event in the final _common_clean file
| Quadrant A | 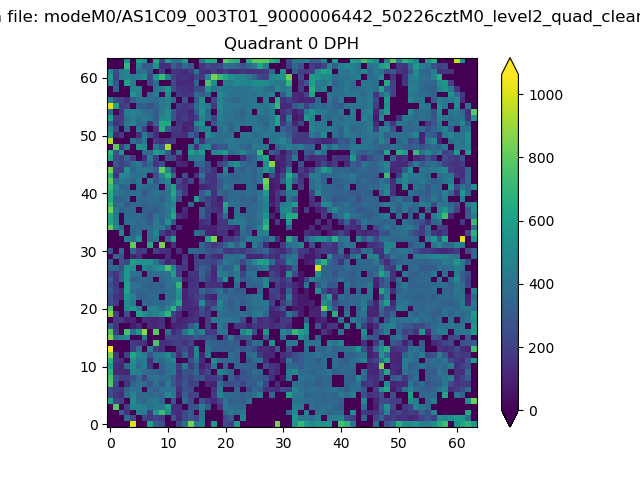 |
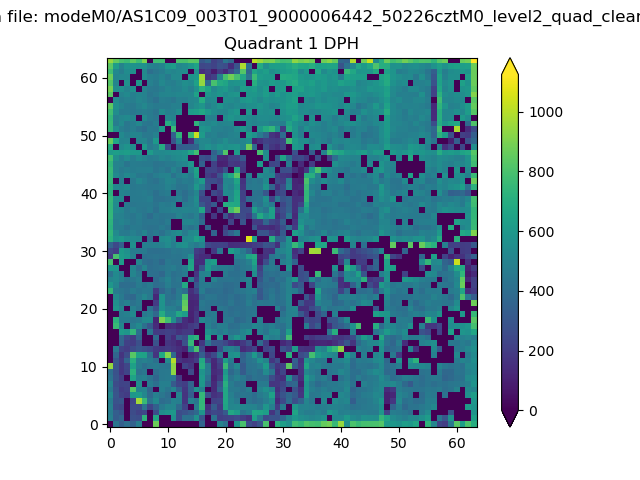 |
Quadrant B |
|---|---|---|---|
| Quadrant D | 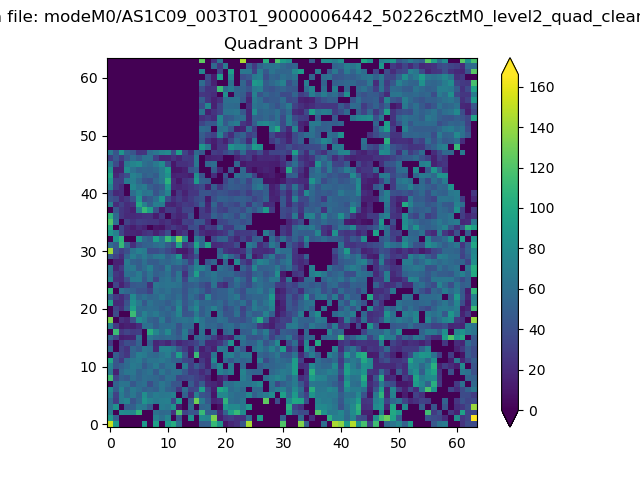 |
 |
Quadrant C |
| Plot type | Count rate plots | Images |
|---|---|---|
| Comparison with Poisson distribution Blue bars denote a histogram of data divided into 1 sec bins. Red curve is a Poisson curve with rate = median count rate of data. |
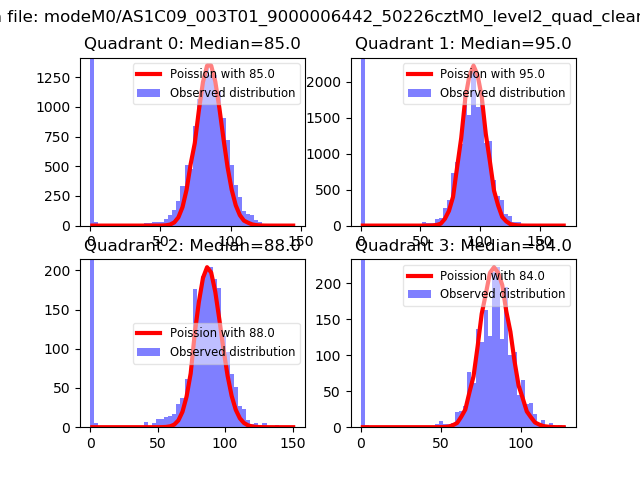 |
 |
| Quadrant-wise count rates Data is divided into 100 sec bins |
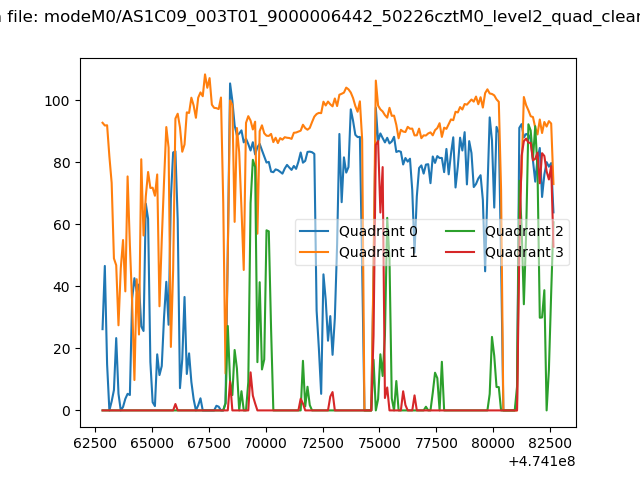 |
|
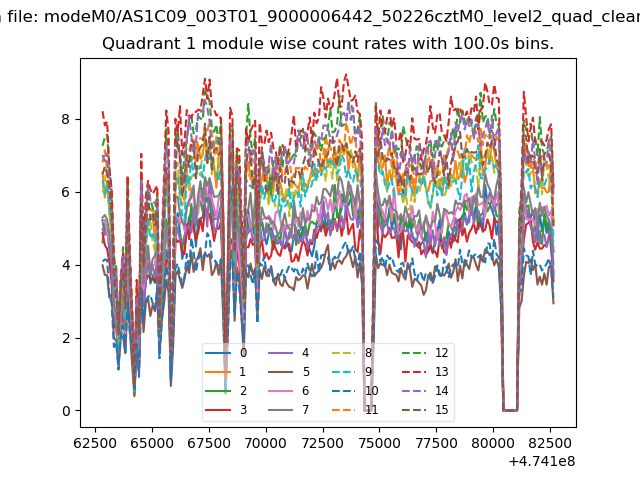
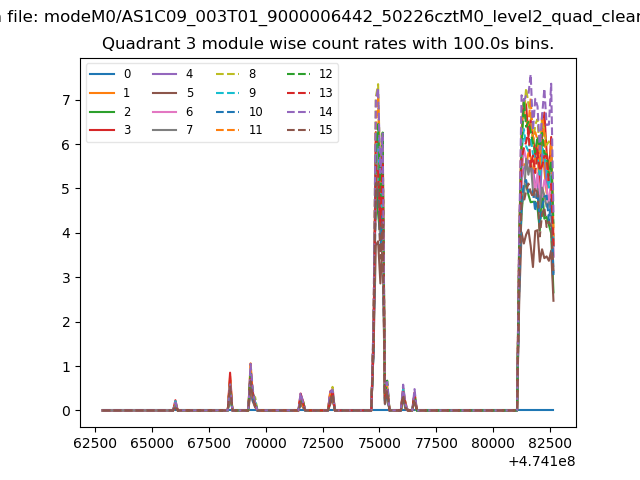
| Module-wise count rates for Quadrant A Data is divided into 100 sec bins |
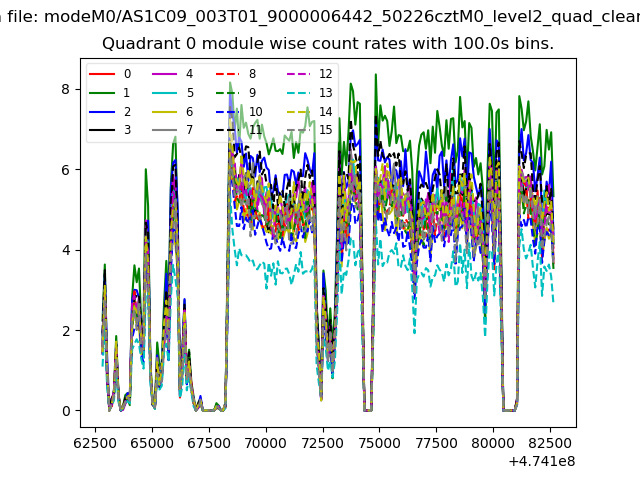 |
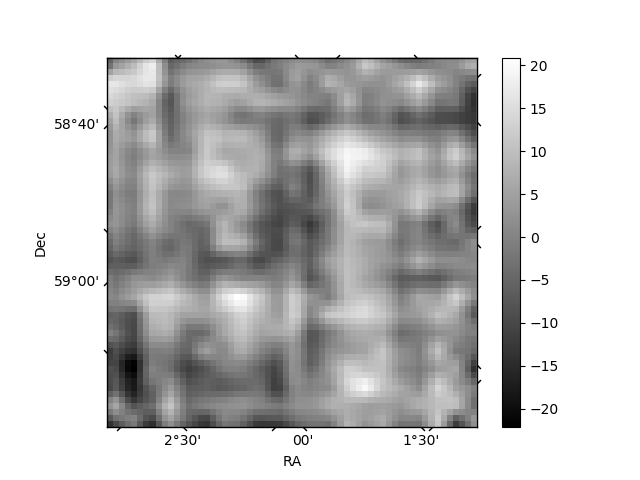 |
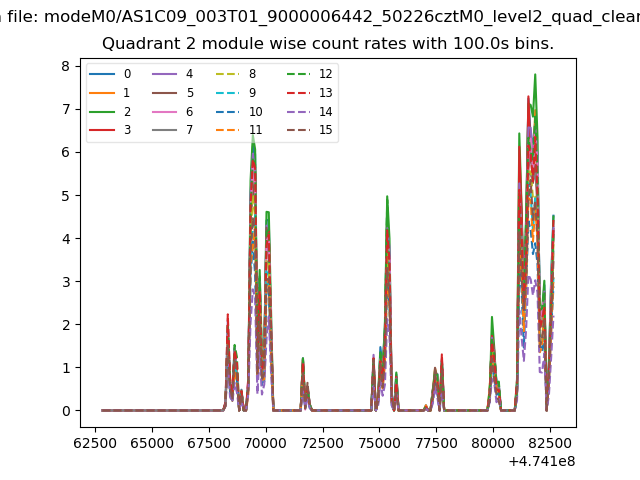
| Module-wise count rates for Quadrant B Data is divided into 100 sec bins |
 |
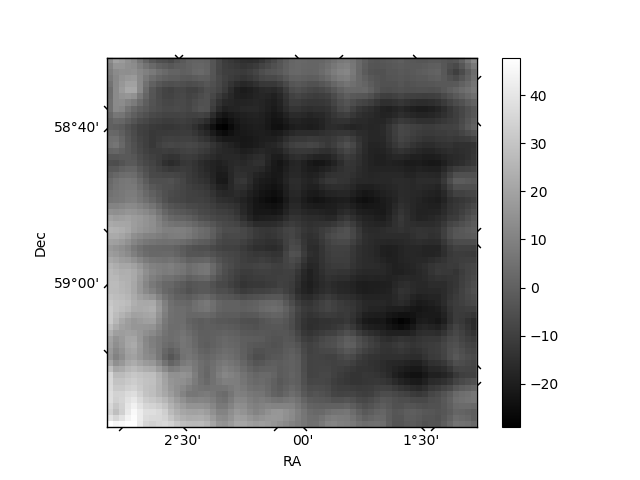 |
| Module-wise count rates for Quadrant C Data is divided into 100 sec bins |
 |
 |
| Module-wise count rates for Quadrant D Data is divided into 100 sec bins |
 |
 |
| Parameter | Plot |
|---|---|
| CZT HV Monitor | 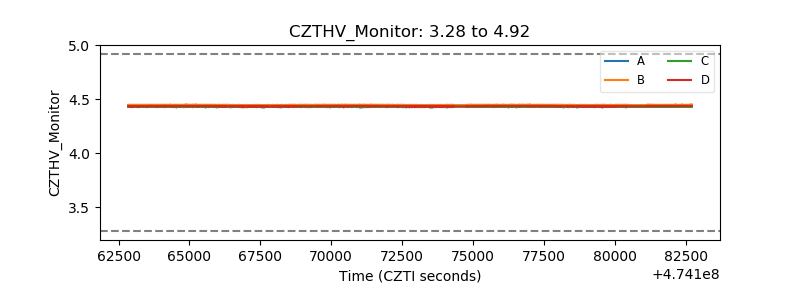 |
| D_VDD | 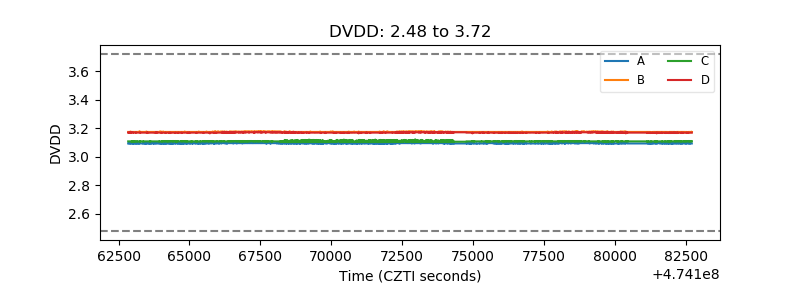 |
| Temperature 1 | 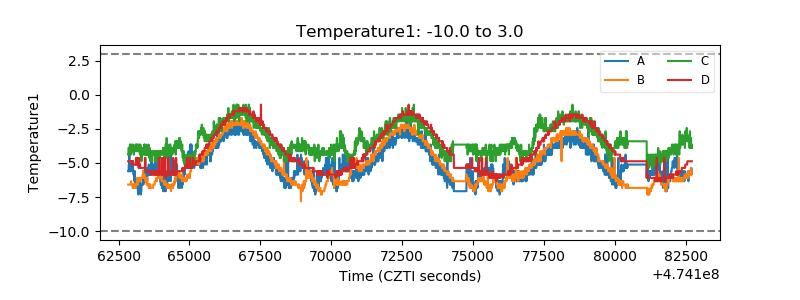 |
| Veto HV Monitor | 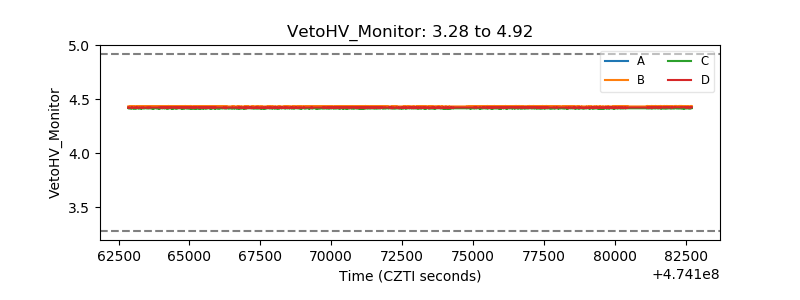 |
| Veto LLD | 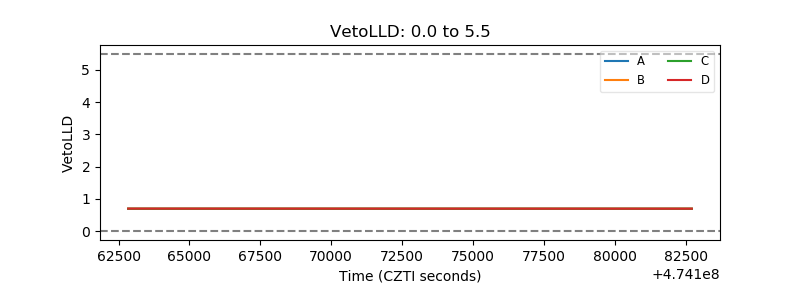 |
| Alpha Counter | 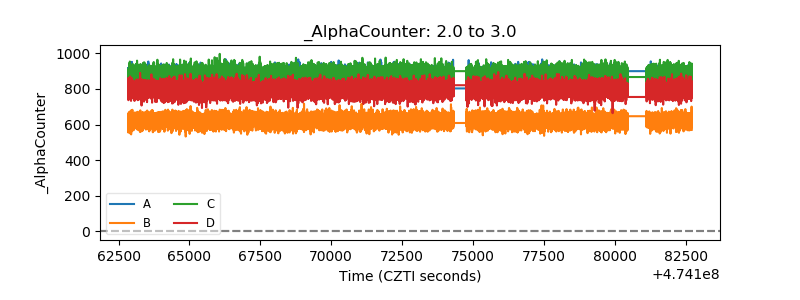 |
| _CPM_Rate | 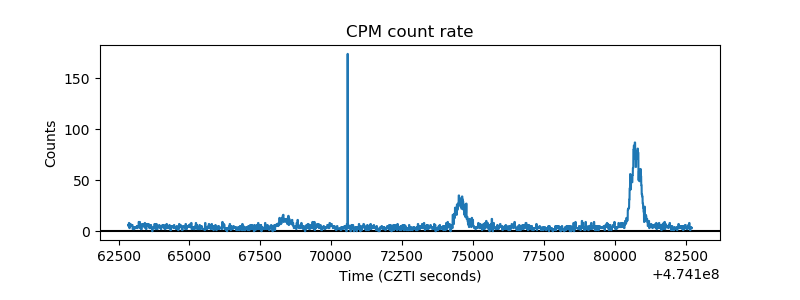 |
| CZT Counter | 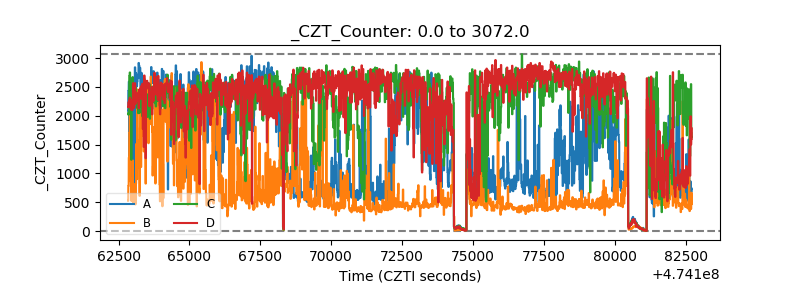 |
| +2.5 Volts monitor | 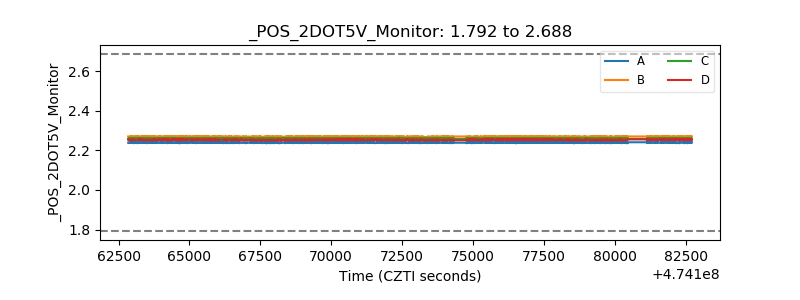 |
| +5 Volts monitor |  |
| _ROLL_ROT | 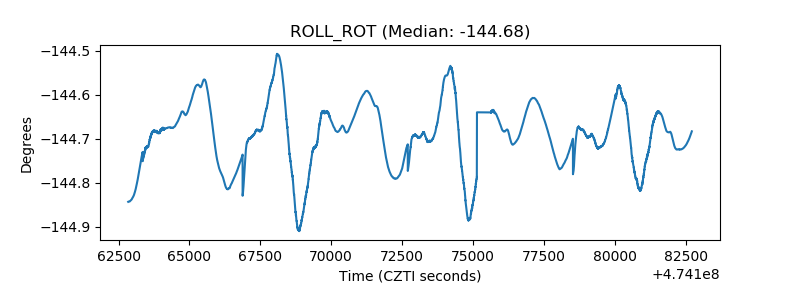 |
| _Roll_DEC | 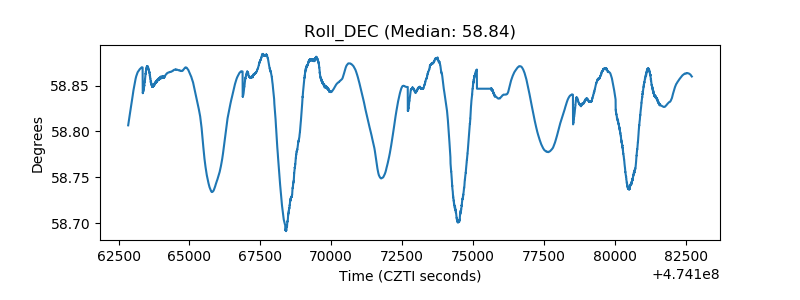 |
| _Roll_RA | 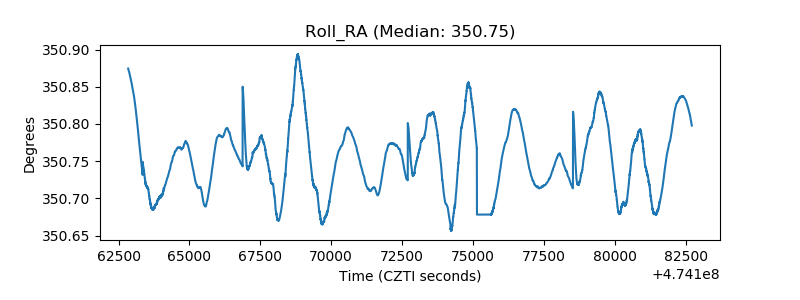 |
| Veto Counter | 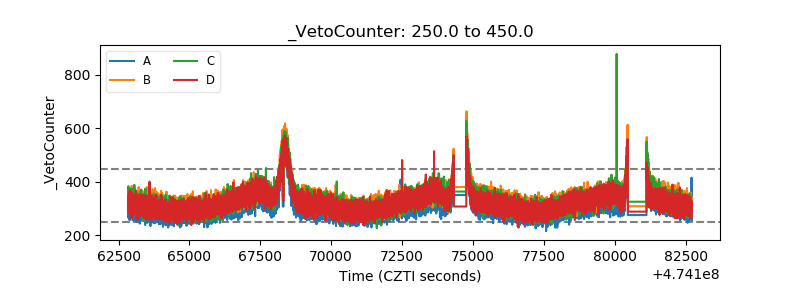 |