| Param | Original file | Final file |
|---|---|---|
| Filename | modeM0/AS1C09_003T01_9000006442_50227cztM0_level2.fits | modeM0/AS1C09_003T01_9000006442_50227cztM0_level2_quad_clean.evt |
| Size (bytes) | 892,572,480 | 65,759,040 |
| Size | 851.2 MB | 62.7 MB |
| Events in quadrant A | 5,003,359 | 520,482 |
| Events in quadrant B | 3,418,926 | 600,508 |
| Events in quadrant C | 13,395,168 | 174,226 |
| Events in quadrant D | 10,755,017 | 272,656 |
| Mode M9 | |||
|---|---|---|---|
| Quadrant | BADHDUFLAG | Total packets | Discarded packets |
| A | 0 | 8 | 0 |
| B | 0 | 8 | 0 |
| C | 0 | 8 | 0 |
| D | 0 | 8 | 0 |
| Mode M0 | |||
|---|---|---|---|
| Quadrant | BADHDUFLAG | Total packets | Discarded packets |
| A | 0 | 18946 | 1 |
| B | 0 | 14423 | 1 |
| C | 0 | 43931 | 1 |
| D | 0 | 36091 | 1 |
| Mode SS | |||
|---|---|---|---|
| Quadrant | BADHDUFLAG | Total packets | Discarded packets |
| A | 0 | 124 | 0 |
| B | 0 | 124 | 0 |
| C | 0 | 124 | 0 |
| D | 0 | 124 | 0 |
| Quadrant | Total seconds | Saturated seconds | Saturation percentage |
|---|---|---|---|
| A | 6052 | 524 | 8.658295% |
| B | 6052 | 112 | 1.850628% |
| C | 6053 | 4317 | 71.320007% |
| D | 6053 | 2858 | 47.216256% |
Noise dominated data is calculated using 1-second bins in cleaned event files. If a bin has >2000 counts, and if more than 50% of those come from <1% of pixels, then it is considered to be noise-dominated and hence unusable.
| Quadrant | # 1 sec bins | Bins with >0 counts | Bins with >2000 counts | High rate bins dominated by noise | Noise dominated (total time) | Noise dominated (detector-on time) | Marked lightcurve |
|---|---|---|---|---|---|---|---|
| A | 6891 | 6051 | 454 | 454 | 6.59% | 7.50% | 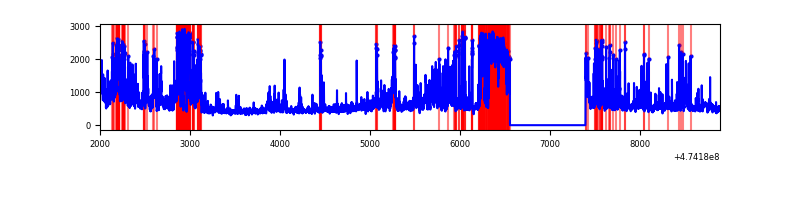 |
| B | 6891 | 6051 | 50 | 50 | 0.73% | 0.83% | 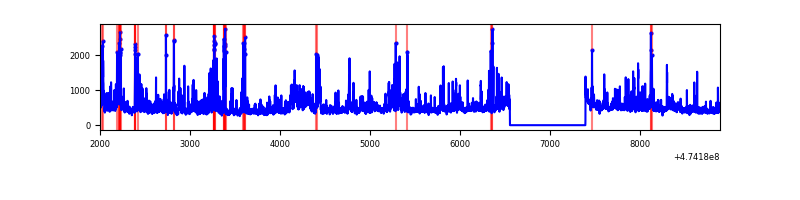 |
| C | 6892 | 6052 | 4471 | 4471 | 64.87% | 73.88% | 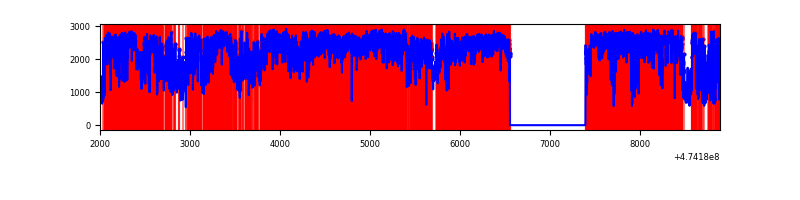 |
| D | 6892 | 6052 | 2881 | 2881 | 41.80% | 47.60% | 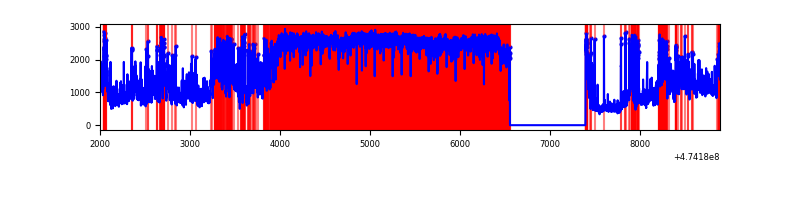 |
Top three noisy pixels from each quadrant. If the there are fewer than three noisy pixels in the level2.evt file, extra rows are filled as -1
| Pixel properties | Quadrant properties | ||||||
|---|---|---|---|---|---|---|---|
| Quadrant | DetID | PixID | Counts | Sigma | Mean | Median | Sigma |
| A | 0 | 98 | 797596 | 5249.93 | 615 | 600 | 151.8 |
| A | 3 | 114 | 371070 | 2440.34 | 615 | 600 | 151.8 |
| A | 11 | 7 | 315653 | 2075.3 | 615 | 600 | 151.8 |
| B | 6 | 36 | 246431 | 1830.28 | 628 | 606 | 134.3 |
| B | 5 | 32 | 206972 | 1536.49 | 628 | 606 | 134.3 |
| B | 4 | 216 | 93733 | 693.37 | 628 | 606 | 134.3 |
| C | 15 | 197 | 4190869 | 37743.86 | 394 | 392 | 111.0 |
| C | 4 | 111 | 3339125 | 30072.16 | 394 | 392 | 111.0 |
| C | 15 | 127 | 2040696 | 18377.13 | 394 | 392 | 111.0 |
| D | 7 | 61 | 5891394 | 49141.74 | 416 | 401 | 119.9 |
| D | 15 | 108 | 941732 | 7852.44 | 416 | 401 | 119.9 |
| D | 2 | 37 | 337325 | 2810.57 | 416 | 401 | 119.9 |
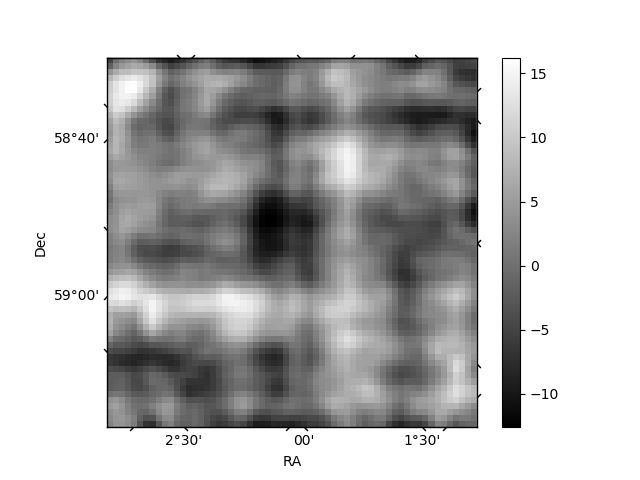
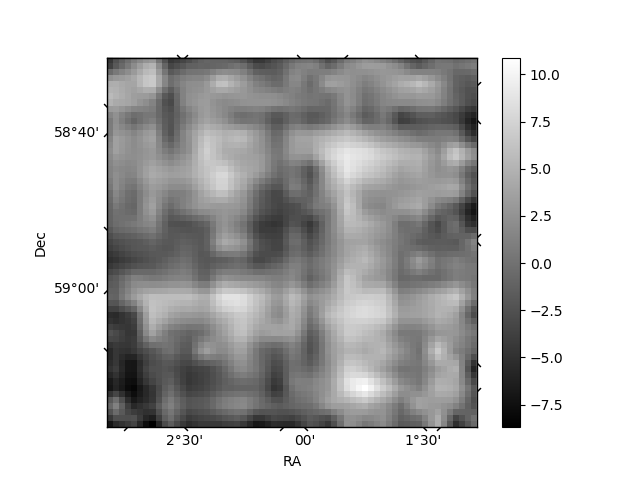
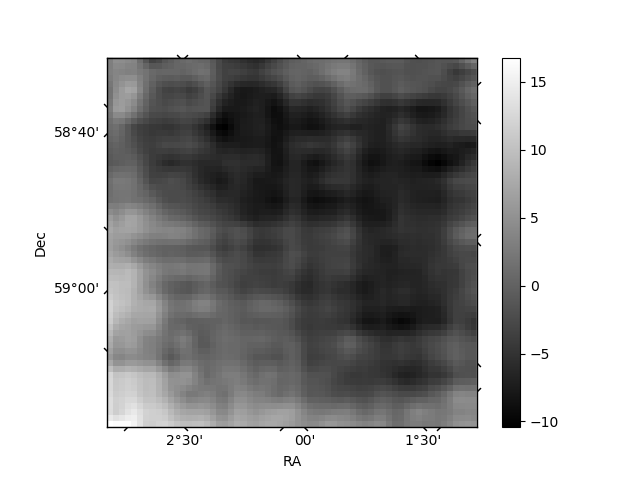
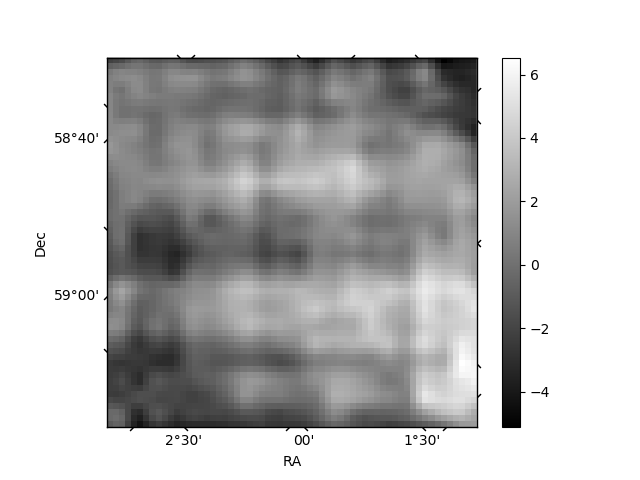
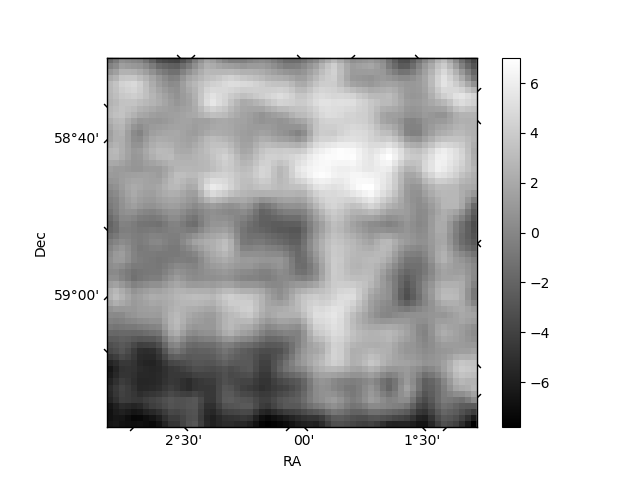
Histogram calculated using DETX and DETY for each event in the final _common_clean file
| Quadrant A | 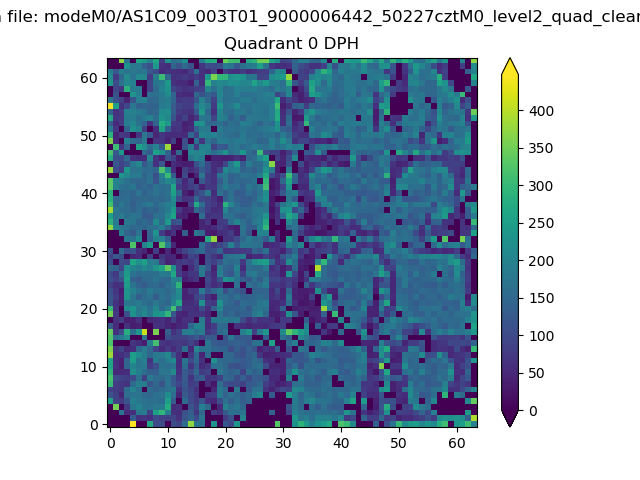 |
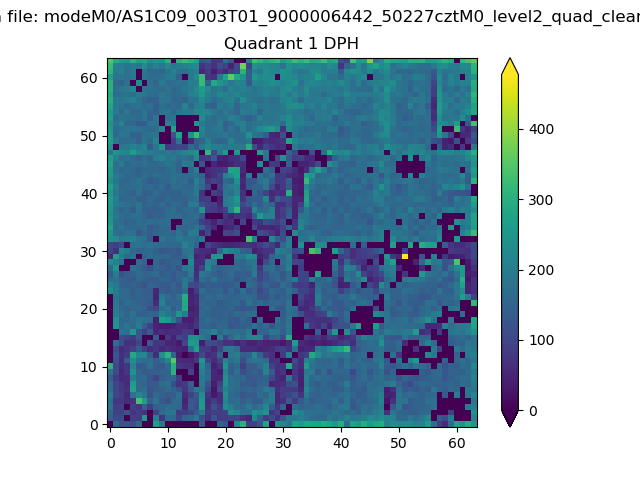 |
Quadrant B |
|---|---|---|---|
| Quadrant D |  |
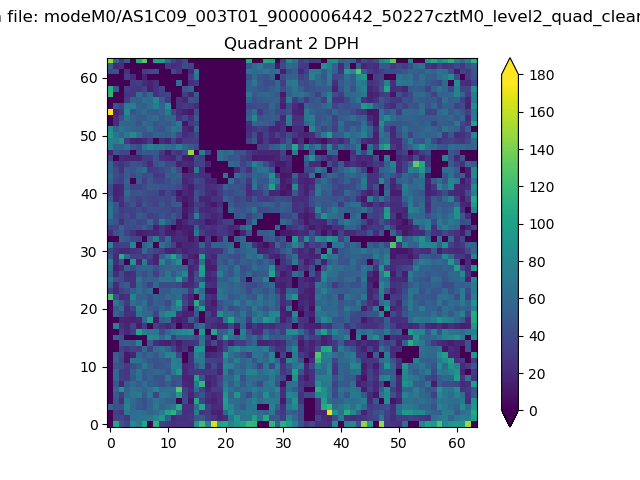 |
Quadrant C |
| Plot type | Count rate plots | Images |
|---|---|---|
| Comparison with Poisson distribution Blue bars denote a histogram of data divided into 1 sec bins. Red curve is a Poisson curve with rate = median count rate of data. |
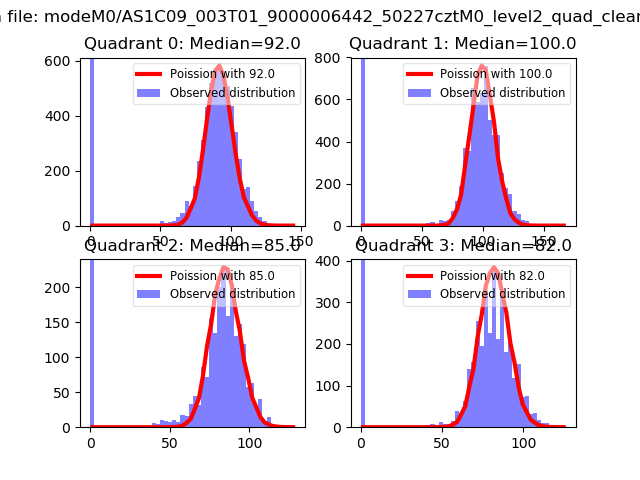 |
 |
| Quadrant-wise count rates Data is divided into 100 sec bins |
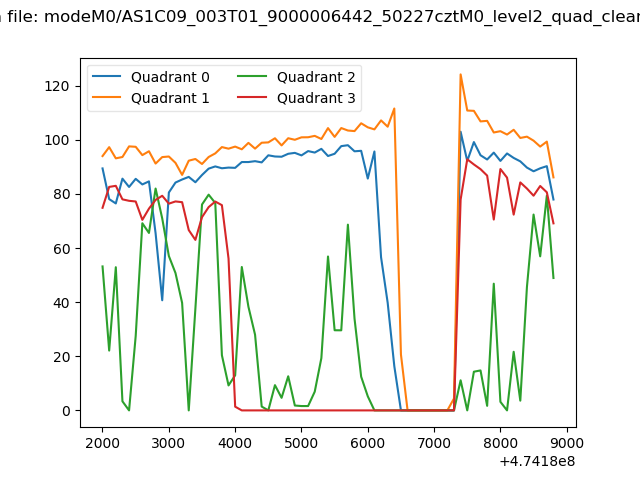 |
|
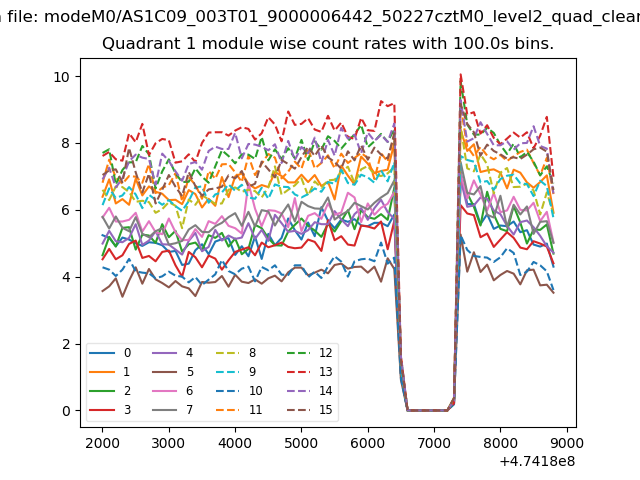
| Module-wise count rates for Quadrant A Data is divided into 100 sec bins |
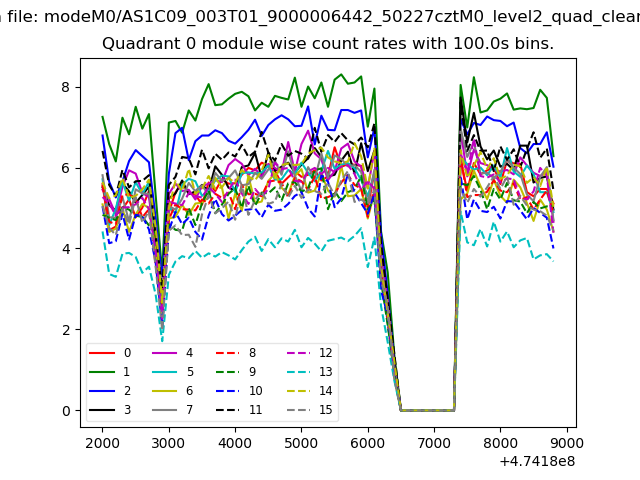 |
 |
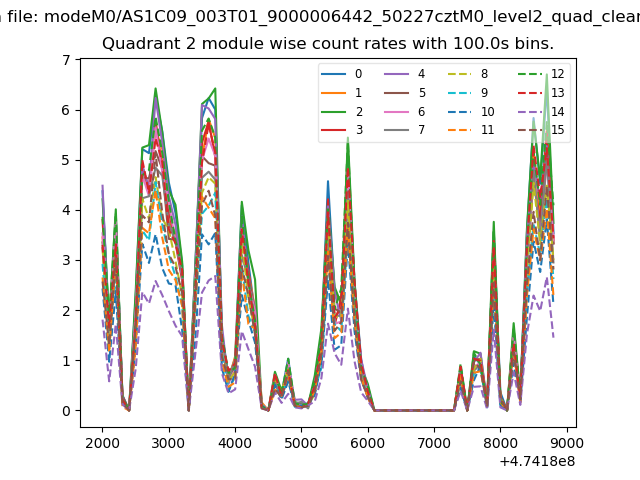
| Module-wise count rates for Quadrant B Data is divided into 100 sec bins |
 |
 |
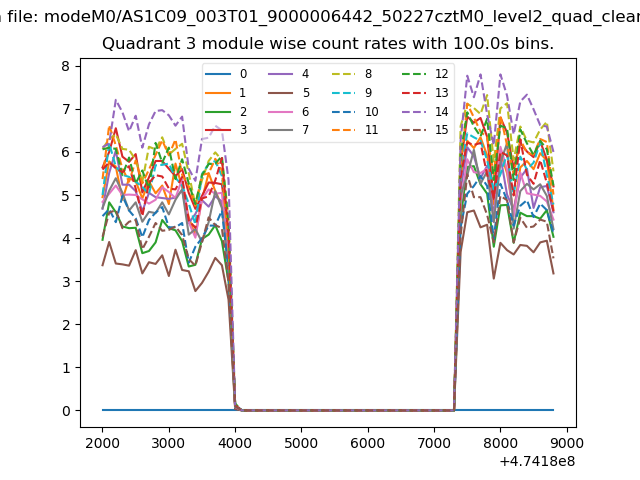
| Module-wise count rates for Quadrant C Data is divided into 100 sec bins |
 |
 |
| Module-wise count rates for Quadrant D Data is divided into 100 sec bins |
 |
 |
| Parameter | Plot |
|---|---|
| CZT HV Monitor |  |
| D_VDD | 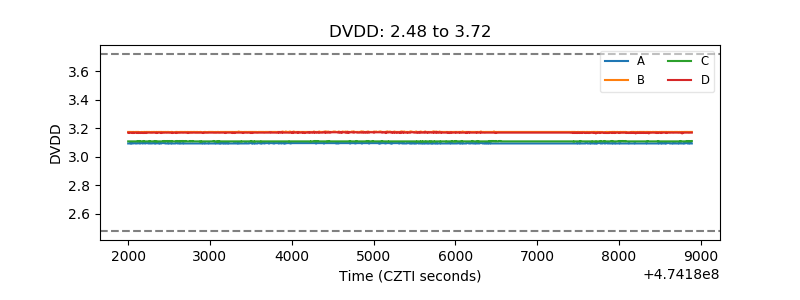 |
| Temperature 1 | 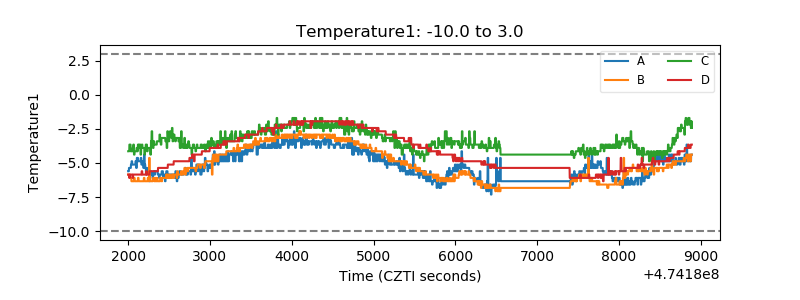 |
| Veto HV Monitor | 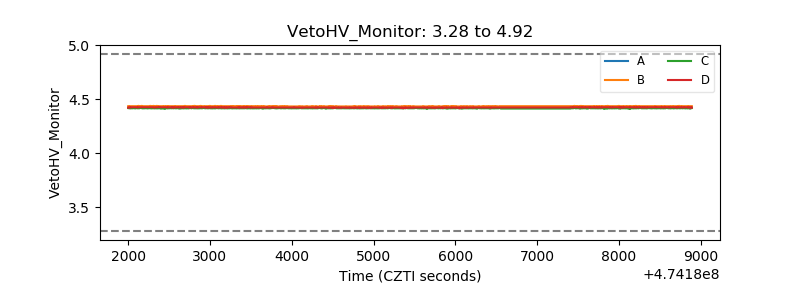 |
| Veto LLD | 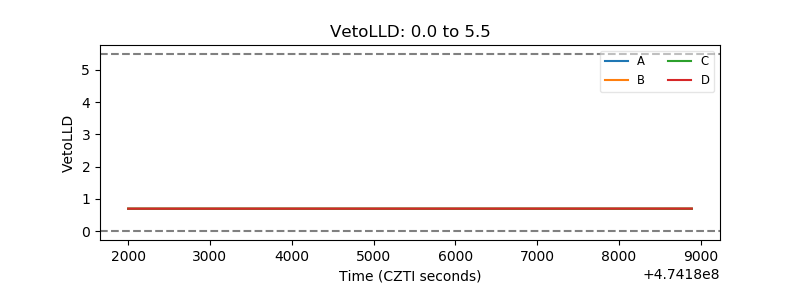 |
| Alpha Counter | 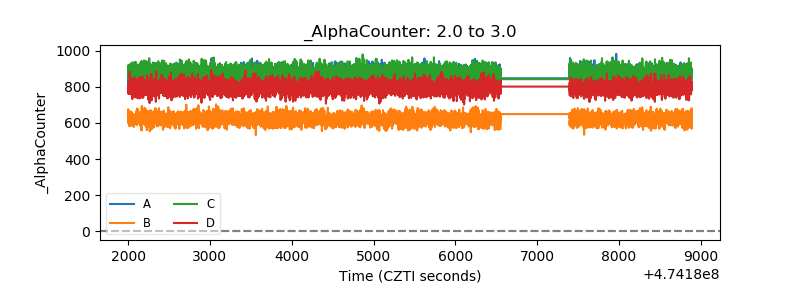 |
| _CPM_Rate | 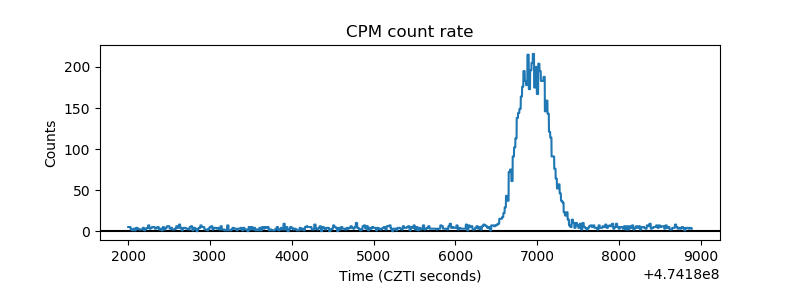 |
| CZT Counter | 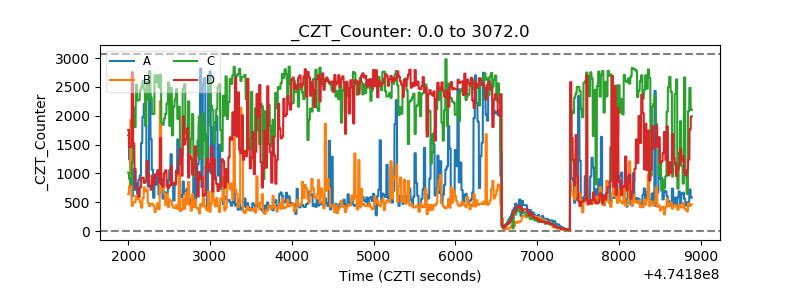 |
| +2.5 Volts monitor | 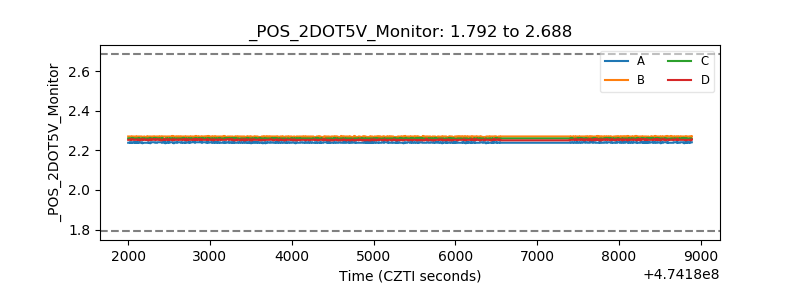 |
| +5 Volts monitor |  |
| _ROLL_ROT | 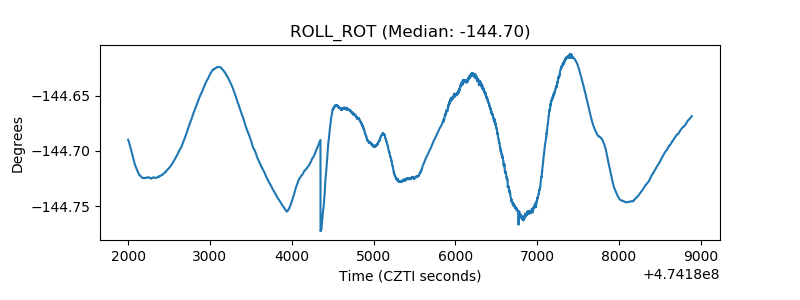 |
| _Roll_DEC | 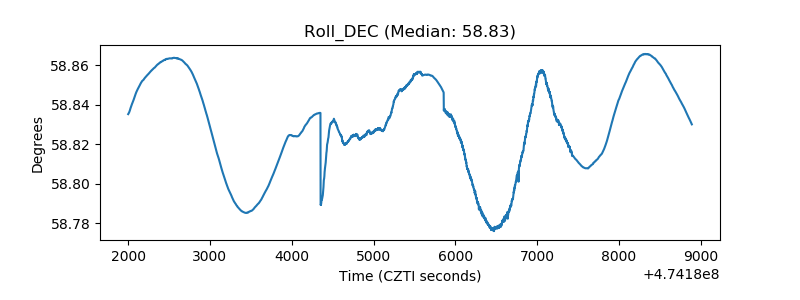 |
| _Roll_RA | 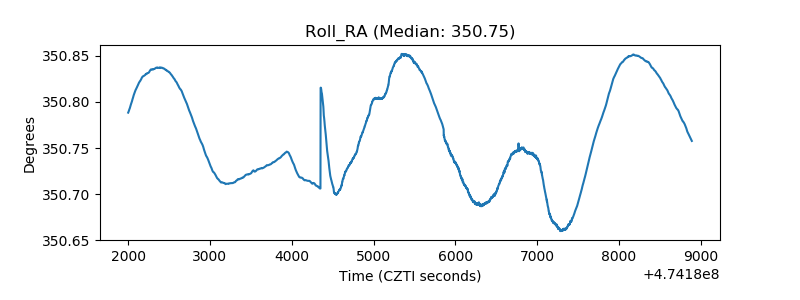 |
| Veto Counter | 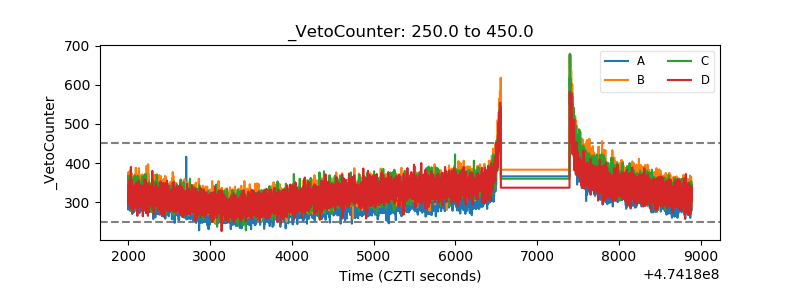 |