| Param | Original file | Final file |
|---|---|---|
| Filename | modeM0/AS1C09_003T01_9000006442_50229cztM0_level2.fits | modeM0/AS1C09_003T01_9000006442_50229cztM0_level2_quad_clean.evt |
| Size (bytes) | 901,019,520 | 66,666,240 |
| Size | 859.3 MB | 63.6 MB |
| Events in quadrant A | 4,599,010 | 550,938 |
| Events in quadrant B | 3,263,822 | 615,390 |
| Events in quadrant C | 13,190,611 | 195,191 |
| Events in quadrant D | 11,827,545 | 230,331 |
| Mode M9 | |||
|---|---|---|---|
| Quadrant | BADHDUFLAG | Total packets | Discarded packets |
| A | 0 | 9 | 0 |
| B | 0 | 9 | 0 |
| C | 0 | 9 | 0 |
| D | 0 | 9 | 0 |
| Mode M0 | |||
|---|---|---|---|
| Quadrant | BADHDUFLAG | Total packets | Discarded packets |
| A | 0 | 17745 | 1 |
| B | 0 | 13997 | 1 |
| C | 0 | 43409 | 1 |
| D | 0 | 39324 | 5 |
| Mode SS | |||
|---|---|---|---|
| Quadrant | BADHDUFLAG | Total packets | Discarded packets |
| A | 0 | 126 | 0 |
| B | 0 | 126 | 0 |
| C | 0 | 126 | 0 |
| D | 0 | 126 | 0 |
| Quadrant | Total seconds | Saturated seconds | Saturation percentage |
|---|---|---|---|
| A | 6100 | 354 | 5.803279% |
| B | 6101 | 162 | 2.655302% |
| C | 6101 | 4202 | 68.873955% |
| D | 6100 | 3587 | 58.803279% |
Noise dominated data is calculated using 1-second bins in cleaned event files. If a bin has >2000 counts, and if more than 50% of those come from <1% of pixels, then it is considered to be noise-dominated and hence unusable.
| Quadrant | # 1 sec bins | Bins with >0 counts | Bins with >2000 counts | High rate bins dominated by noise | Noise dominated (total time) | Noise dominated (detector-on time) | Marked lightcurve |
|---|---|---|---|---|---|---|---|
| A | 7054 | 6101 | 252 | 252 | 3.57% | 4.13% | 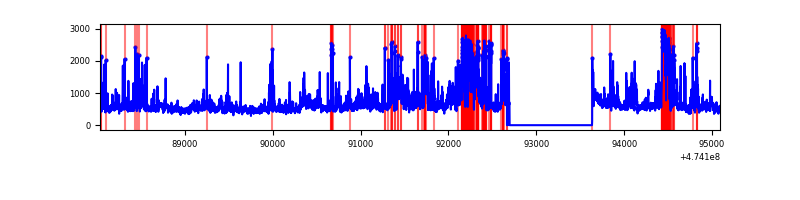 |
| B | 7055 | 6102 | 80 | 80 | 1.13% | 1.31% | 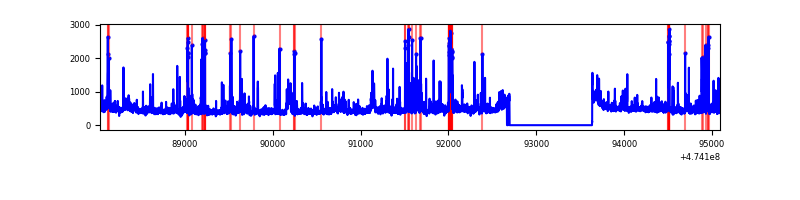 |
| C | 7056 | 6103 | 4327 | 4327 | 61.32% | 70.90% | 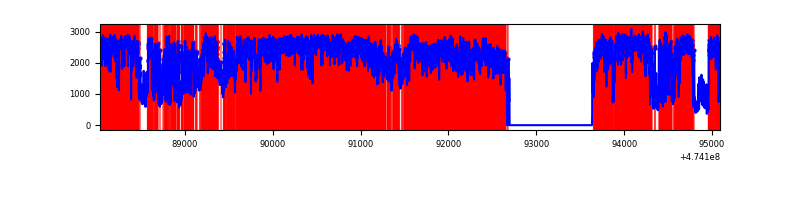 |
| D | 7055 | 6102 | 3643 | 3643 | 51.64% | 59.70% | 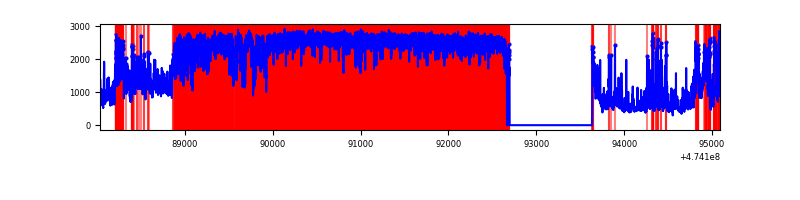 |
Top three noisy pixels from each quadrant. If the there are fewer than three noisy pixels in the level2.evt file, extra rows are filled as -1
| Pixel properties | Quadrant properties | ||||||
|---|---|---|---|---|---|---|---|
| Quadrant | DetID | PixID | Counts | Sigma | Mean | Median | Sigma |
| A | 11 | 7 | 378849 | 2416.09 | 636 | 620 | 156.5 |
| A | 15 | 32 | 266771 | 1700.15 | 636 | 620 | 156.5 |
| A | 8 | 38 | 255883 | 1630.59 | 636 | 620 | 156.5 |
| B | 6 | 203 | 106432 | 774.33 | 639 | 618 | 136.7 |
| B | 5 | 32 | 89323 | 649.13 | 639 | 618 | 136.7 |
| B | 5 | 185 | 74860 | 543.29 | 639 | 618 | 136.7 |
| C | 4 | 111 | 4671688 | 38305.91 | 425 | 421 | 121.9 |
| C | 15 | 197 | 3984772 | 32672.98 | 425 | 421 | 121.9 |
| C | 15 | 127 | 1340313 | 10987.55 | 425 | 421 | 121.9 |
| D | 7 | 61 | 6320697 | 49217.54 | 442 | 425 | 128.4 |
| D | 15 | 108 | 1084938 | 8445.37 | 442 | 425 | 128.4 |
| D | 15 | 58 | 572842 | 4457.55 | 442 | 425 | 128.4 |
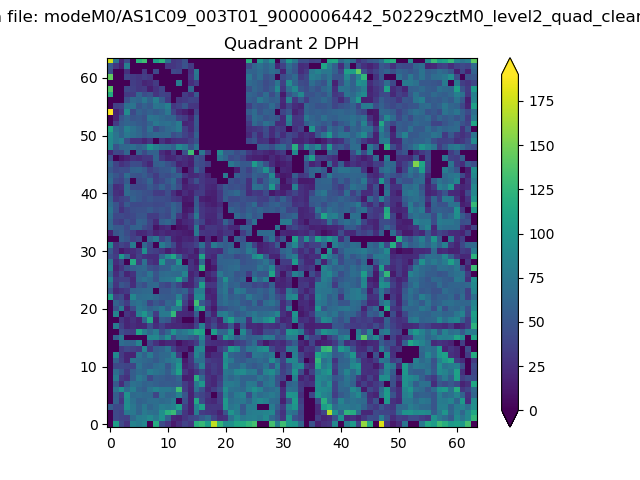
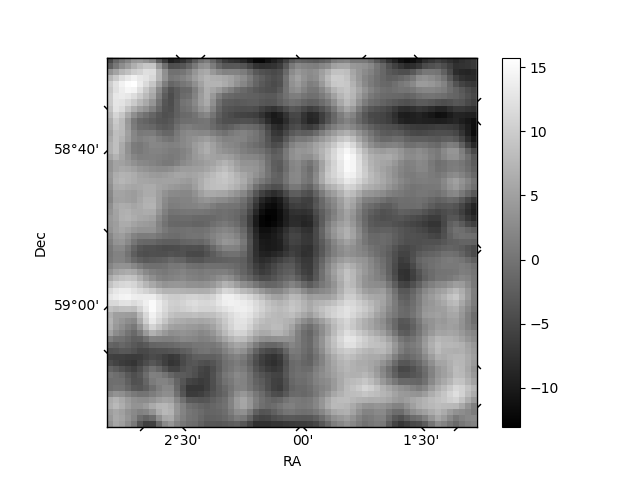
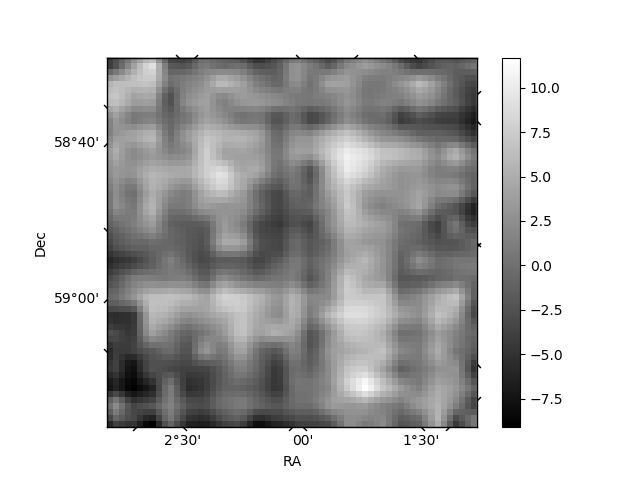
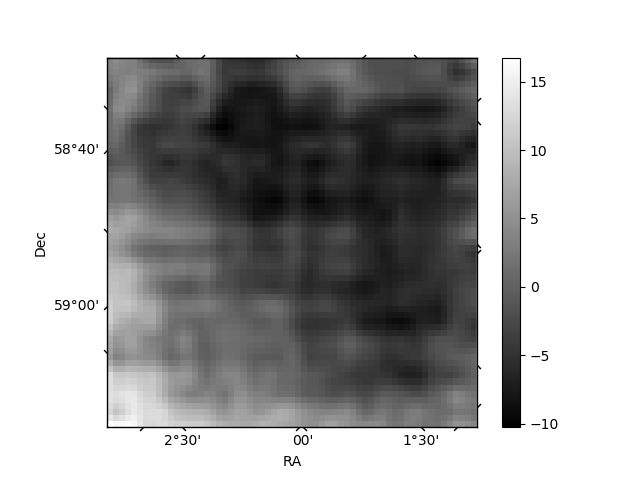
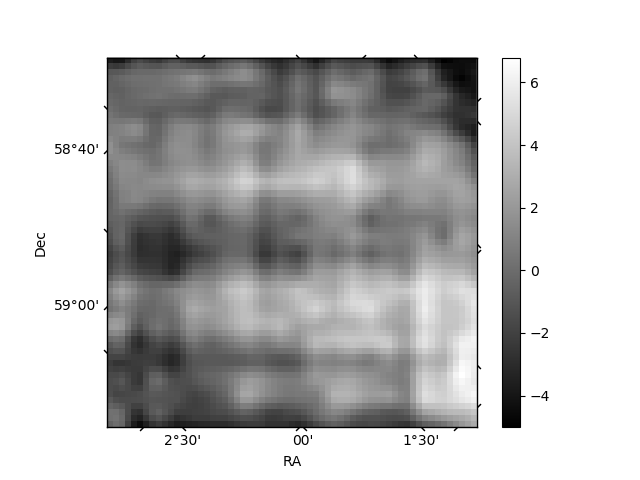
Histogram calculated using DETX and DETY for each event in the final _common_clean file
| Quadrant A | 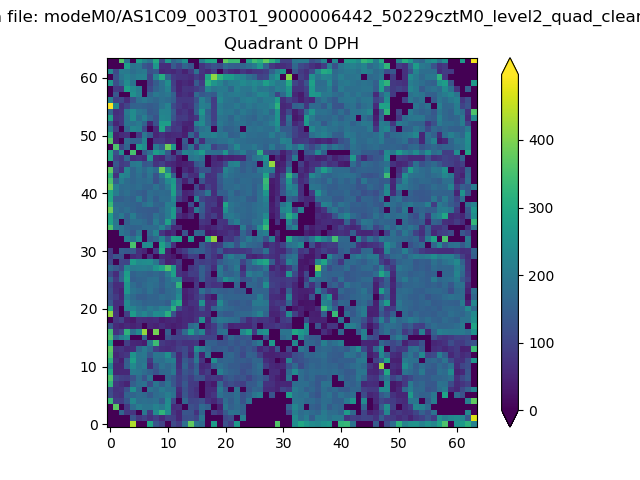 |
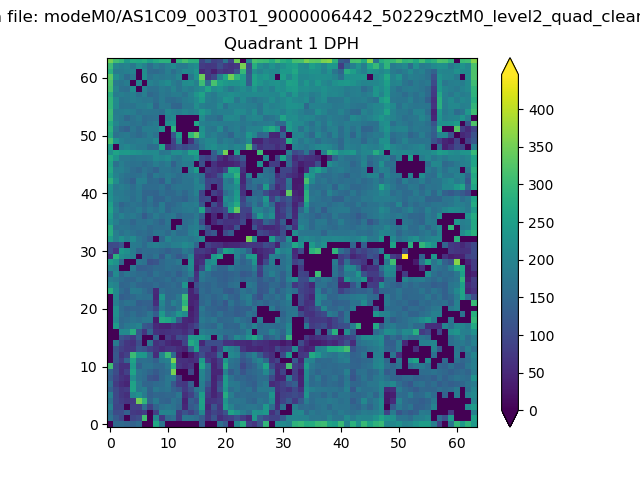 |
Quadrant B |
|---|---|---|---|
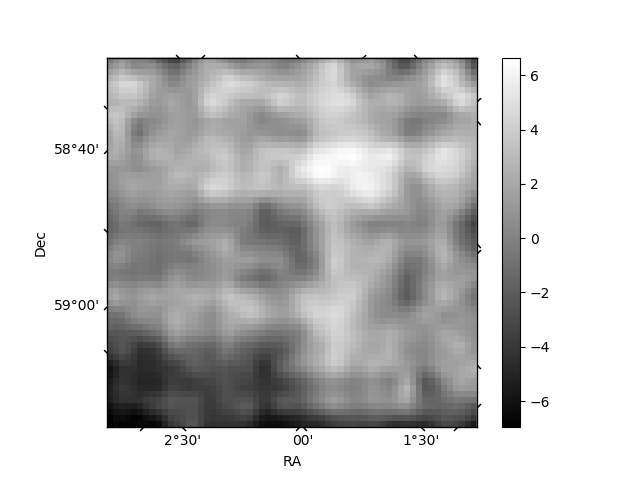
| Quadrant D | 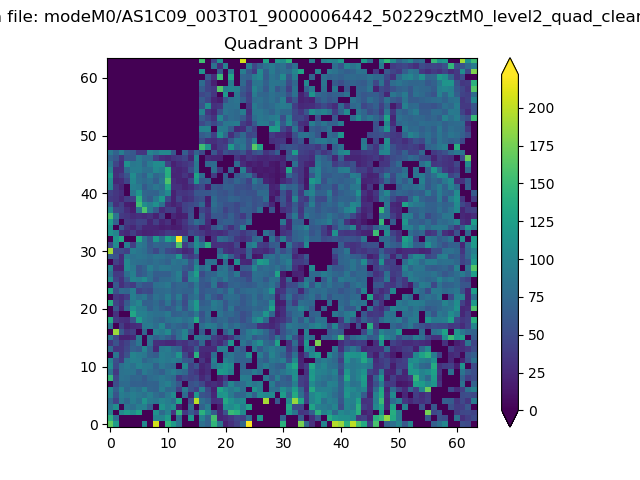 |
 |
Quadrant C |
| Plot type | Count rate plots | Images |
|---|---|---|
| Comparison with Poisson distribution Blue bars denote a histogram of data divided into 1 sec bins. Red curve is a Poisson curve with rate = median count rate of data. |
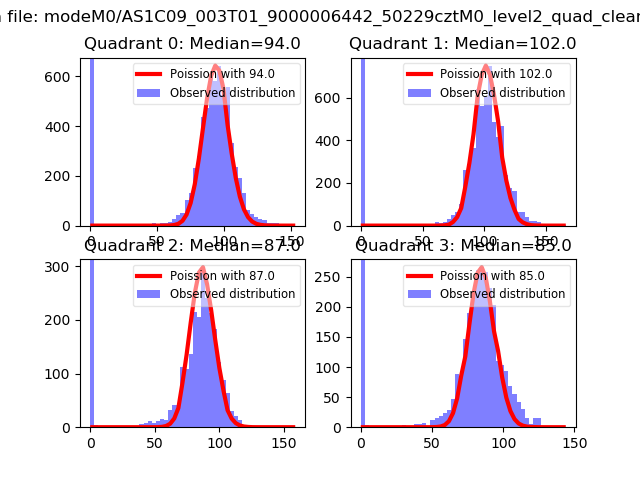 |
 |
| Quadrant-wise count rates Data is divided into 100 sec bins |
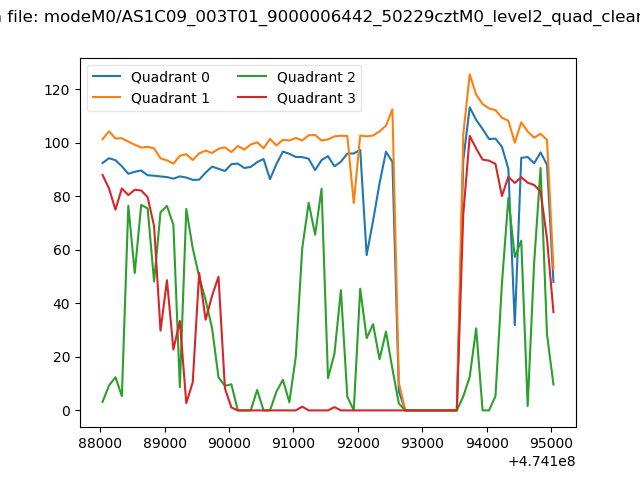 |
|
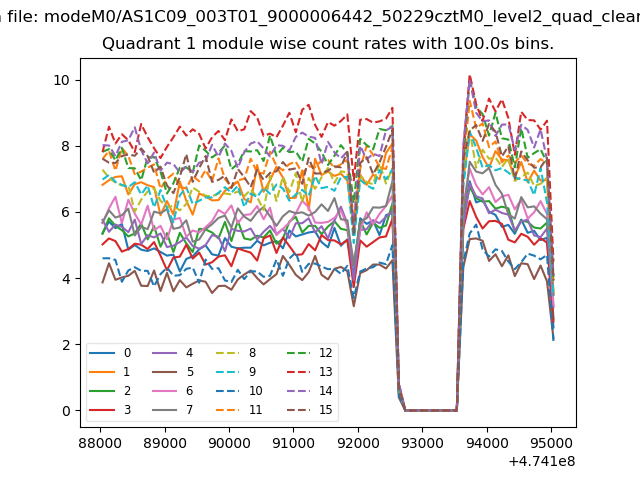
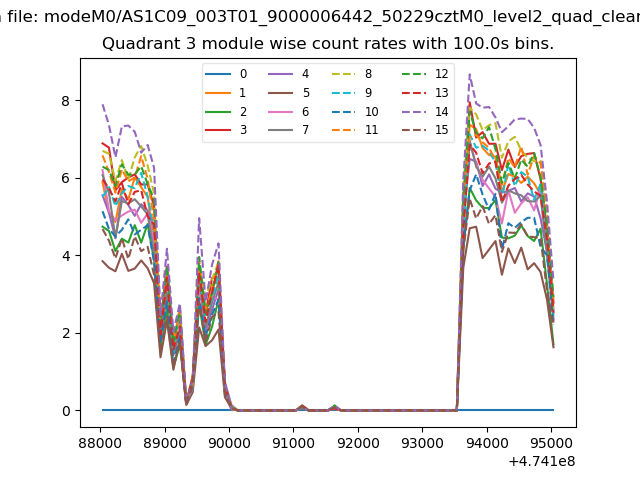
| Module-wise count rates for Quadrant A Data is divided into 100 sec bins |
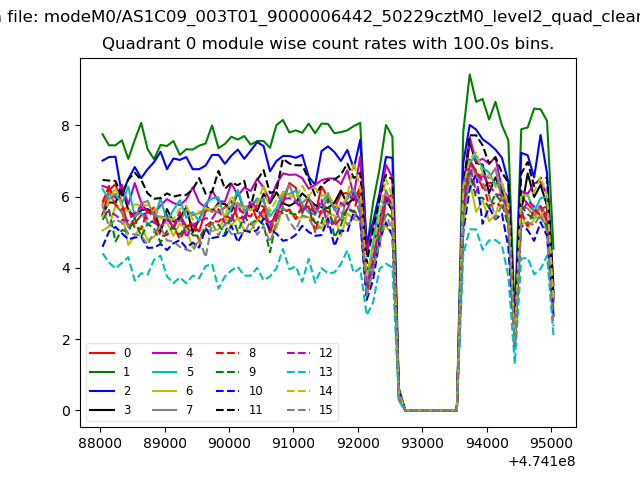 |
 |
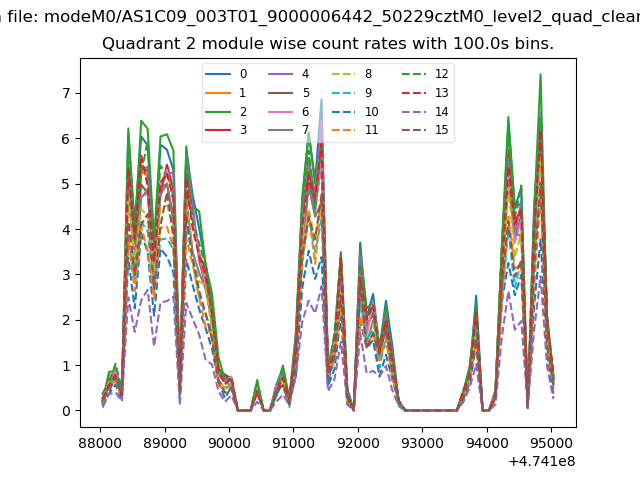
| Module-wise count rates for Quadrant B Data is divided into 100 sec bins |
 |
 |
| Module-wise count rates for Quadrant C Data is divided into 100 sec bins |
 |
 |
| Module-wise count rates for Quadrant D Data is divided into 100 sec bins |
 |
 |
| Parameter | Plot |
|---|---|
| CZT HV Monitor | 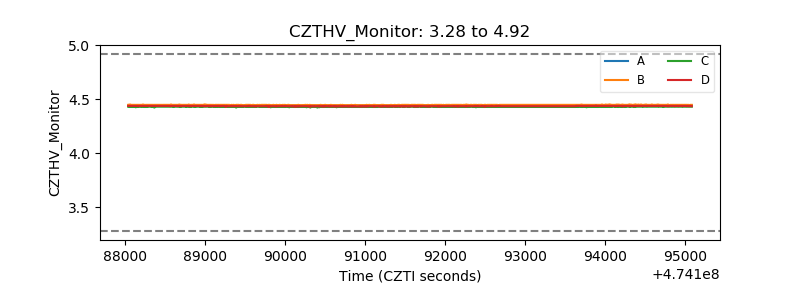 |
| D_VDD | 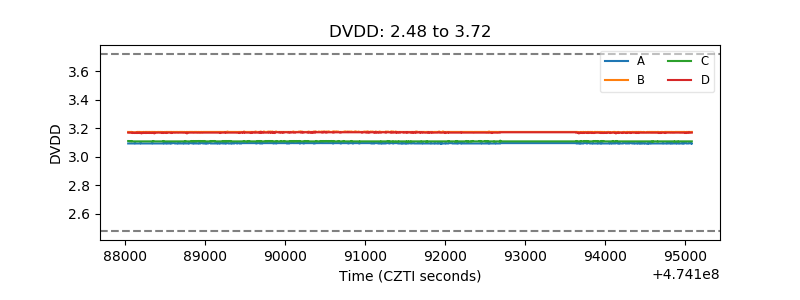 |
| Temperature 1 | 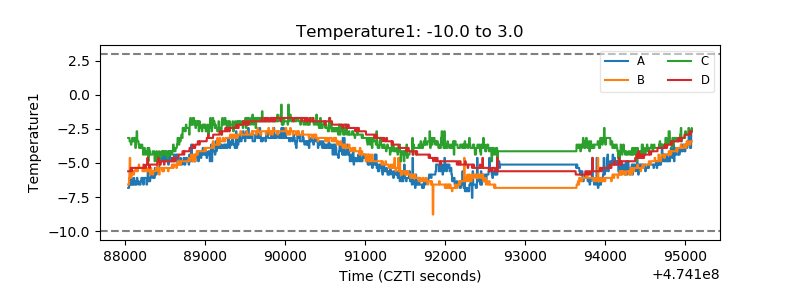 |
| Veto HV Monitor | 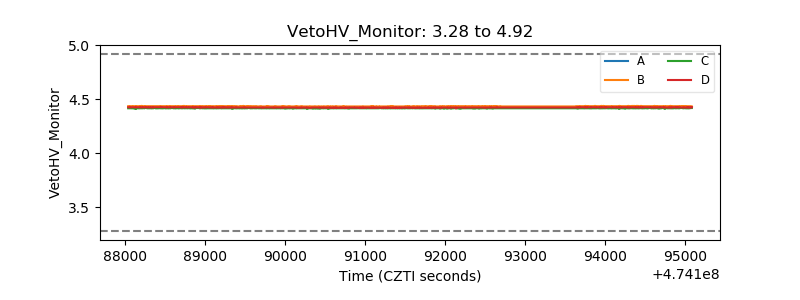 |
| Veto LLD | 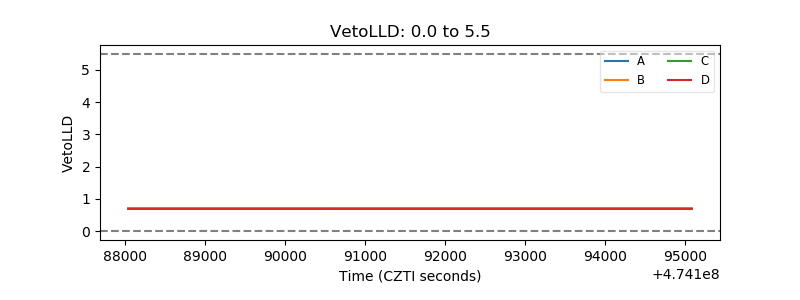 |
| Alpha Counter | 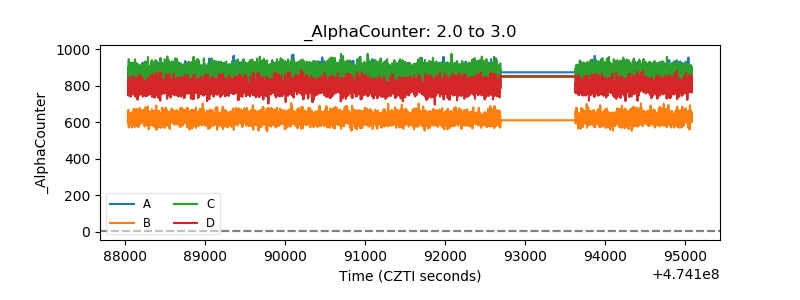 |
| _CPM_Rate | 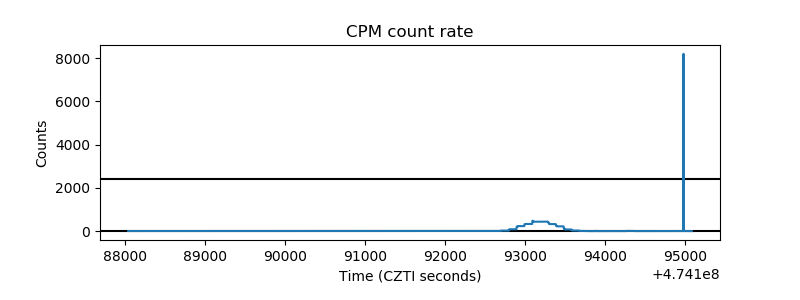 |
| CZT Counter | 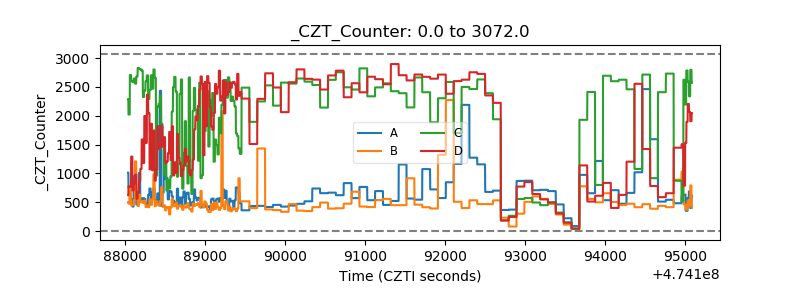 |
| +2.5 Volts monitor | 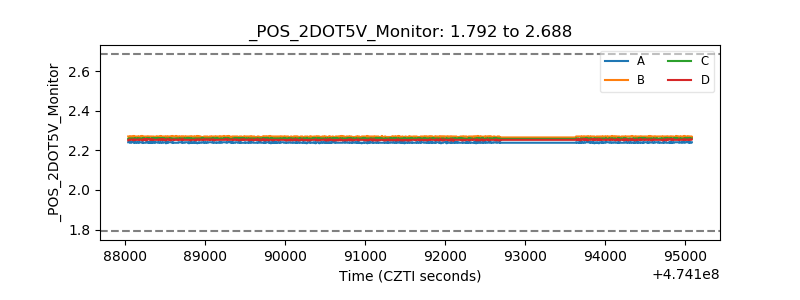 |
| +5 Volts monitor |  |
| _ROLL_ROT | 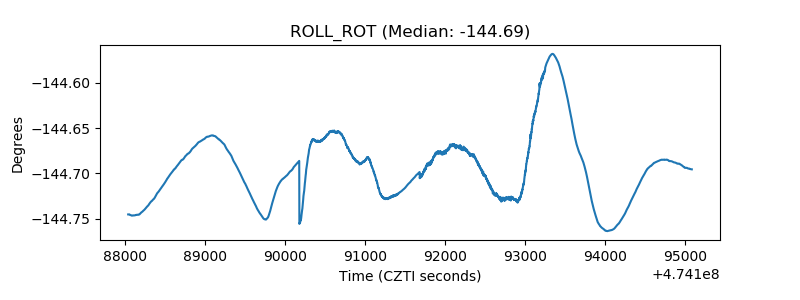 |
| _Roll_DEC | 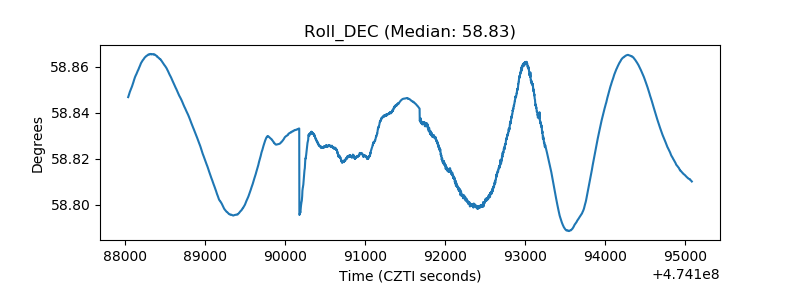 |
| _Roll_RA | 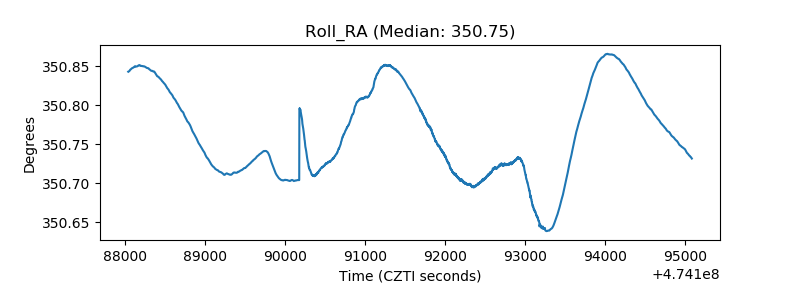 |
| Veto Counter | 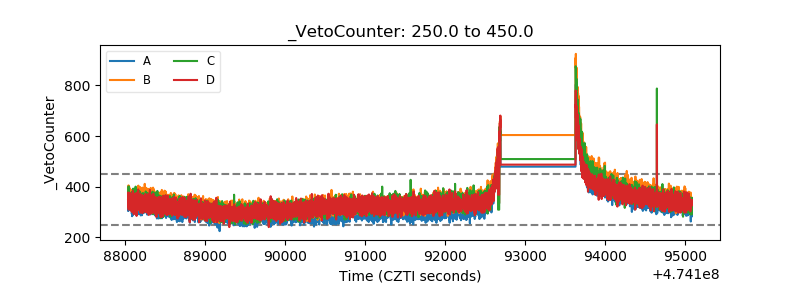 |