| Param | Original file | Final file |
|---|---|---|
| Filename | modeM0/AS1C09_003T01_9000006442_50230cztM0_level2.fits | modeM0/AS1C09_003T01_9000006442_50230cztM0_level2_quad_clean.evt |
| Size (bytes) | 900,420,480 | 69,871,680 |
| Size | 858.7 MB | 66.6 MB |
| Events in quadrant A | 4,474,102 | 585,728 |
| Events in quadrant B | 4,063,510 | 635,727 |
| Events in quadrant C | 13,712,966 | 161,777 |
| Events in quadrant D | 10,601,197 | 299,972 |
| Mode M9 | |||
|---|---|---|---|
| Quadrant | BADHDUFLAG | Total packets | Discarded packets |
| A | 0 | 11 | 0 |
| B | 0 | 11 | 0 |
| C | 0 | 11 | 0 |
| D | 0 | 11 | 0 |
| Mode M0 | |||
|---|---|---|---|
| Quadrant | BADHDUFLAG | Total packets | Discarded packets |
| A | 0 | 17544 | 1 |
| B | 0 | 16253 | 1 |
| C | 0 | 44959 | 1 |
| D | 0 | 35712 | 1 |
| Mode SS | |||
|---|---|---|---|
| Quadrant | BADHDUFLAG | Total packets | Discarded packets |
| A | 0 | 126 | 0 |
| B | 0 | 126 | 0 |
| C | 0 | 126 | 0 |
| D | 0 | 126 | 0 |
| Quadrant | Total seconds | Saturated seconds | Saturation percentage |
|---|---|---|---|
| A | 6191 | 255 | 4.118882% |
| B | 6192 | 285 | 4.602713% |
| C | 6192 | 4672 | 75.452196% |
| D | 6192 | 2970 | 47.965116% |
Noise dominated data is calculated using 1-second bins in cleaned event files. If a bin has >2000 counts, and if more than 50% of those come from <1% of pixels, then it is considered to be noise-dominated and hence unusable.
| Quadrant | # 1 sec bins | Bins with >0 counts | Bins with >2000 counts | High rate bins dominated by noise | Noise dominated (total time) | Noise dominated (detector-on time) | Marked lightcurve |
|---|---|---|---|---|---|---|---|
| A | 7276 | 6192 | 155 | 155 | 2.13% | 2.50% | 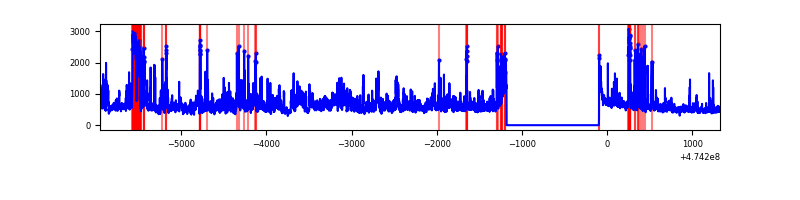 |
| B | 7277 | 6193 | 219 | 219 | 3.01% | 3.54% | 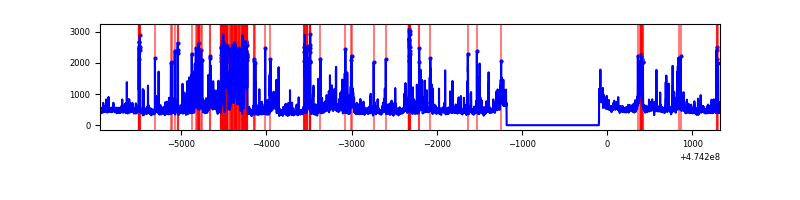 |
| C | 7277 | 6193 | 4671 | 4671 | 64.19% | 75.42% | 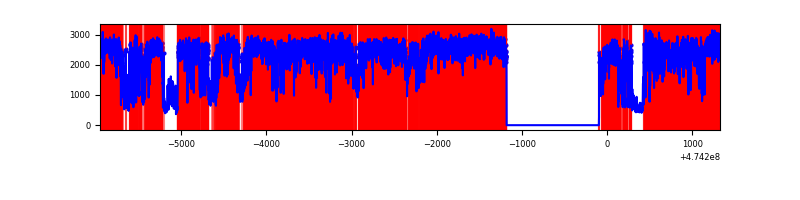 |
| D | 7277 | 6193 | 3058 | 3058 | 42.02% | 49.38% | 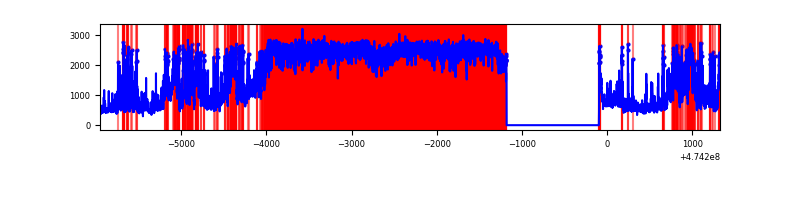 |
Top three noisy pixels from each quadrant. If the there are fewer than three noisy pixels in the level2.evt file, extra rows are filled as -1
| Pixel properties | Quadrant properties | ||||||
|---|---|---|---|---|---|---|---|
| Quadrant | DetID | PixID | Counts | Sigma | Mean | Median | Sigma |
| A | 3 | 14 | 471478 | 2917.47 | 655 | 640 | 161.4 |
| A | 8 | 38 | 317005 | 1960.3 | 655 | 640 | 161.4 |
| A | 4 | 3 | 121782 | 750.64 | 655 | 640 | 161.4 |
| B | 5 | 32 | 688170 | 4994.35 | 651 | 631 | 137.7 |
| B | 8 | 128 | 117414 | 848.32 | 651 | 631 | 137.7 |
| B | 10 | 28 | 92766 | 669.27 | 651 | 631 | 137.7 |
| C | 4 | 111 | 6794906 | 65714.66 | 366 | 363 | 103.4 |
| C | 15 | 197 | 3346893 | 32366.57 | 366 | 363 | 103.4 |
| C | 15 | 127 | 768624 | 7430.38 | 366 | 363 | 103.4 |
| D | 7 | 61 | 5557762 | 38687.35 | 500 | 481 | 143.6 |
| D | 15 | 58 | 642644 | 4470.46 | 500 | 481 | 143.6 |
| D | 15 | 108 | 573936 | 3992.14 | 500 | 481 | 143.6 |
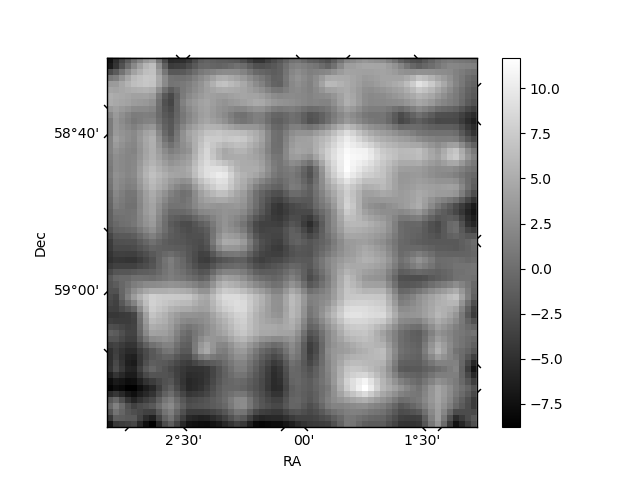
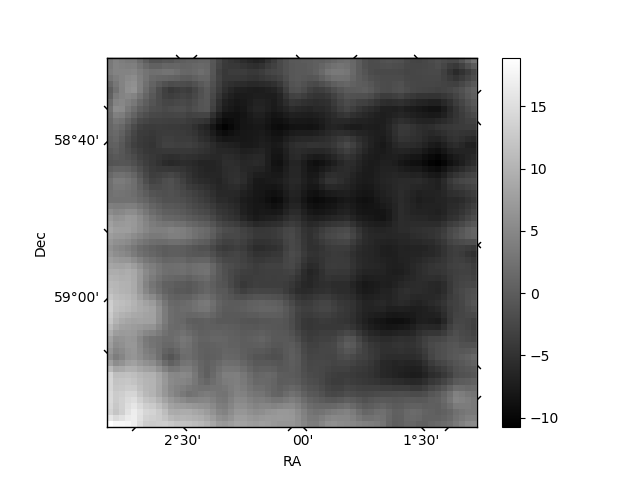
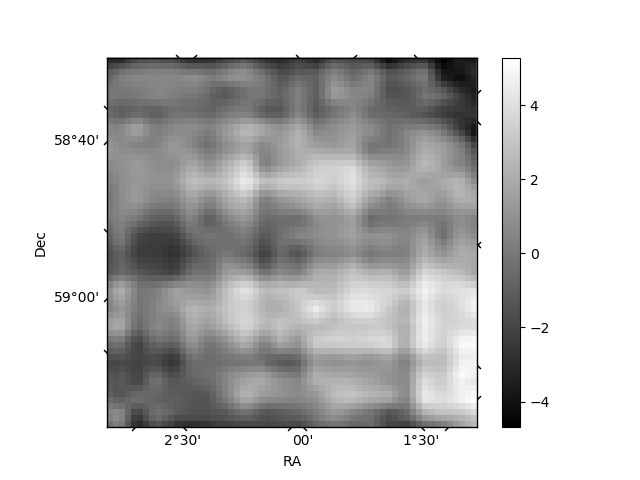
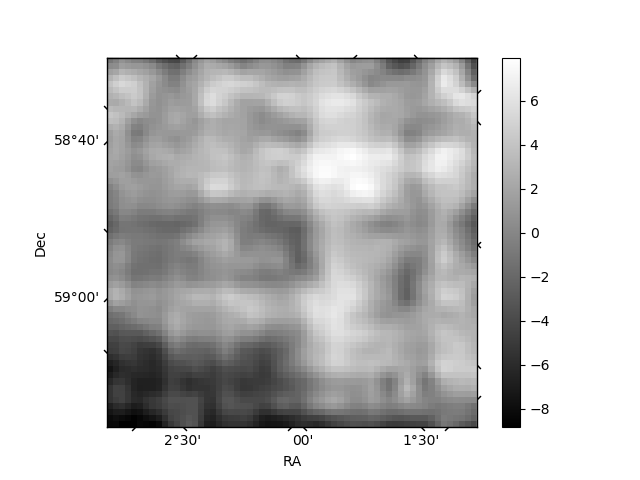
Histogram calculated using DETX and DETY for each event in the final _common_clean file
| Quadrant A |  |
 |
Quadrant B |
|---|---|---|---|
| Quadrant D |  |
 |
Quadrant C |
| Plot type | Count rate plots | Images |
|---|---|---|
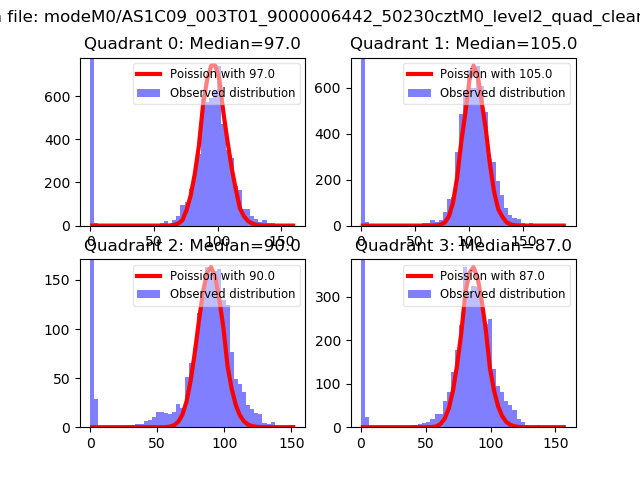
| Comparison with Poisson distribution Blue bars denote a histogram of data divided into 1 sec bins. Red curve is a Poisson curve with rate = median count rate of data. |
 |
 |
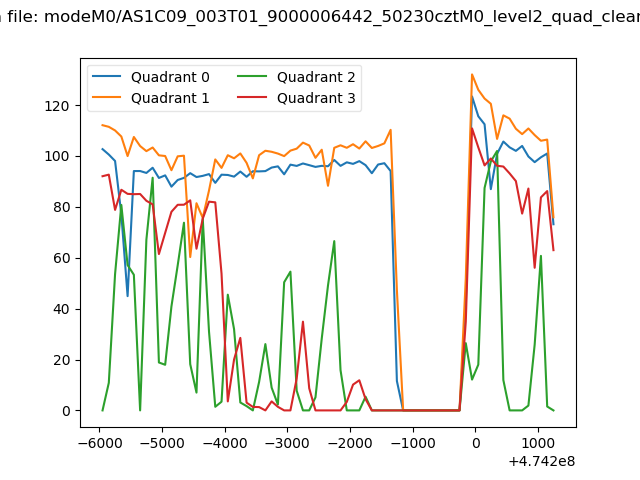
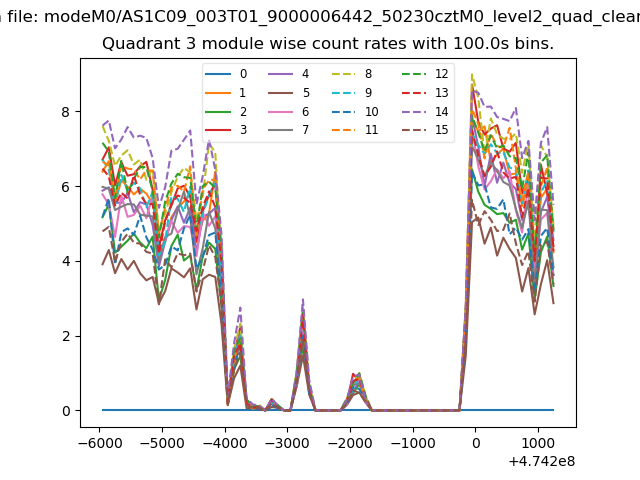
| Quadrant-wise count rates Data is divided into 100 sec bins |
 |
|
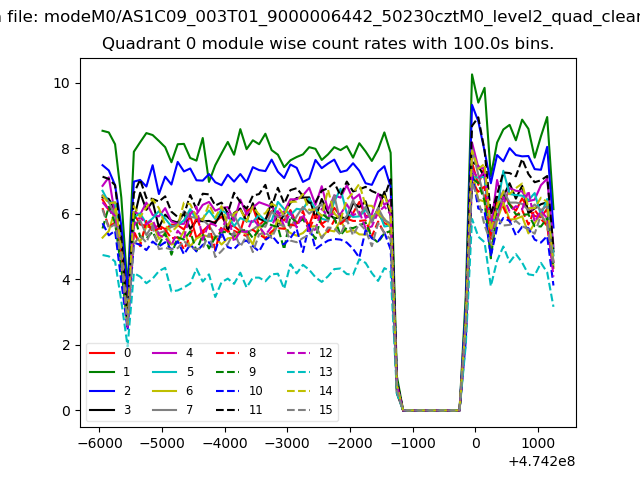
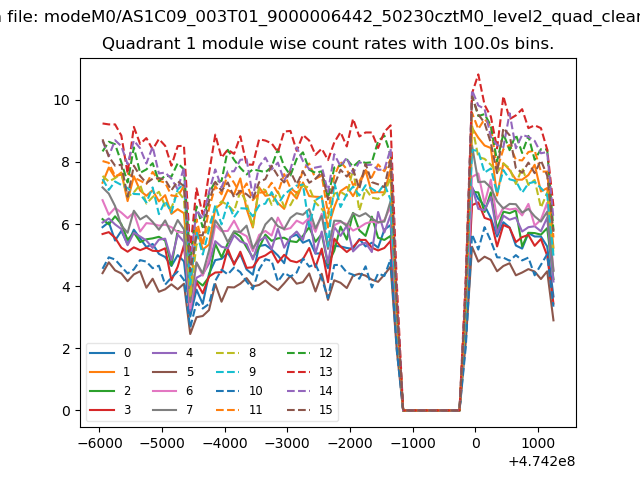
| Module-wise count rates for Quadrant A Data is divided into 100 sec bins |
 |
 |
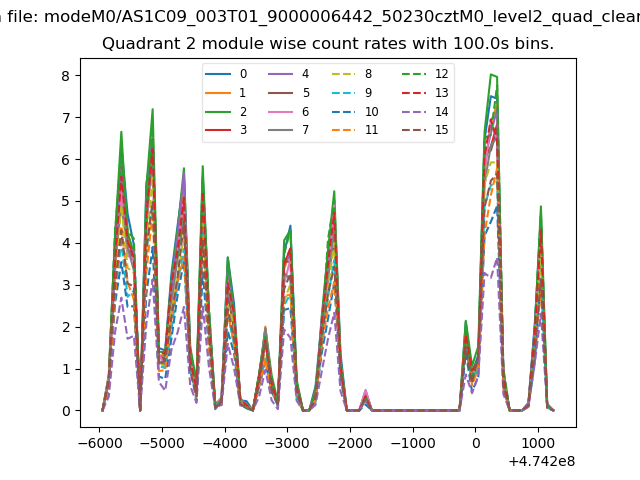
| Module-wise count rates for Quadrant B Data is divided into 100 sec bins |
 |
 |
| Module-wise count rates for Quadrant C Data is divided into 100 sec bins |
 |
 |
| Module-wise count rates for Quadrant D Data is divided into 100 sec bins |
 |
 |
| Parameter | Plot |
|---|---|
| CZT HV Monitor | 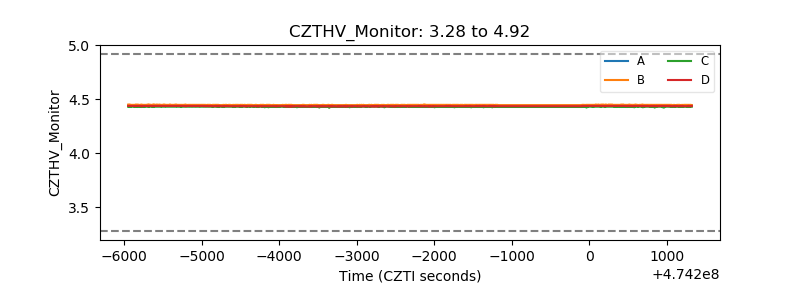 |
| D_VDD | 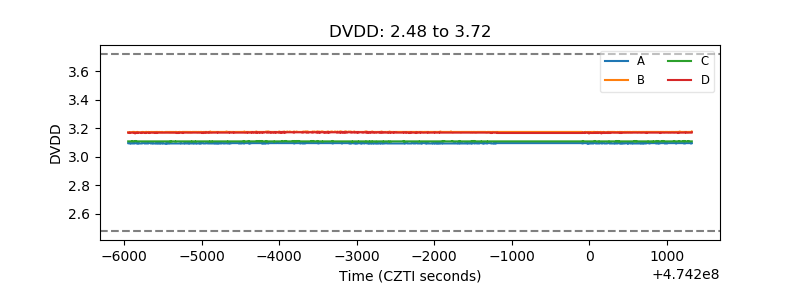 |
| Temperature 1 | 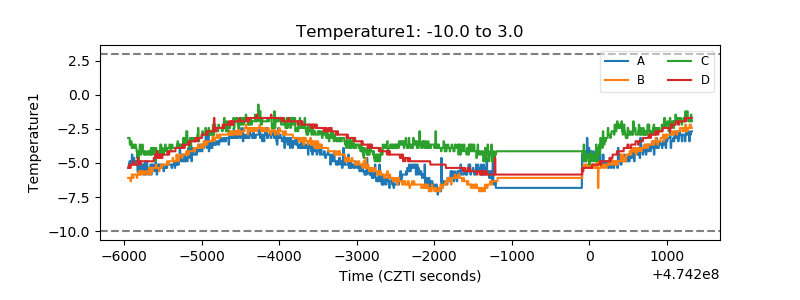 |
| Veto HV Monitor |  |
| Veto LLD | 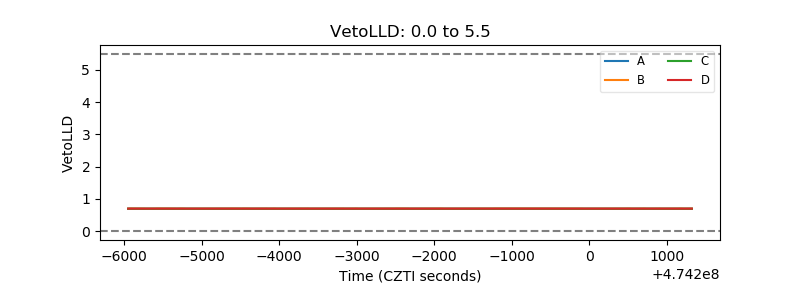 |
| Alpha Counter | 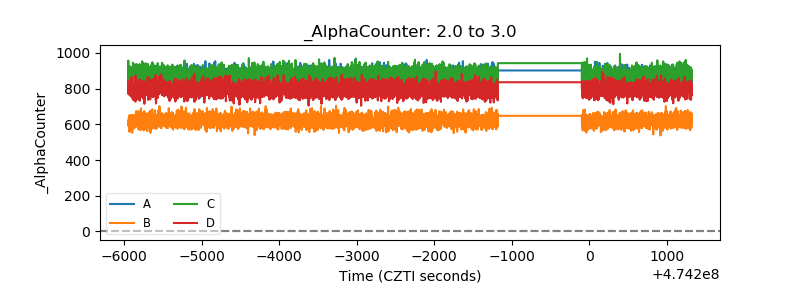 |
| _CPM_Rate | 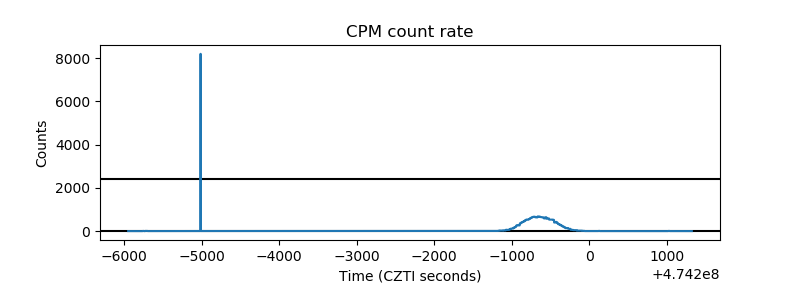 |
| CZT Counter | 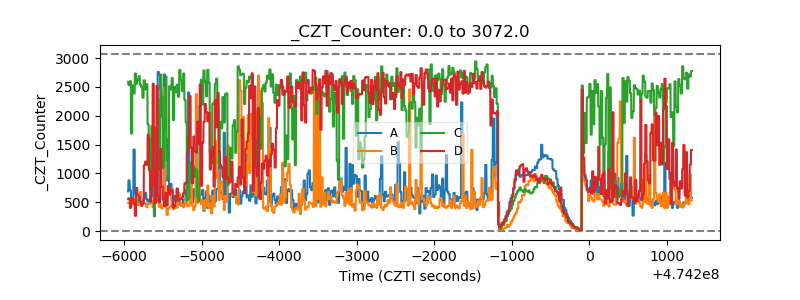 |
| +2.5 Volts monitor | 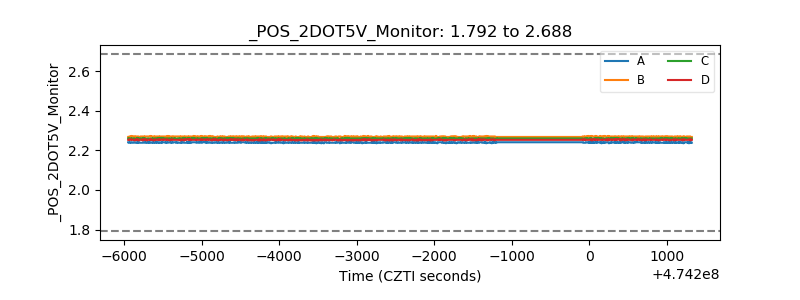 |
| +5 Volts monitor | 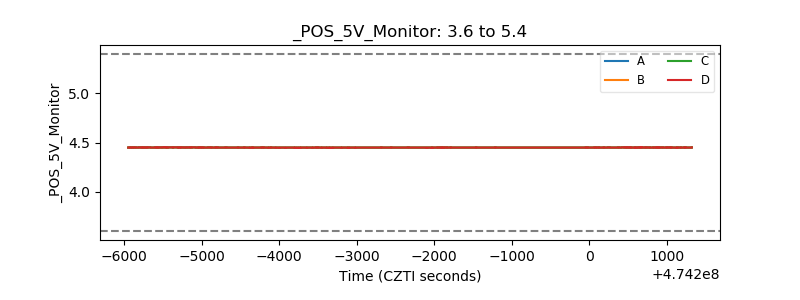 |
| _ROLL_ROT | 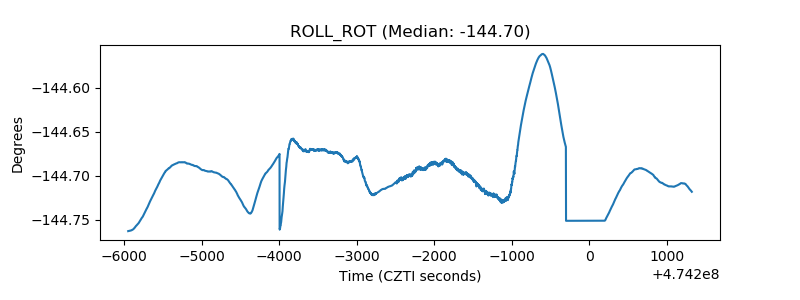 |
| _Roll_DEC | 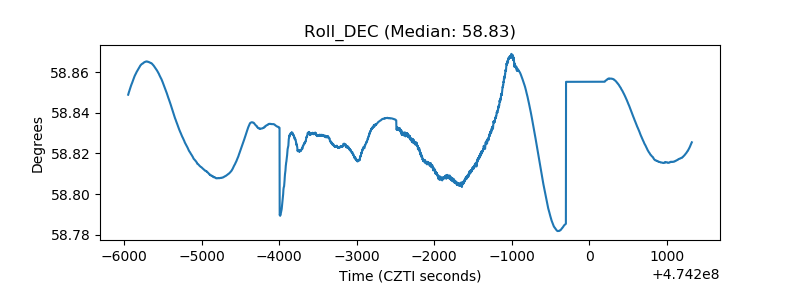 |
| _Roll_RA | 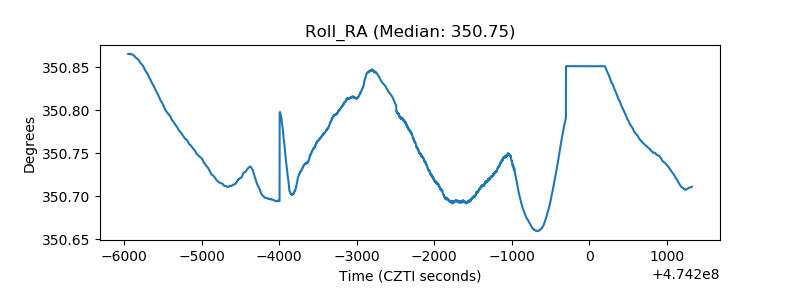 |
| Veto Counter | 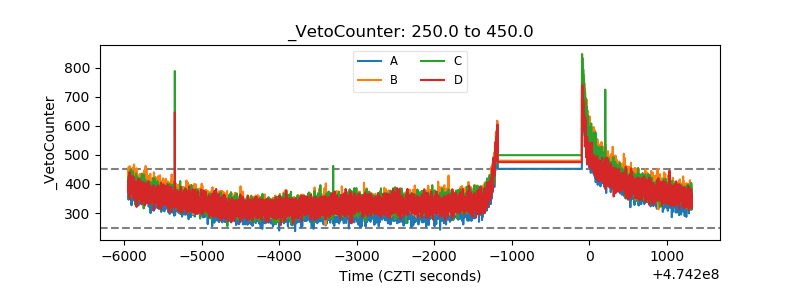 |