| Param | Original file | Final file |
|---|---|---|
| Filename | modeM0/AS1C09_003T01_9000006442_50231cztM0_level2.fits | modeM0/AS1C09_003T01_9000006442_50231cztM0_level2_quad_clean.evt |
| Size (bytes) | 863,850,240 | 73,192,320 |
| Size | 823.8 MB | 69.8 MB |
| Events in quadrant A | 4,195,060 | 599,101 |
| Events in quadrant B | 3,701,561 | 664,344 |
| Events in quadrant C | 13,228,191 | 162,019 |
| Events in quadrant D | 10,372,274 | 358,070 |
| Mode M9 | |||
|---|---|---|---|
| Quadrant | BADHDUFLAG | Total packets | Discarded packets |
| A | 0 | 11 | 0 |
| B | 0 | 11 | 0 |
| C | 0 | 11 | 0 |
| D | 0 | 11 | 0 |
| Mode M0 | |||
|---|---|---|---|
| Quadrant | BADHDUFLAG | Total packets | Discarded packets |
| A | 0 | 16451 | 8 |
| B | 0 | 15176 | 1 |
| C | 0 | 43514 | 1 |
| D | 0 | 35040 | 1 |
| Mode SS | |||
|---|---|---|---|
| Quadrant | BADHDUFLAG | Total packets | Discarded packets |
| A | 0 | 126 | 0 |
| B | 0 | 126 | 0 |
| C | 0 | 126 | 0 |
| D | 0 | 126 | 0 |
| Quadrant | Total seconds | Saturated seconds | Saturation percentage |
|---|---|---|---|
| A | 6196 | 340 | 5.487411% |
| B | 6197 | 186 | 3.001452% |
| C | 6197 | 4692 | 75.714055% |
| D | 6197 | 2499 | 40.325964% |
Noise dominated data is calculated using 1-second bins in cleaned event files. If a bin has >2000 counts, and if more than 50% of those come from <1% of pixels, then it is considered to be noise-dominated and hence unusable.
| Quadrant | # 1 sec bins | Bins with >0 counts | Bins with >2000 counts | High rate bins dominated by noise | Noise dominated (total time) | Noise dominated (detector-on time) | Marked lightcurve |
|---|---|---|---|---|---|---|---|
| A | 7321 | 6197 | 206 | 206 | 2.81% | 3.32% | 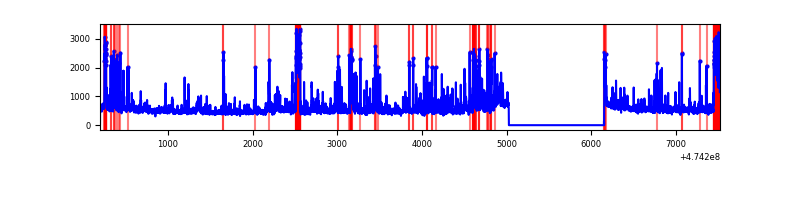 |
| B | 7322 | 6198 | 63 | 63 | 0.86% | 1.02% | 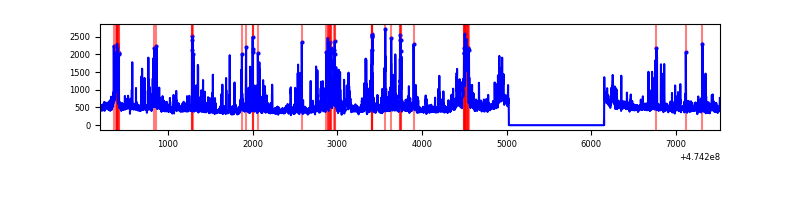 |
| C | 7322 | 6198 | 4245 | 4245 | 57.98% | 68.49% | 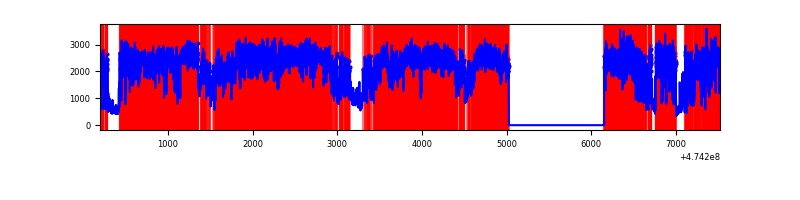 |
| D | 7322 | 6198 | 2690 | 2690 | 36.74% | 43.40% | 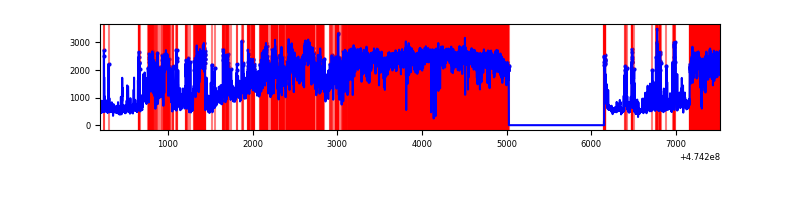 |
Top three noisy pixels from each quadrant. If the there are fewer than three noisy pixels in the level2.evt file, extra rows are filled as -1
| Pixel properties | Quadrant properties | ||||||
|---|---|---|---|---|---|---|---|
| Quadrant | DetID | PixID | Counts | Sigma | Mean | Median | Sigma |
| A | 8 | 38 | 215106 | 1302.26 | 668 | 652 | 164.7 |
| A | 12 | 250 | 140509 | 849.27 | 668 | 652 | 164.7 |
| A | 15 | 174 | 135113 | 816.51 | 668 | 652 | 164.7 |
| B | 5 | 32 | 311348 | 2211.15 | 667 | 646 | 140.5 |
| B | 8 | 128 | 96139 | 679.59 | 667 | 646 | 140.5 |
| B | 10 | 28 | 87646 | 619.15 | 667 | 646 | 140.5 |
| C | 4 | 111 | 6399861 | 69927.76 | 331 | 330 | 91.5 |
| C | 15 | 197 | 3766534 | 41153.36 | 331 | 330 | 91.5 |
| C | 15 | 127 | 1021735 | 11160.91 | 331 | 330 | 91.5 |
| D | 7 | 61 | 4098055 | 27672.96 | 521 | 503 | 148.1 |
| D | 15 | 108 | 1033745 | 6978.03 | 521 | 503 | 148.1 |
| D | 15 | 58 | 770087 | 5197.41 | 521 | 503 | 148.1 |
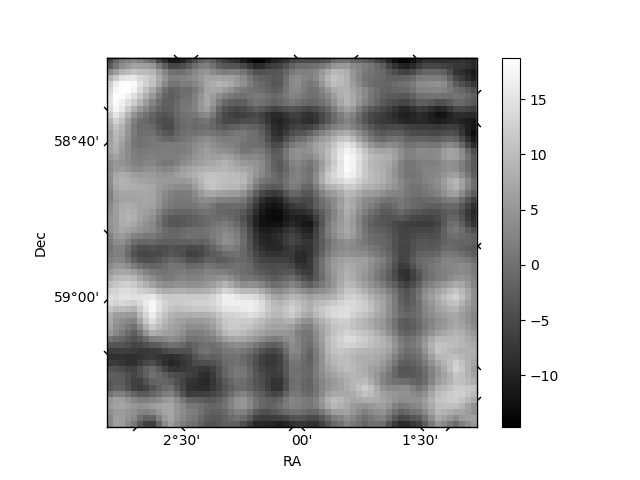
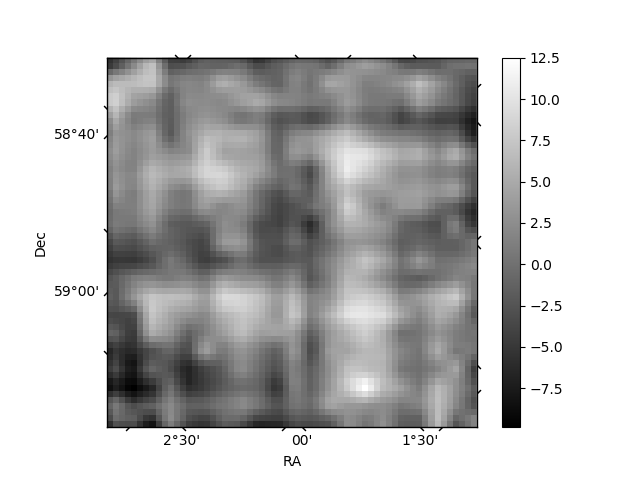
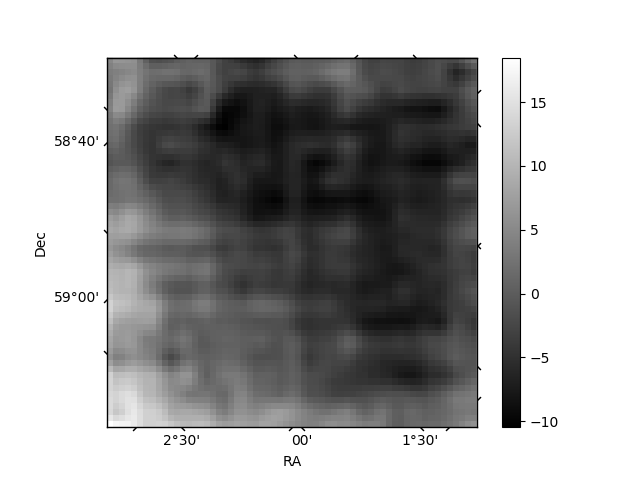
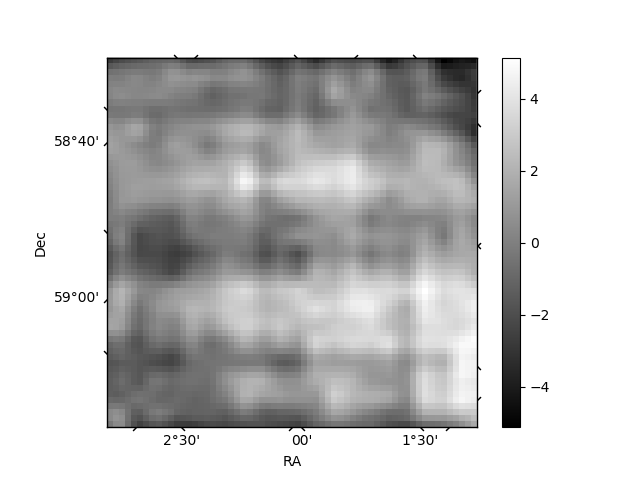
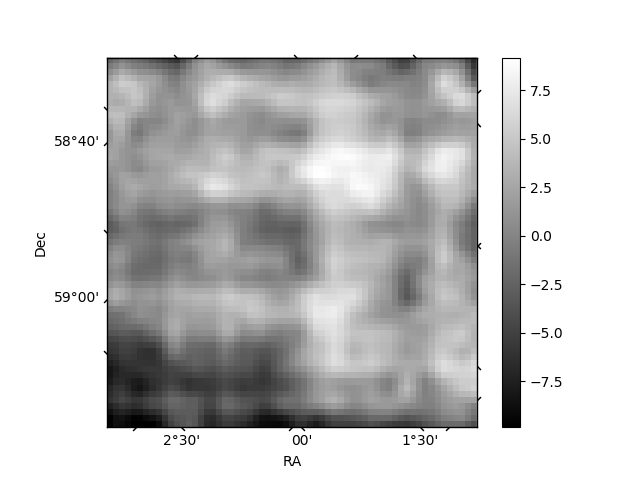
Histogram calculated using DETX and DETY for each event in the final _common_clean file
| Quadrant A | 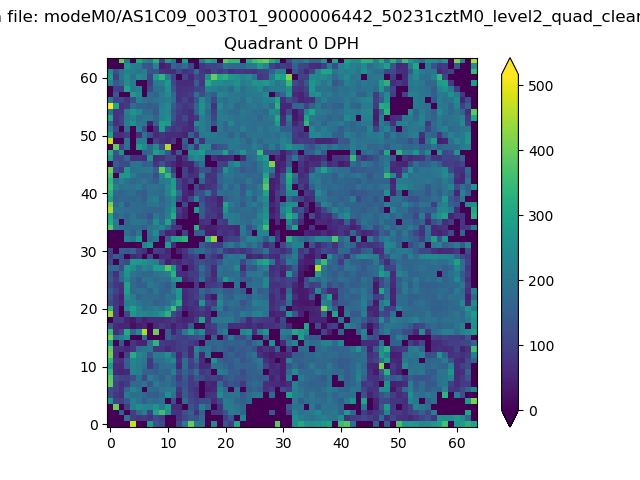 |
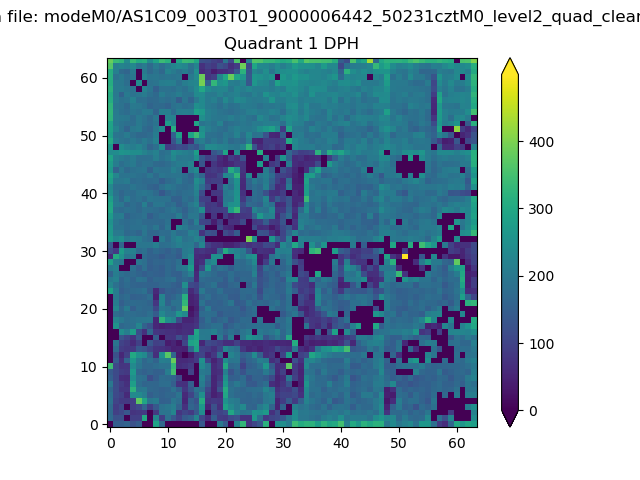 |
Quadrant B |
|---|---|---|---|
| Quadrant D | 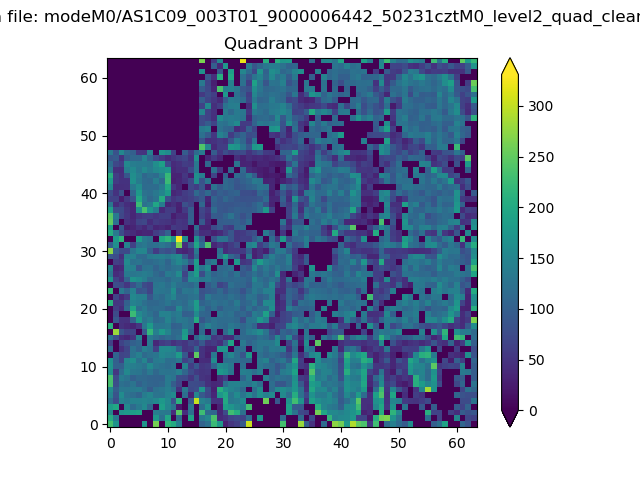 |
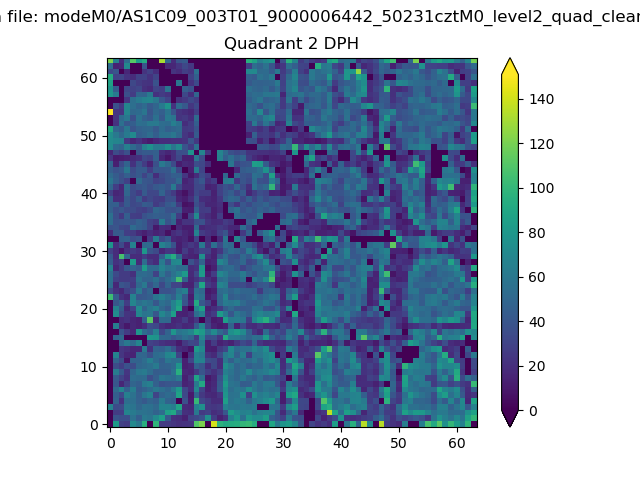 |
Quadrant C |
| Plot type | Count rate plots | Images |
|---|---|---|
| Comparison with Poisson distribution Blue bars denote a histogram of data divided into 1 sec bins. Red curve is a Poisson curve with rate = median count rate of data. |
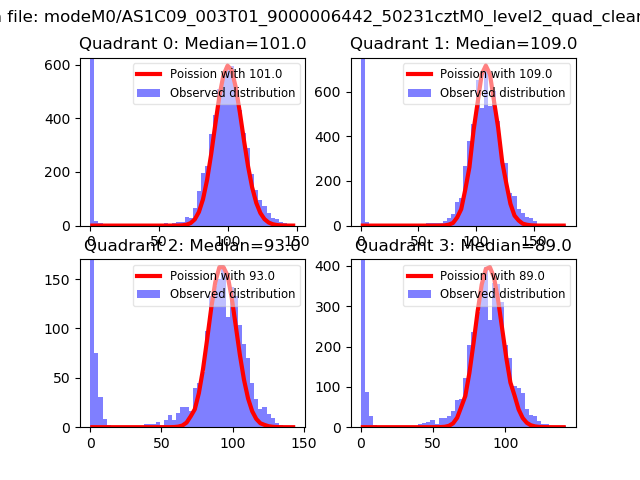 |
 |
| Quadrant-wise count rates Data is divided into 100 sec bins |
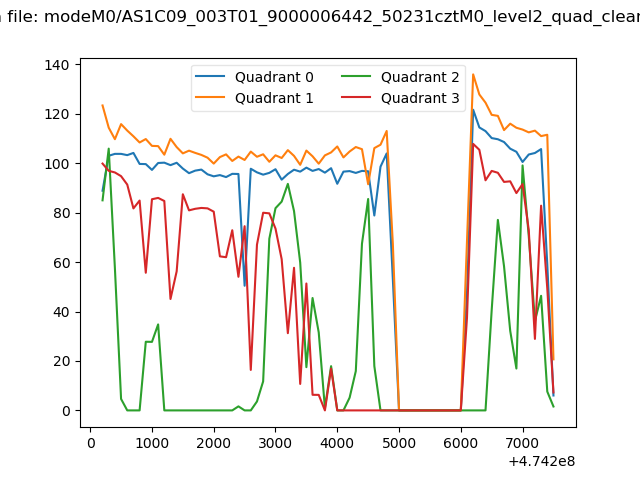 |
|
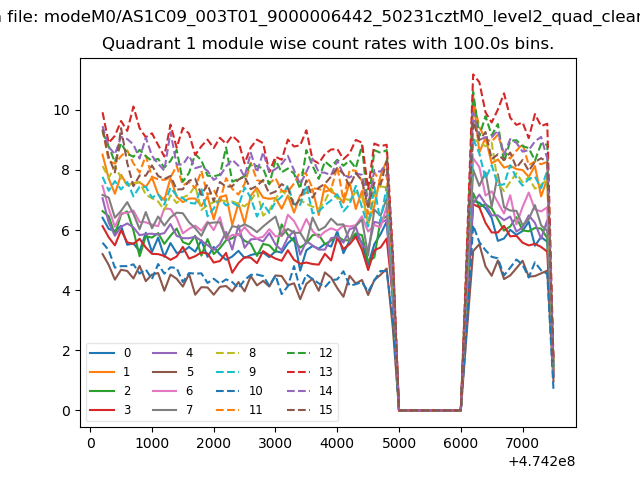
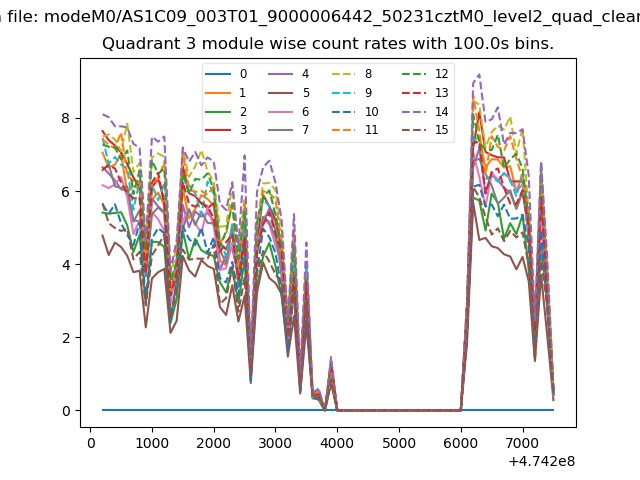
| Module-wise count rates for Quadrant A Data is divided into 100 sec bins |
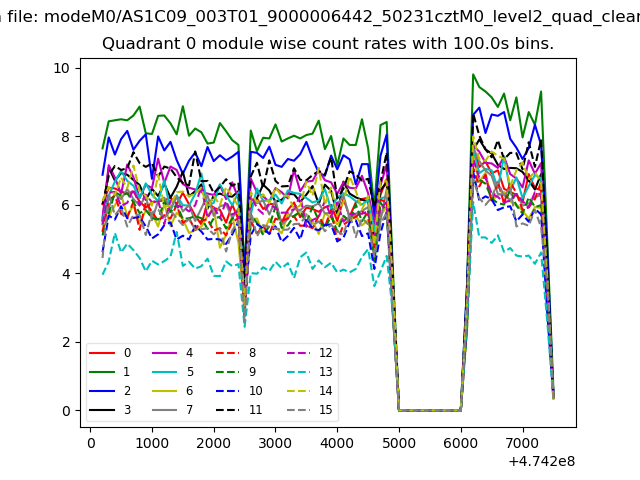 |
 |
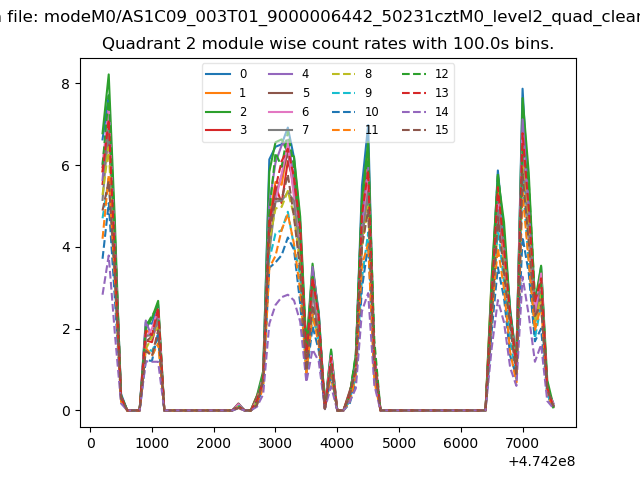
| Module-wise count rates for Quadrant B Data is divided into 100 sec bins |
 |
 |
| Module-wise count rates for Quadrant C Data is divided into 100 sec bins |
 |
 |
| Module-wise count rates for Quadrant D Data is divided into 100 sec bins |
 |
 |
| Parameter | Plot |
|---|---|
| CZT HV Monitor | 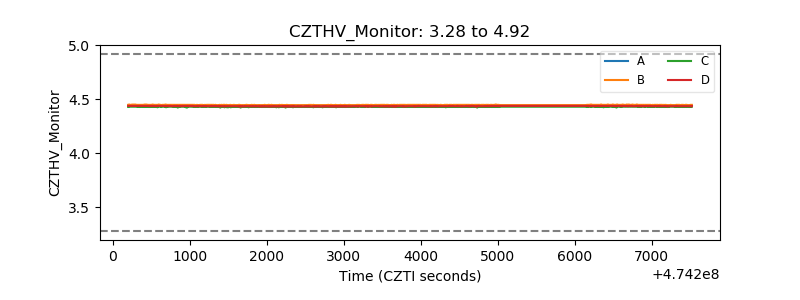 |
| D_VDD | 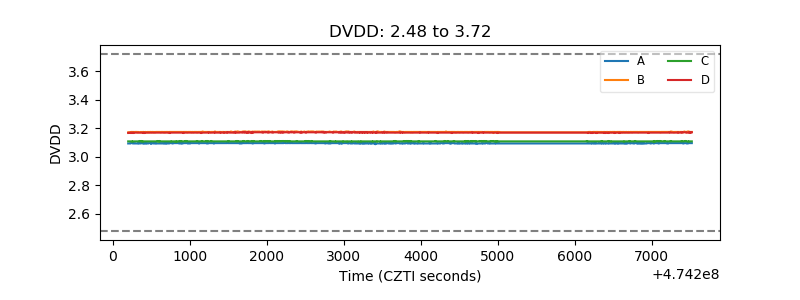 |
| Temperature 1 |  |
| Veto HV Monitor | 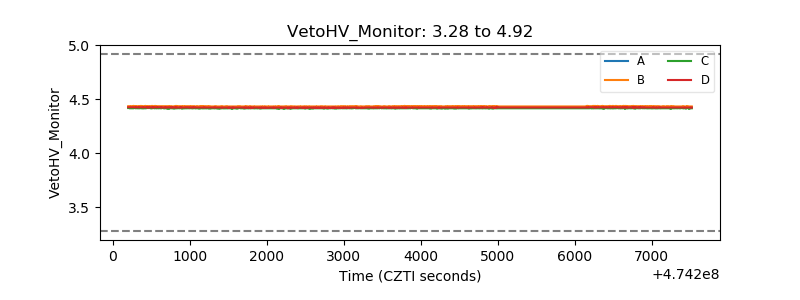 |
| Veto LLD | 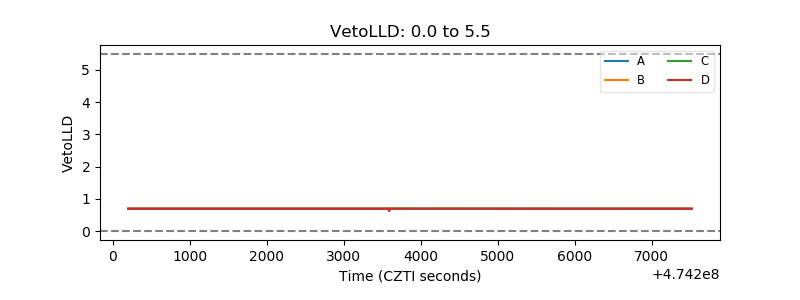 |
| Alpha Counter | 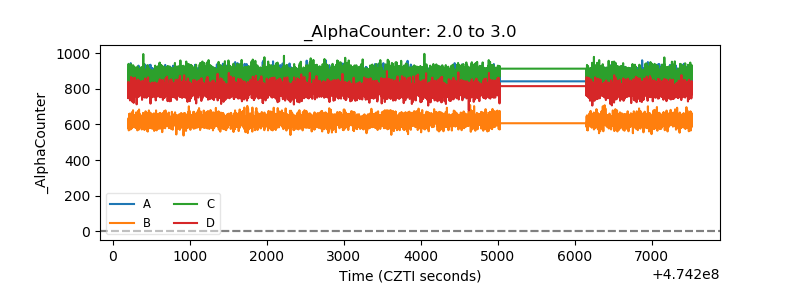 |
| _CPM_Rate | 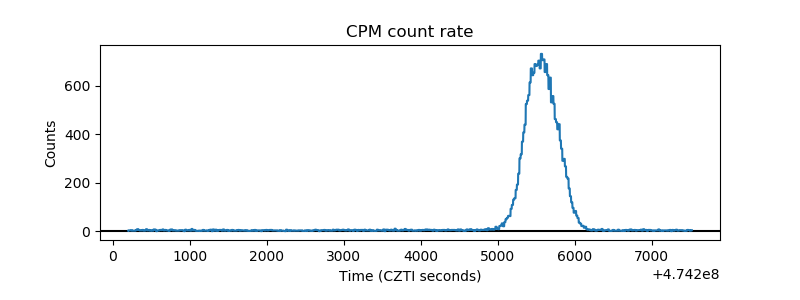 |
| CZT Counter | 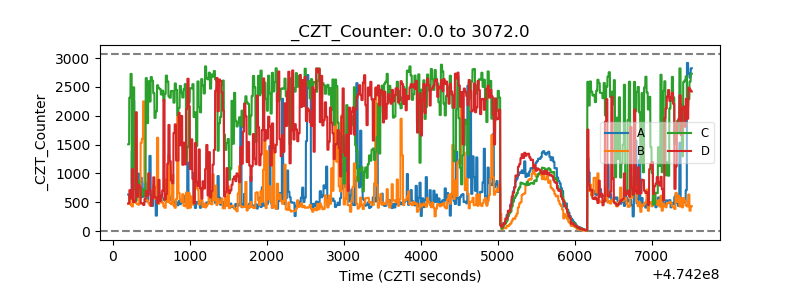 |
| +2.5 Volts monitor |  |
| +5 Volts monitor |  |
| _ROLL_ROT | 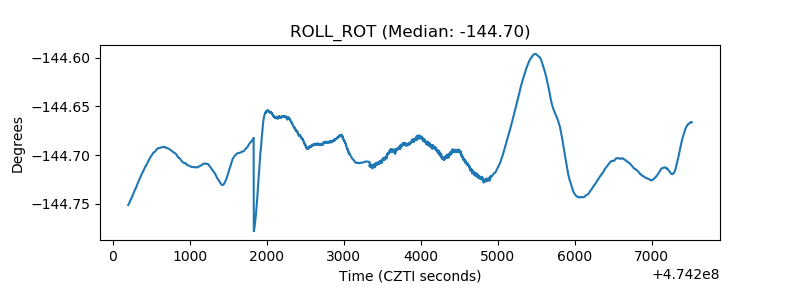 |
| _Roll_DEC | 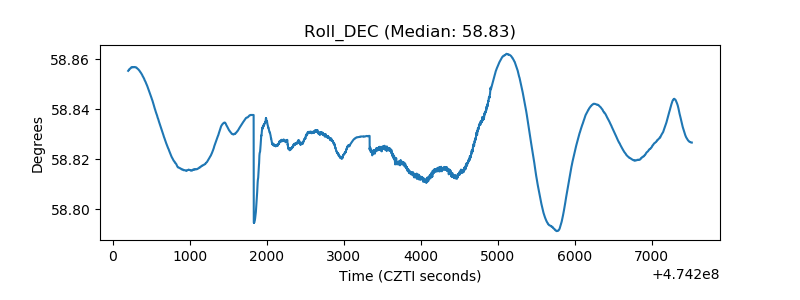 |
| _Roll_RA | 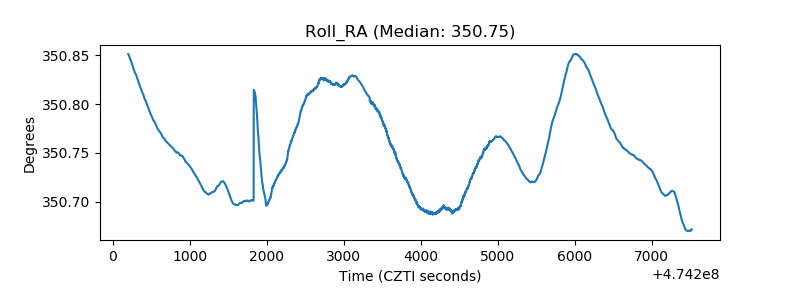 |
| Veto Counter | 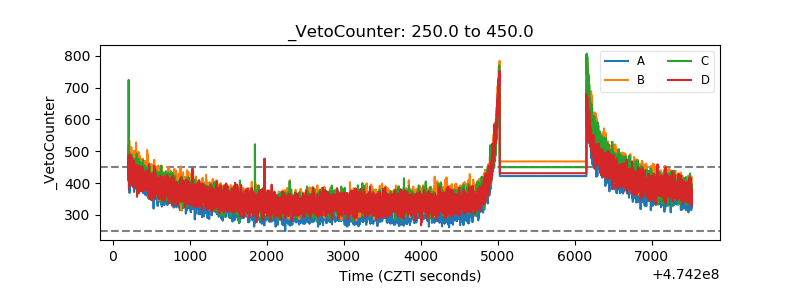 |