| Param | Original file | Final file |
|---|---|---|
| Filename | modeM0/AS1C09_003T01_9000006442_50232cztM0_level2.fits | modeM0/AS1C09_003T01_9000006442_50232cztM0_level2_quad_clean.evt |
| Size (bytes) | 921,185,280 | 75,435,840 |
| Size | 878.5 MB | 71.9 MB |
| Events in quadrant A | 4,755,545 | 605,959 |
| Events in quadrant B | 3,463,939 | 689,580 |
| Events in quadrant C | 13,916,258 | 211,401 |
| Events in quadrant D | 11,466,576 | 329,233 |
| Mode M9 | |||
|---|---|---|---|
| Quadrant | BADHDUFLAG | Total packets | Discarded packets |
| A | 0 | 12 | 0 |
| B | 0 | 12 | 0 |
| C | 0 | 12 | 0 |
| D | 0 | 12 | 0 |
| Mode M0 | |||
|---|---|---|---|
| Quadrant | BADHDUFLAG | Total packets | Discarded packets |
| A | 0 | 18281 | 1 |
| B | 0 | 14722 | 1 |
| C | 0 | 45714 | 1 |
| D | 0 | 38393 | 6 |
| Mode SS | |||
|---|---|---|---|
| Quadrant | BADHDUFLAG | Total packets | Discarded packets |
| A | 0 | 128 | 0 |
| B | 0 | 128 | 0 |
| C | 0 | 128 | 0 |
| D | 0 | 128 | 0 |
| Quadrant | Total seconds | Saturated seconds | Saturation percentage |
|---|---|---|---|
| A | 6423 | 497 | 7.737817% |
| B | 6423 | 145 | 2.257512% |
| C | 6424 | 4510 | 70.205479% |
| D | 6423 | 3091 | 48.123930% |
Noise dominated data is calculated using 1-second bins in cleaned event files. If a bin has >2000 counts, and if more than 50% of those come from <1% of pixels, then it is considered to be noise-dominated and hence unusable.
| Quadrant | # 1 sec bins | Bins with >0 counts | Bins with >2000 counts | High rate bins dominated by noise | Noise dominated (total time) | Noise dominated (detector-on time) | Marked lightcurve |
|---|---|---|---|---|---|---|---|
| A | 7548 | 6424 | 345 | 345 | 4.57% | 5.37% | 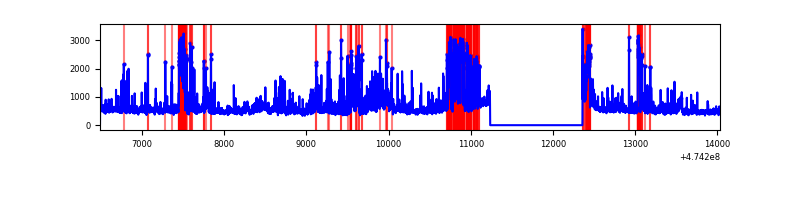 |
| B | 7548 | 6424 | 63 | 63 | 0.83% | 0.98% | 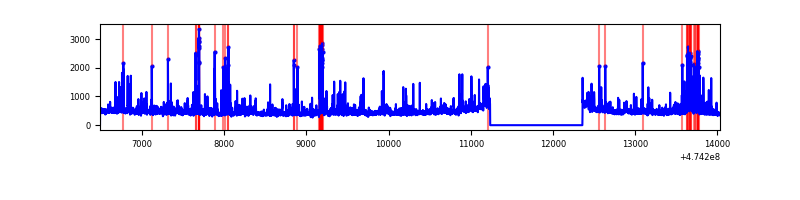 |
| C | 7549 | 6425 | 4502 | 4502 | 59.64% | 70.07% | 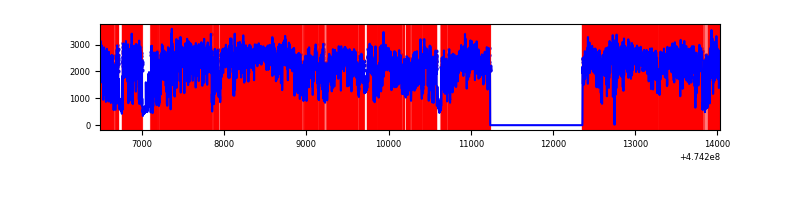 |
| D | 7548 | 6424 | 3416 | 3416 | 45.26% | 53.18% | 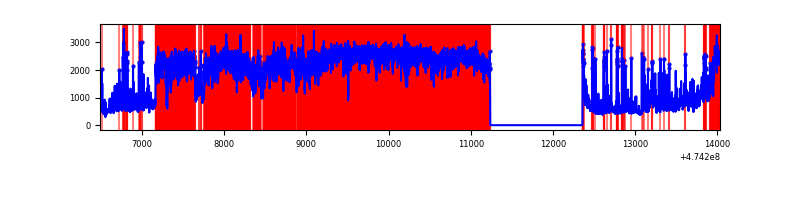 |
Top three noisy pixels from each quadrant. If the there are fewer than three noisy pixels in the level2.evt file, extra rows are filled as -1
| Pixel properties | Quadrant properties | ||||||
|---|---|---|---|---|---|---|---|
| Quadrant | DetID | PixID | Counts | Sigma | Mean | Median | Sigma |
| A | 0 | 98 | 466317 | 2691.59 | 686 | 669 | 173.0 |
| A | 8 | 38 | 288287 | 1662.52 | 686 | 669 | 173.0 |
| A | 8 | 8 | 187144 | 1077.88 | 686 | 669 | 173.0 |
| B | 5 | 32 | 117628 | 799.02 | 691 | 668 | 146.4 |
| B | 0 | 213 | 90904 | 616.45 | 691 | 668 | 146.4 |
| B | 7 | 252 | 59270 | 400.34 | 691 | 668 | 146.4 |
| C | 4 | 111 | 4148133 | 33560.37 | 440 | 437 | 123.6 |
| C | 15 | 197 | 2648725 | 21428.17 | 440 | 437 | 123.6 |
| C | 15 | 127 | 2527206 | 20444.92 | 440 | 437 | 123.6 |
| D | 7 | 61 | 5425508 | 36865.38 | 512 | 492 | 147.2 |
| D | 15 | 108 | 1466014 | 9958.87 | 512 | 492 | 147.2 |
| D | 3 | 12 | 754099 | 5121.09 | 512 | 492 | 147.2 |
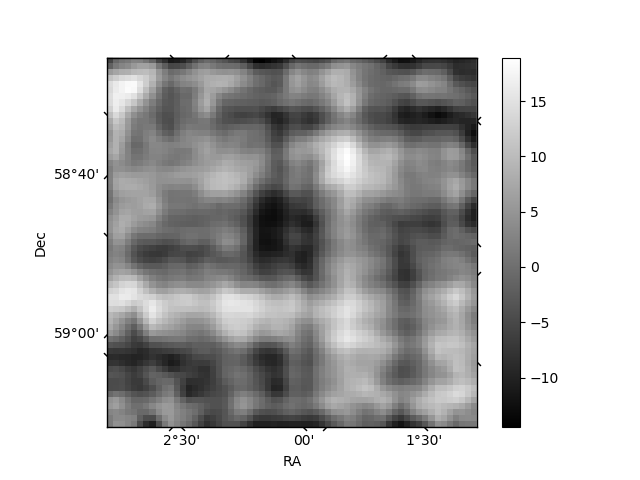
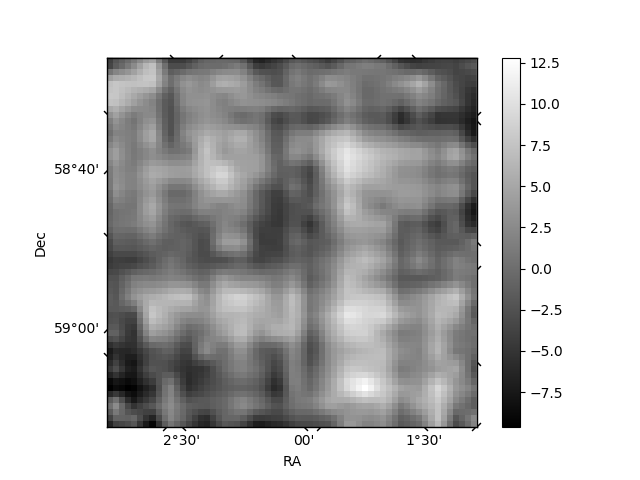
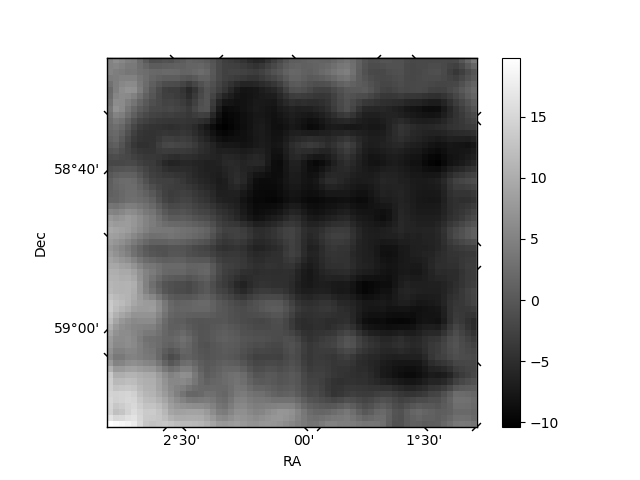
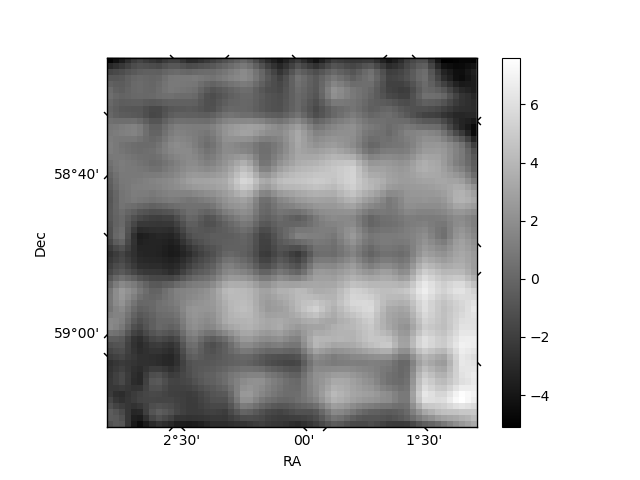
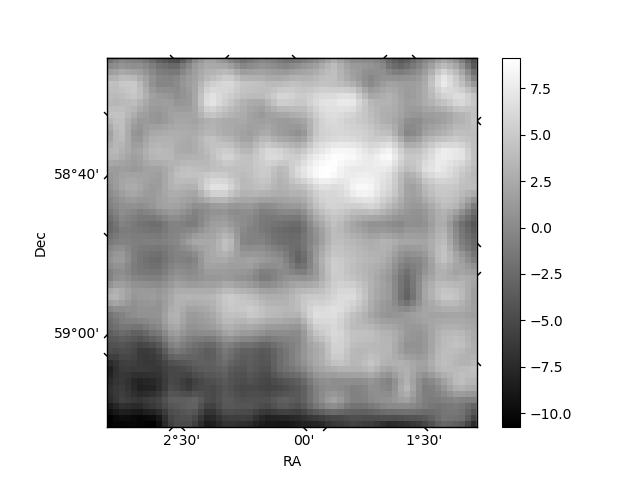
Histogram calculated using DETX and DETY for each event in the final _common_clean file
| Quadrant A | 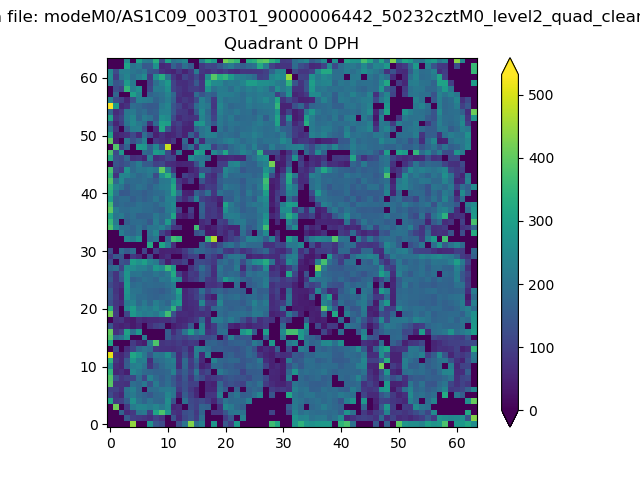 |
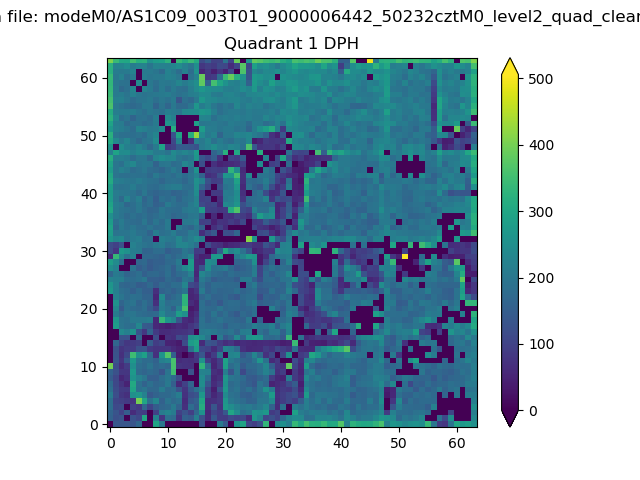 |
Quadrant B |
|---|---|---|---|
| Quadrant D | 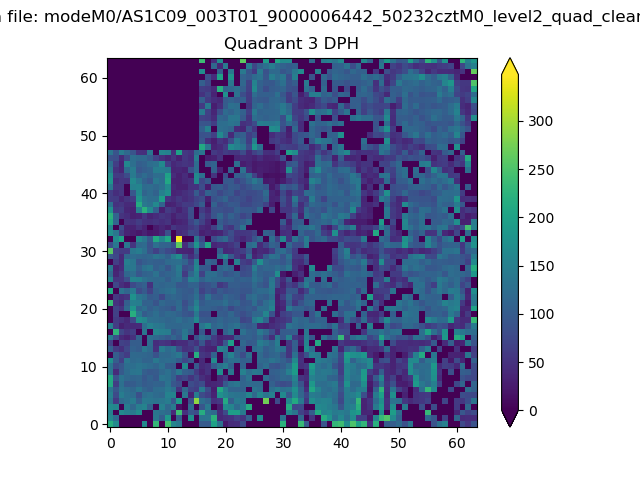 |
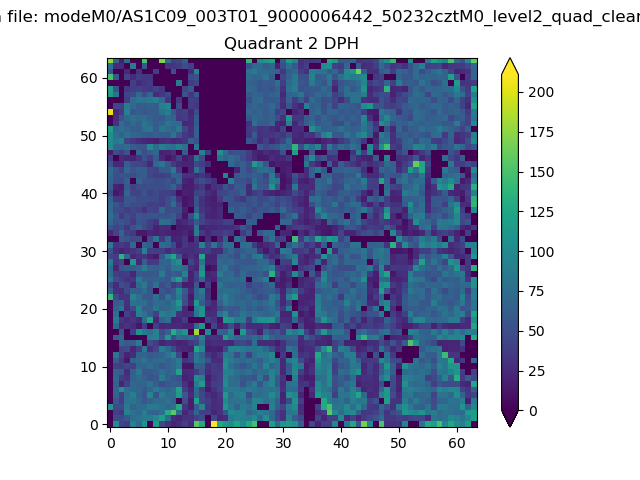 |
Quadrant C |
| Plot type | Count rate plots | Images |
|---|---|---|
| Comparison with Poisson distribution Blue bars denote a histogram of data divided into 1 sec bins. Red curve is a Poisson curve with rate = median count rate of data. |
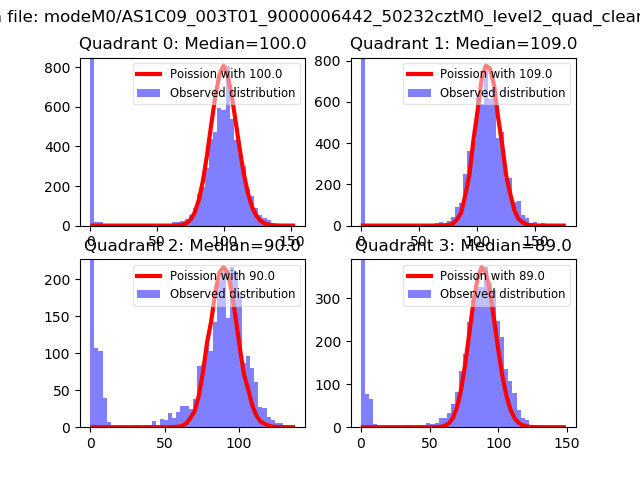 |
 |
| Quadrant-wise count rates Data is divided into 100 sec bins |
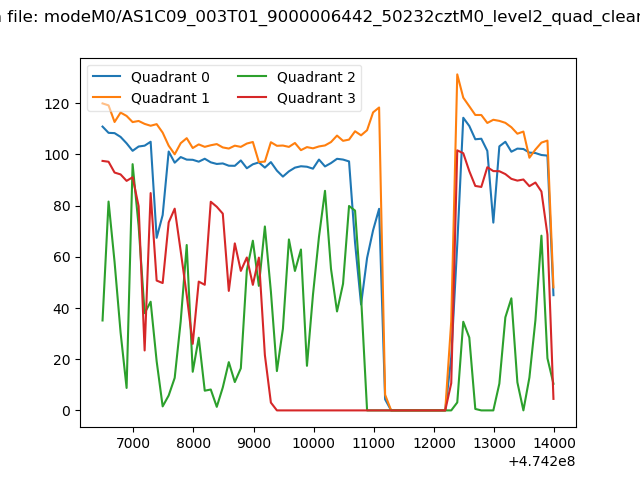 |
|
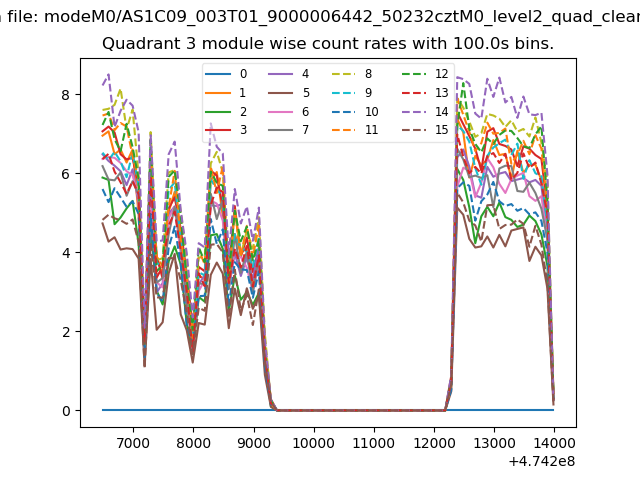
| Module-wise count rates for Quadrant A Data is divided into 100 sec bins |
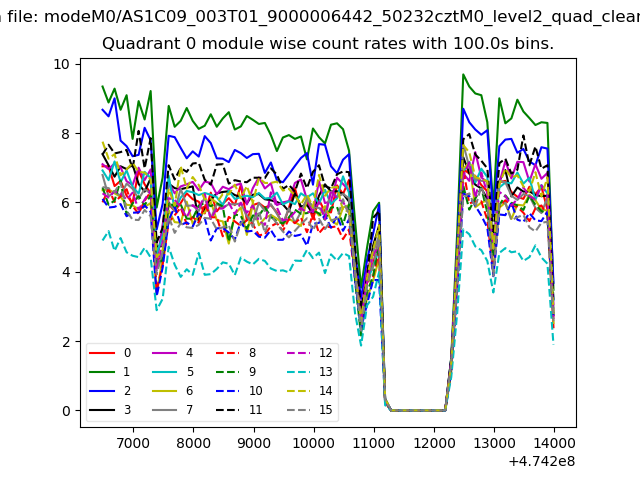 |
 |
| Module-wise count rates for Quadrant B Data is divided into 100 sec bins |
 |
 |
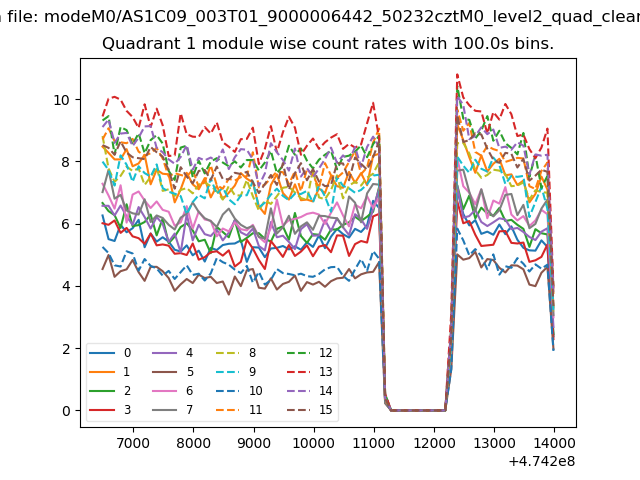
| Module-wise count rates for Quadrant C Data is divided into 100 sec bins |
 |
 |
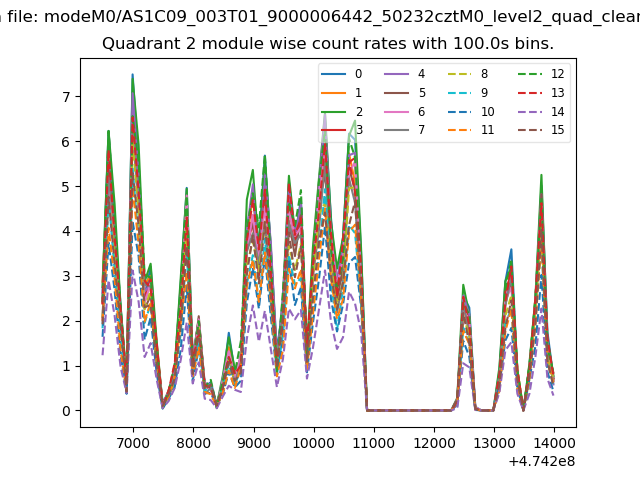
| Module-wise count rates for Quadrant D Data is divided into 100 sec bins |
 |
 |
| Parameter | Plot |
|---|---|
| CZT HV Monitor | 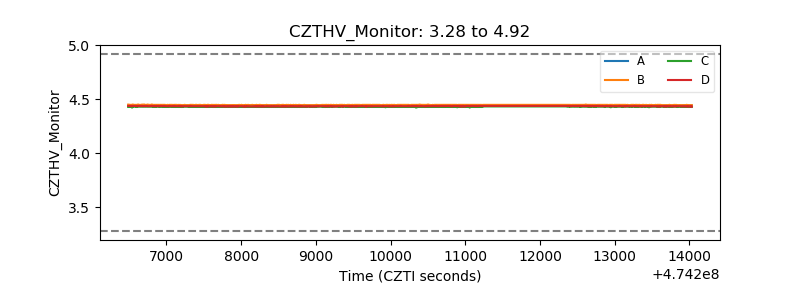 |
| D_VDD | 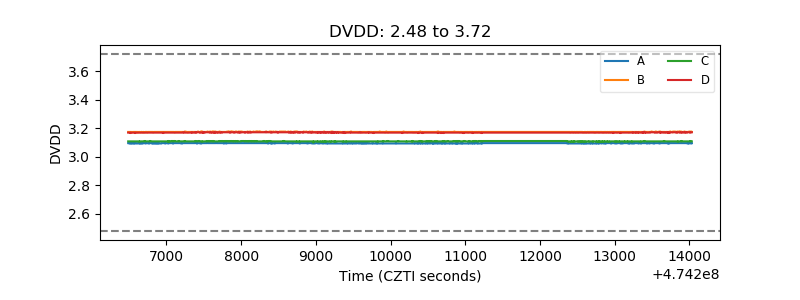 |
| Temperature 1 | 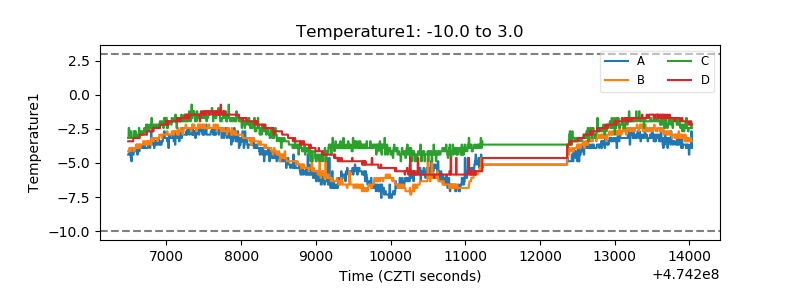 |
| Veto HV Monitor | 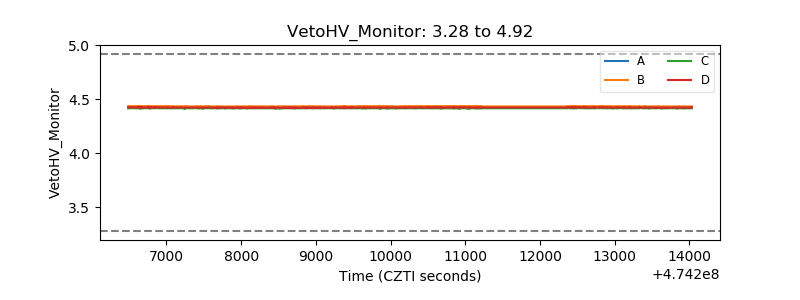 |
| Veto LLD | 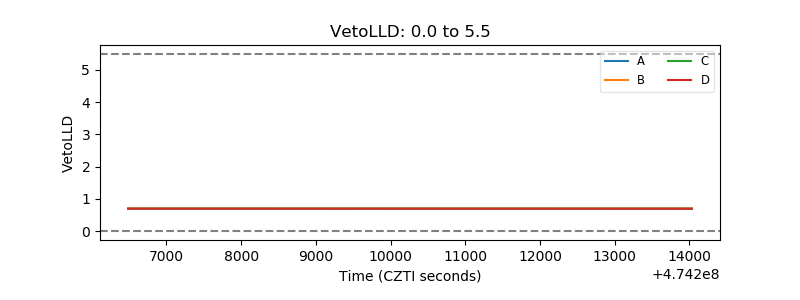 |
| Alpha Counter | 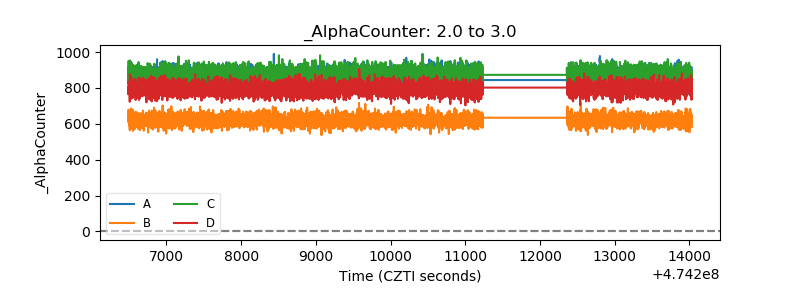 |
| _CPM_Rate | 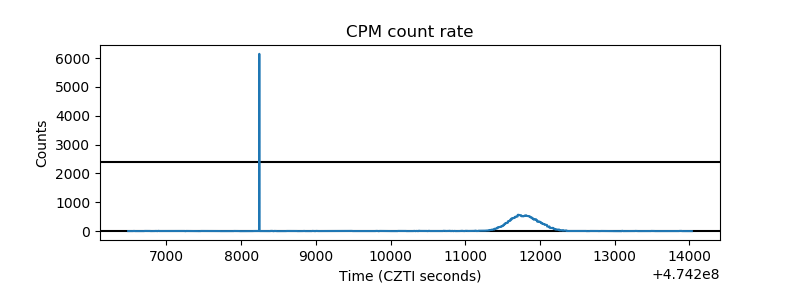 |
| CZT Counter | 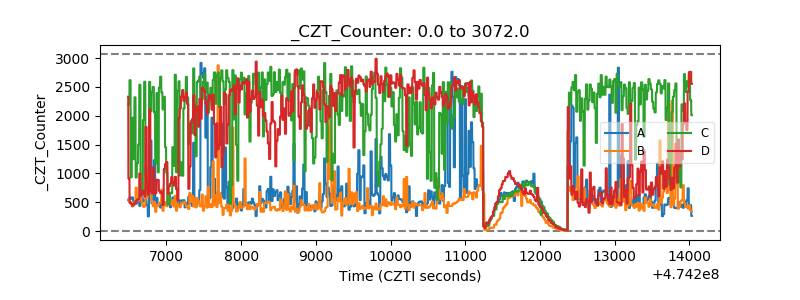 |
| +2.5 Volts monitor |  |
| +5 Volts monitor | 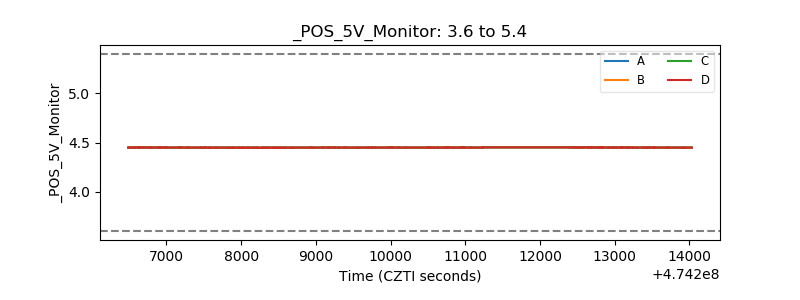 |
| _ROLL_ROT | 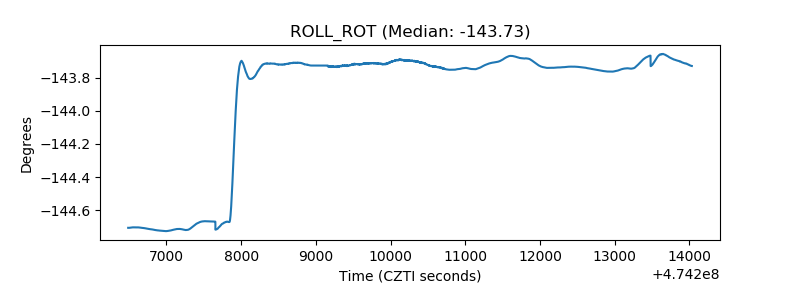 |
| _Roll_DEC | 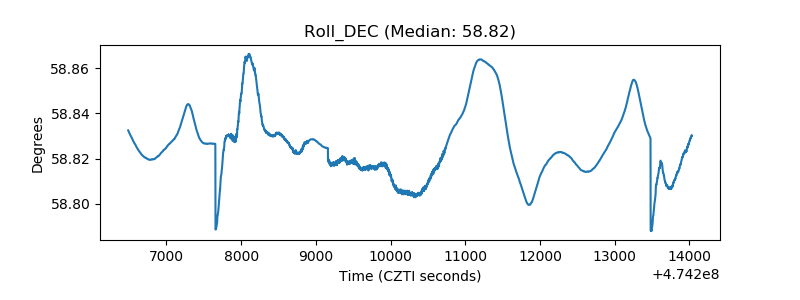 |
| _Roll_RA | 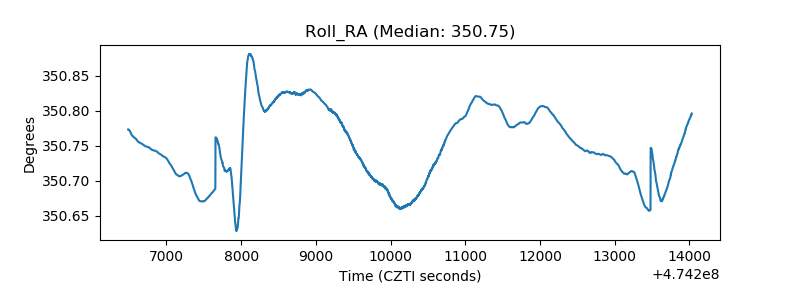 |
| Veto Counter | 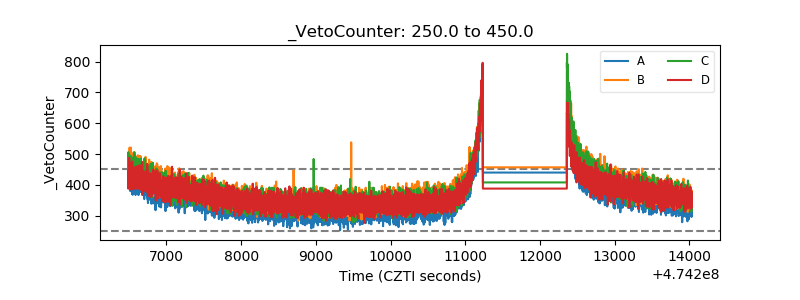 |