| Param | Original file | Final file |
|---|---|---|
| Filename | modeM0/AS1C09_003T01_9000006442_50233cztM0_level2.fits | modeM0/AS1C09_003T01_9000006442_50233cztM0_level2_quad_clean.evt |
| Size (bytes) | 992,819,520 | 66,211,200 |
| Size | 946.8 MB | 63.1 MB |
| Events in quadrant A | 5,906,972 | 550,117 |
| Events in quadrant B | 3,352,435 | 683,996 |
| Events in quadrant C | 14,013,167 | 96,630 |
| Events in quadrant D | 12,977,391 | 222,555 |
| Mode M9 | |||
|---|---|---|---|
| Quadrant | BADHDUFLAG | Total packets | Discarded packets |
| A | 0 | 11 | 0 |
| B | 0 | 11 | 0 |
| C | 0 | 11 | 0 |
| D | 0 | 11 | 0 |
| Mode M0 | |||
|---|---|---|---|
| Quadrant | BADHDUFLAG | Total packets | Discarded packets |
| A | 0 | 21965 | 1 |
| B | 0 | 14483 | 1 |
| C | 0 | 46012 | 3 |
| D | 0 | 42953 | 1 |
| Mode SS | |||
|---|---|---|---|
| Quadrant | BADHDUFLAG | Total packets | Discarded packets |
| A | 0 | 130 | 0 |
| B | 0 | 130 | 0 |
| C | 0 | 130 | 0 |
| D | 0 | 130 | 0 |
| Quadrant | Total seconds | Saturated seconds | Saturation percentage |
|---|---|---|---|
| A | 6473 | 997 | 15.402441% |
| B | 6473 | 108 | 1.668469% |
| C | 6472 | 5544 | 85.661310% |
| D | 6472 | 4117 | 63.612485% |
Noise dominated data is calculated using 1-second bins in cleaned event files. If a bin has >2000 counts, and if more than 50% of those come from <1% of pixels, then it is considered to be noise-dominated and hence unusable.
| Quadrant | # 1 sec bins | Bins with >0 counts | Bins with >2000 counts | High rate bins dominated by noise | Noise dominated (total time) | Noise dominated (detector-on time) | Marked lightcurve |
|---|---|---|---|---|---|---|---|
| A | 7523 | 6474 | 836 | 836 | 11.11% | 12.91% | 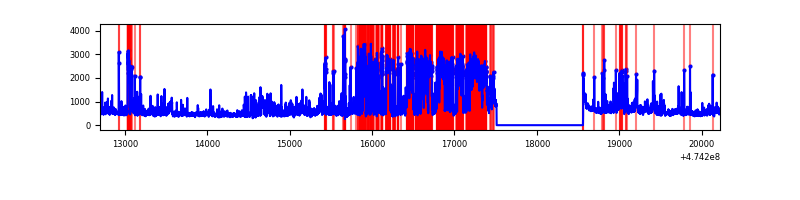 |
| B | 7523 | 6474 | 38 | 38 | 0.51% | 0.59% | 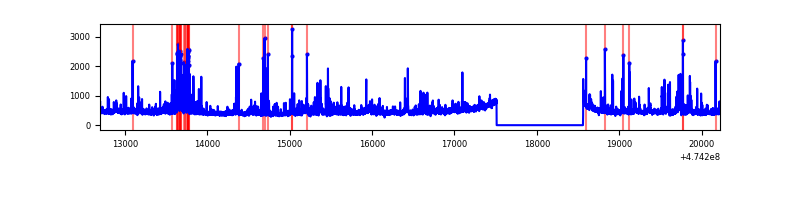 |
| C | 7522 | 6473 | 4334 | 4334 | 57.62% | 66.96% | 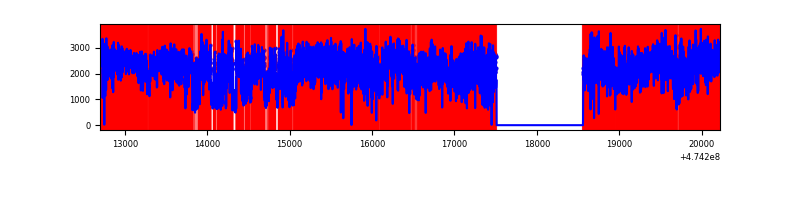 |
| D | 7522 | 6473 | 4147 | 4147 | 55.13% | 64.07% | 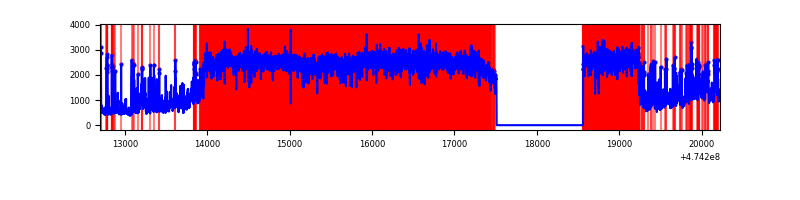 |
Top three noisy pixels from each quadrant. If the there are fewer than three noisy pixels in the level2.evt file, extra rows are filled as -1
| Pixel properties | Quadrant properties | ||||||
|---|---|---|---|---|---|---|---|
| Quadrant | DetID | PixID | Counts | Sigma | Mean | Median | Sigma |
| A | 0 | 98 | 1848696 | 11364.07 | 656 | 639 | 162.6 |
| A | 10 | 253 | 323549 | 1985.64 | 656 | 639 | 162.6 |
| A | 11 | 7 | 193820 | 1187.91 | 656 | 639 | 162.6 |
| B | 5 | 32 | 118688 | 813.56 | 693 | 670 | 145.1 |
| B | 10 | 247 | 85058 | 581.73 | 693 | 670 | 145.1 |
| B | 0 | 213 | 57299 | 390.37 | 693 | 670 | 145.1 |
| C | 4 | 111 | 7808512 | 102854.96 | 259 | 257 | 75.9 |
| C | 15 | 213 | 1517523 | 19986.33 | 259 | 257 | 75.9 |
| C | 15 | 127 | 1019462 | 13425.57 | 259 | 257 | 75.9 |
| D | 7 | 61 | 6284963 | 47793.46 | 470 | 455 | 131.5 |
| D | 2 | 165 | 1401959 | 10658.39 | 470 | 455 | 131.5 |
| D | 15 | 108 | 1282639 | 9750.96 | 470 | 455 | 131.5 |
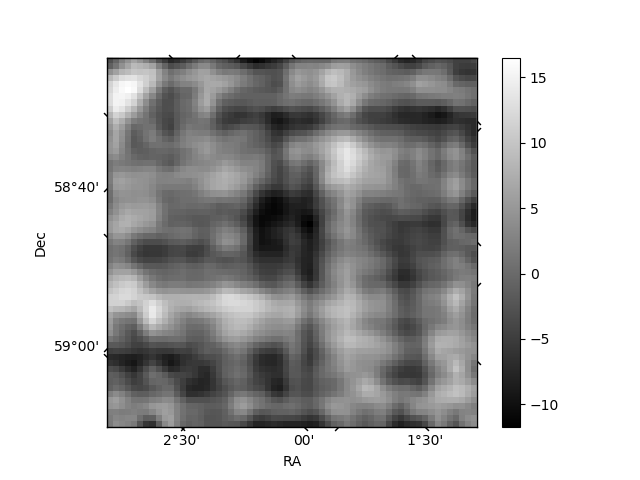
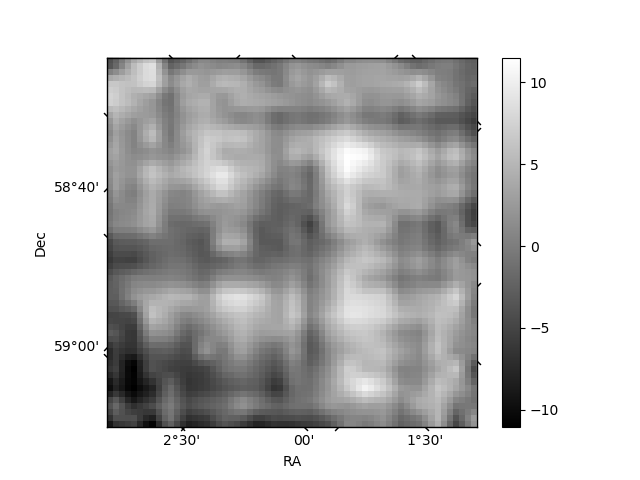
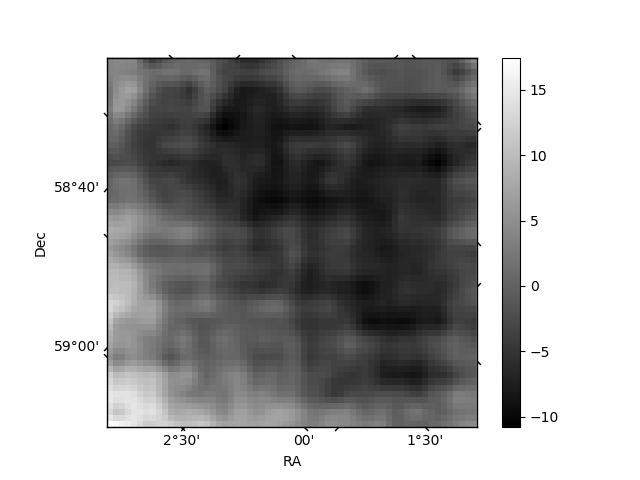
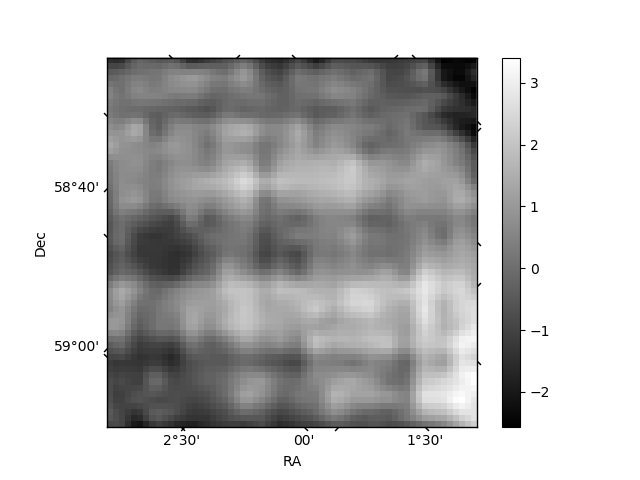
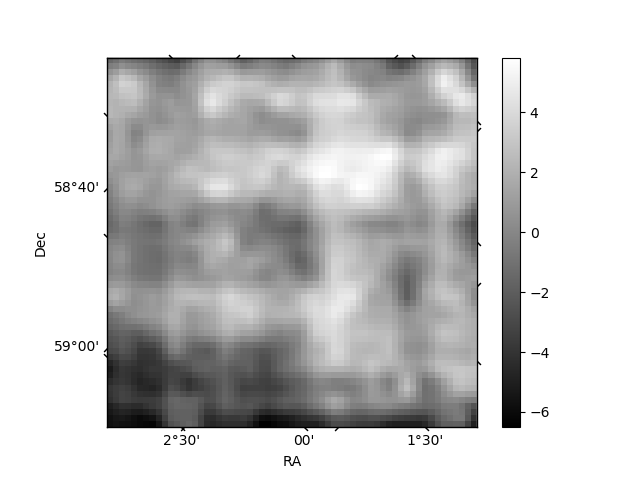
Histogram calculated using DETX and DETY for each event in the final _common_clean file
| Quadrant A | 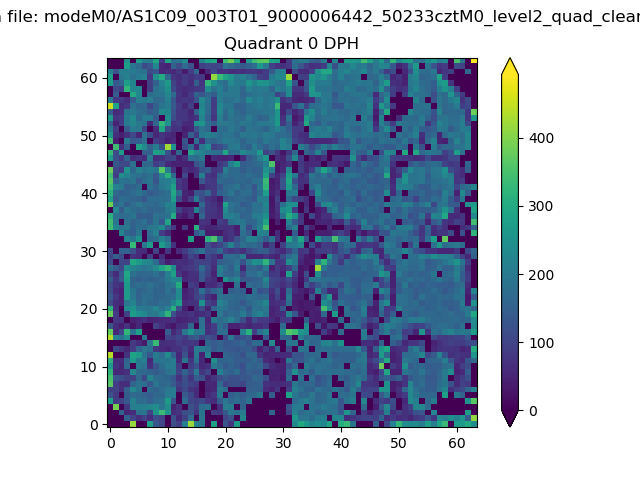 |
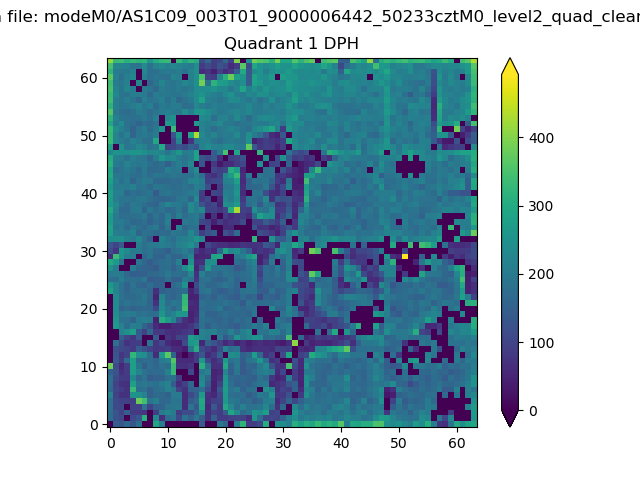 |
Quadrant B |
|---|---|---|---|
| Quadrant D | 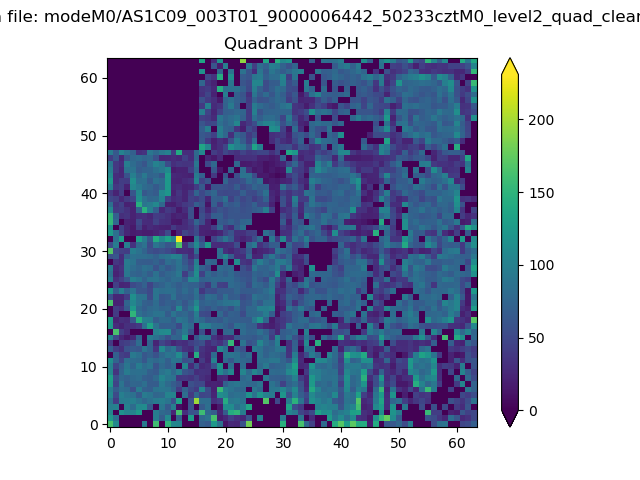 |
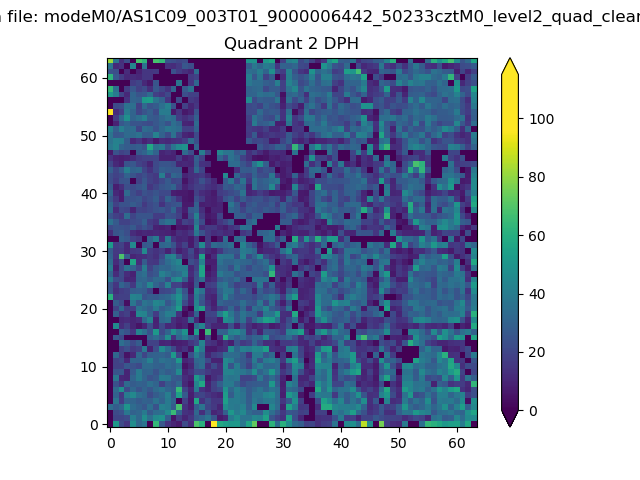 |
Quadrant C |
| Plot type | Count rate plots | Images |
|---|---|---|
| Comparison with Poisson distribution Blue bars denote a histogram of data divided into 1 sec bins. Red curve is a Poisson curve with rate = median count rate of data. |
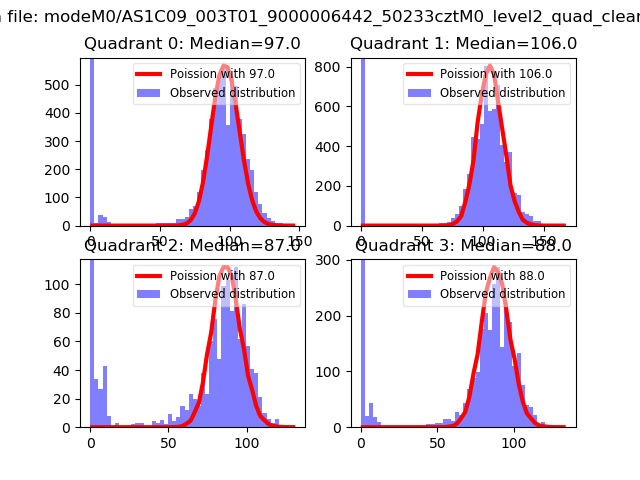 |
 |
| Quadrant-wise count rates Data is divided into 100 sec bins |
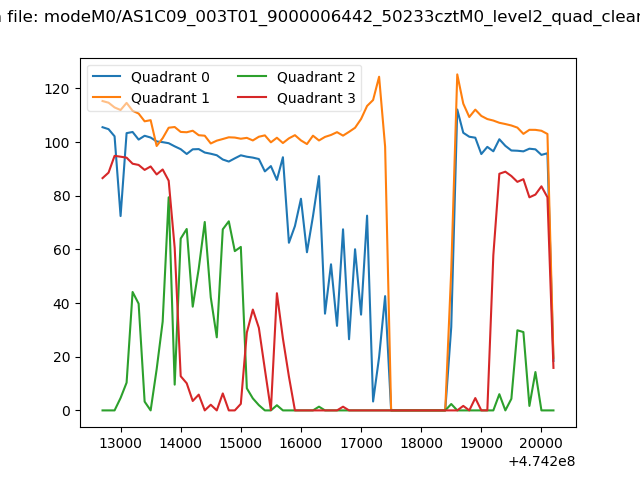 |
|
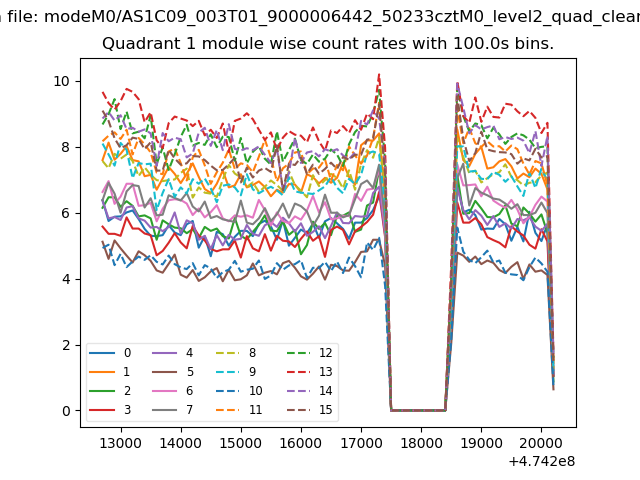
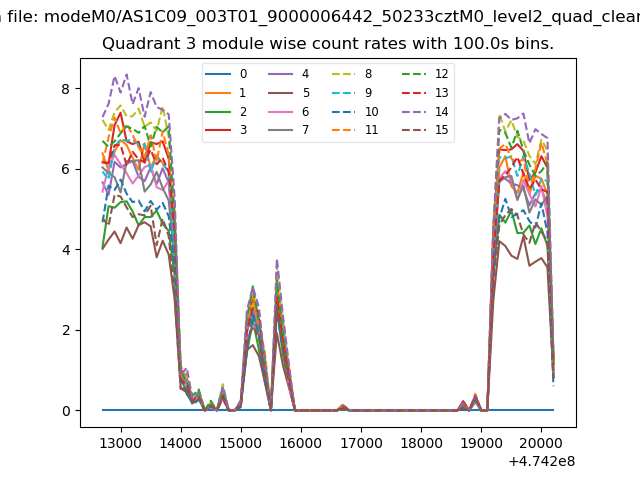
| Module-wise count rates for Quadrant A Data is divided into 100 sec bins |
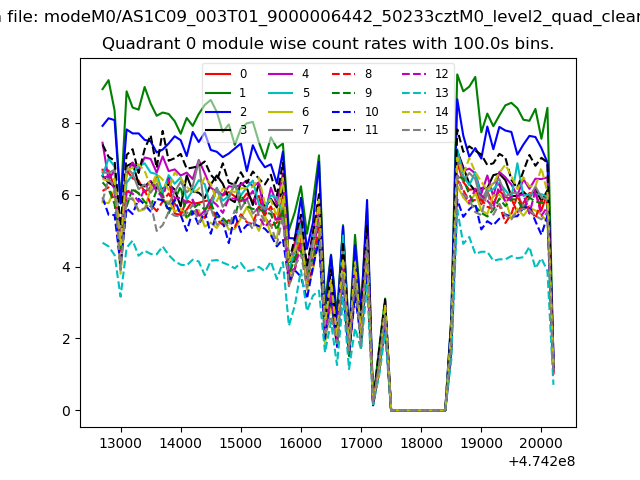 |
 |
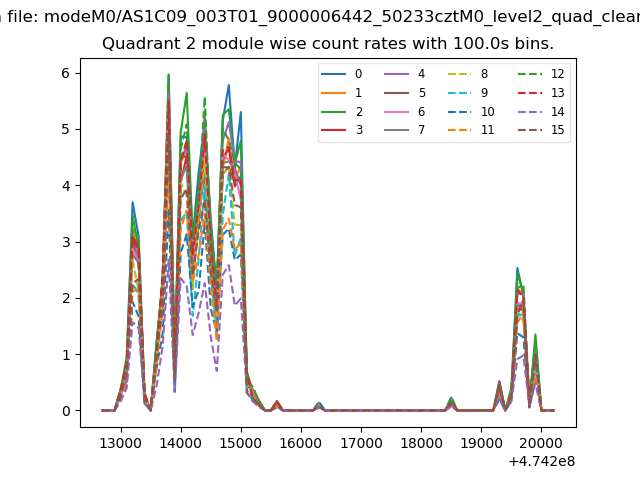
| Module-wise count rates for Quadrant B Data is divided into 100 sec bins |
 |
 |
| Module-wise count rates for Quadrant C Data is divided into 100 sec bins |
 |
 |
| Module-wise count rates for Quadrant D Data is divided into 100 sec bins |
 |
 |
| Parameter | Plot |
|---|---|
| CZT HV Monitor | 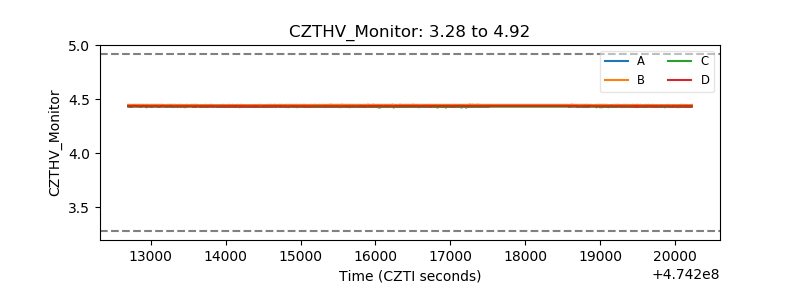 |
| D_VDD | 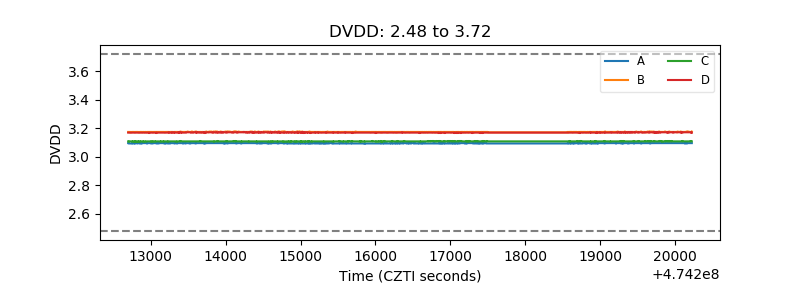 |
| Temperature 1 | 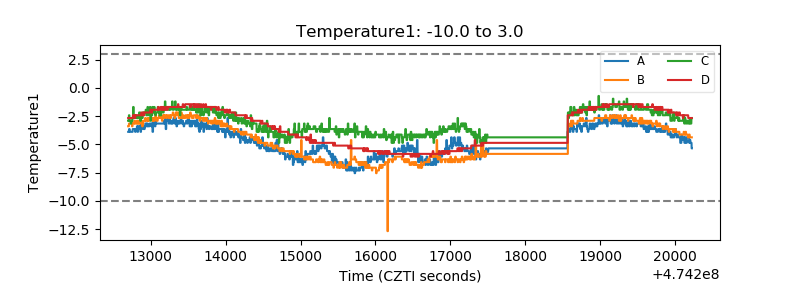 |
| Veto HV Monitor | 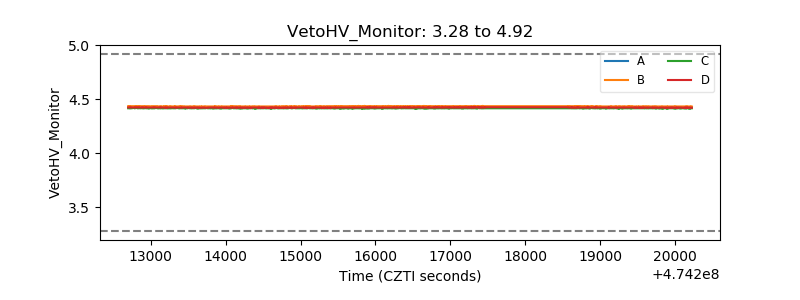 |
| Veto LLD | 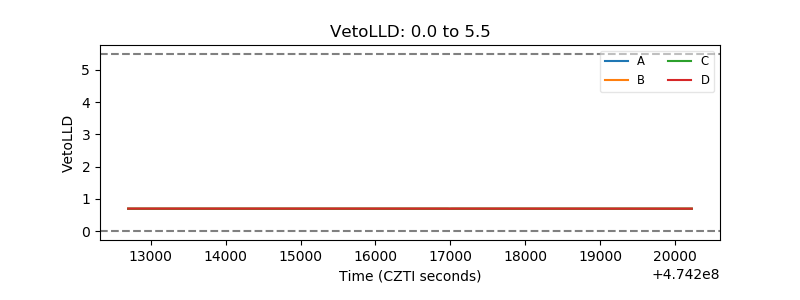 |
| Alpha Counter | 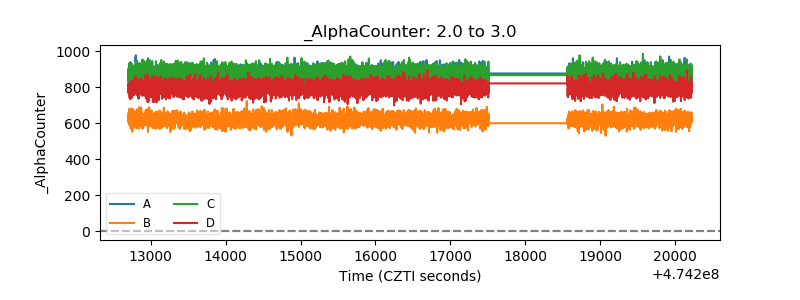 |
| _CPM_Rate | 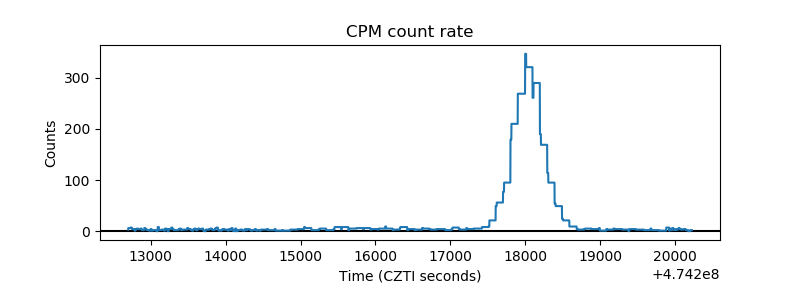 |
| CZT Counter | 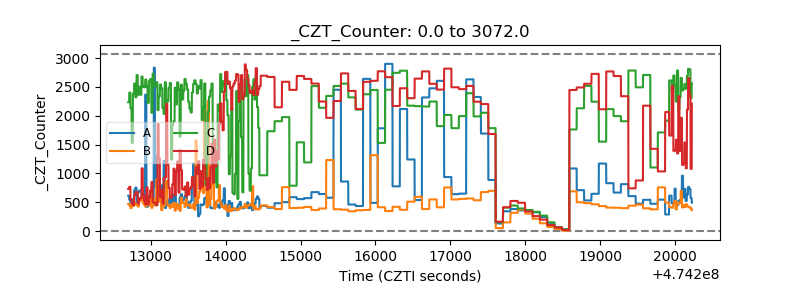 |
| +2.5 Volts monitor |  |
| +5 Volts monitor | 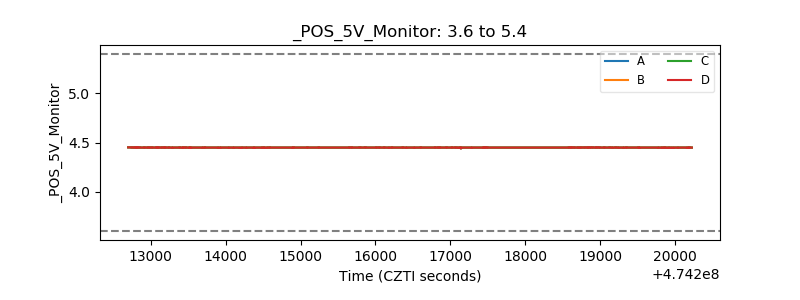 |
| _ROLL_ROT | 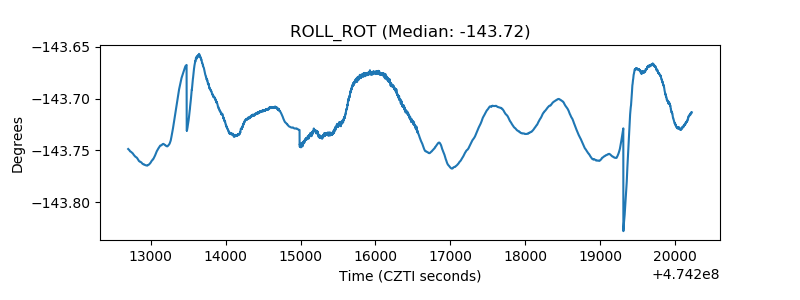 |
| _Roll_DEC | 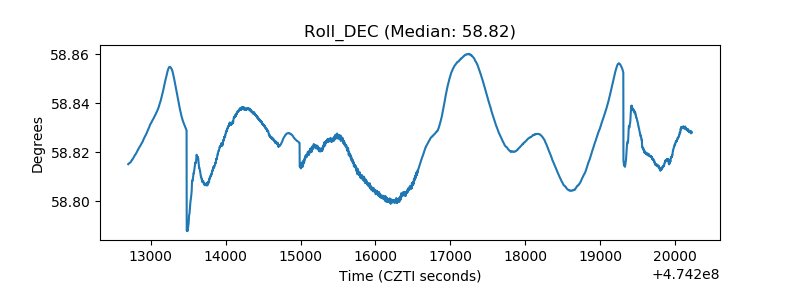 |
| _Roll_RA | 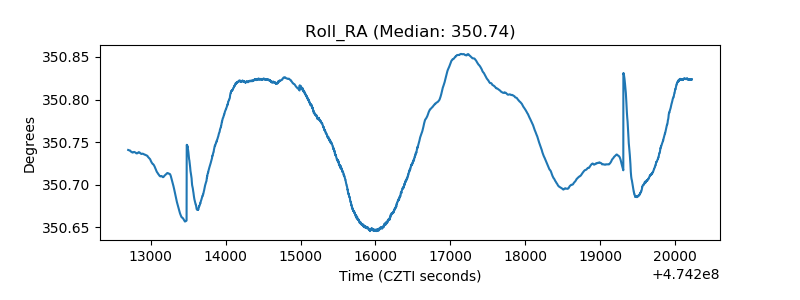 |
| Veto Counter | 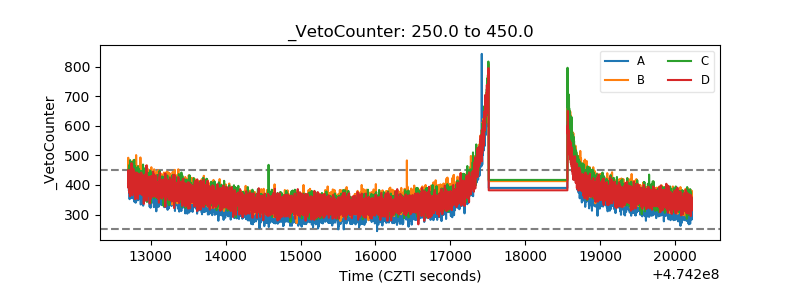 |