| Param | Original file | Final file |
|---|---|---|
| Filename | modeM0/AS1C09_003T01_9000006442_50234cztM0_level2.fits | modeM0/AS1C09_003T01_9000006442_50234cztM0_level2_quad_clean.evt |
| Size (bytes) | 1,017,694,080 | 73,342,080 |
| Size | 970.5 MB | 69.9 MB |
| Events in quadrant A | 6,402,732 | 573,738 |
| Events in quadrant B | 3,713,410 | 696,115 |
| Events in quadrant C | 13,959,137 | 183,677 |
| Events in quadrant D | 13,074,898 | 295,893 |
| Mode M9 | |||
|---|---|---|---|
| Quadrant | BADHDUFLAG | Total packets | Discarded packets |
| A | 0 | 8 | 0 |
| B | 0 | 8 | 0 |
| C | 0 | 8 | 0 |
| D | 0 | 8 | 0 |
| Mode M0 | |||
|---|---|---|---|
| Quadrant | BADHDUFLAG | Total packets | Discarded packets |
| A | 0 | 23656 | 1 |
| B | 0 | 15747 | 1 |
| C | 0 | 46089 | 1 |
| D | 0 | 43490 | 1 |
| Mode SS | |||
|---|---|---|---|
| Quadrant | BADHDUFLAG | Total packets | Discarded packets |
| A | 0 | 138 | 0 |
| B | 0 | 138 | 0 |
| C | 0 | 138 | 0 |
| D | 0 | 138 | 0 |
| Quadrant | Total seconds | Saturated seconds | Saturation percentage |
|---|---|---|---|
| A | 6752 | 935 | 13.847749% |
| B | 6753 | 116 | 1.717755% |
| C | 6753 | 4915 | 72.782467% |
| D | 6753 | 3544 | 52.480379% |
Noise dominated data is calculated using 1-second bins in cleaned event files. If a bin has >2000 counts, and if more than 50% of those come from <1% of pixels, then it is considered to be noise-dominated and hence unusable.
| Quadrant | # 1 sec bins | Bins with >0 counts | Bins with >2000 counts | High rate bins dominated by noise | Noise dominated (total time) | Noise dominated (detector-on time) | Marked lightcurve |
|---|---|---|---|---|---|---|---|
| A | 7627 | 6753 | 774 | 774 | 10.15% | 11.46% | 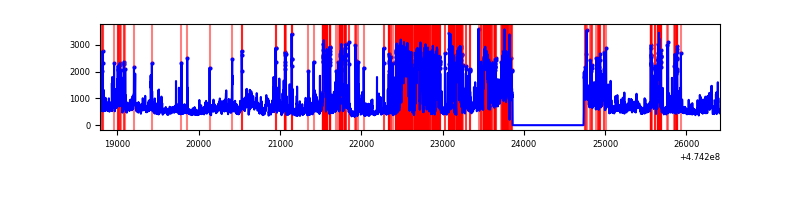 |
| B | 7628 | 6754 | 36 | 36 | 0.47% | 0.53% | 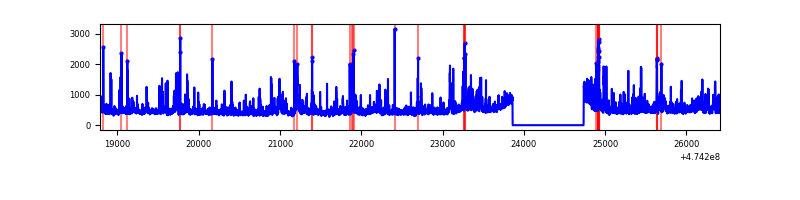 |
| C | 7628 | 6754 | 4119 | 4119 | 54.00% | 60.99% | 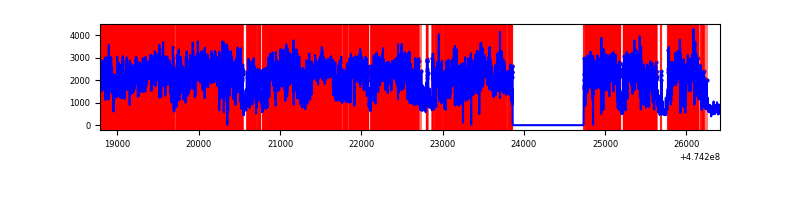 |
| D | 7628 | 6754 | 3650 | 3650 | 47.85% | 54.04% | 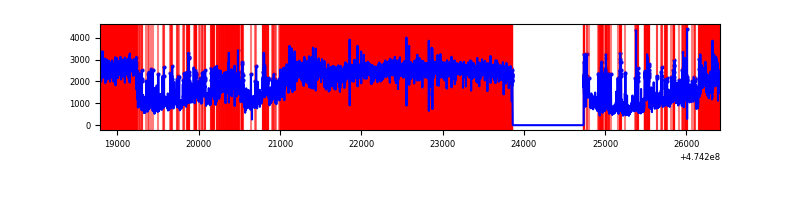 |
Top three noisy pixels from each quadrant. If the there are fewer than three noisy pixels in the level2.evt file, extra rows are filled as -1
| Pixel properties | Quadrant properties | ||||||
|---|---|---|---|---|---|---|---|
| Quadrant | DetID | PixID | Counts | Sigma | Mean | Median | Sigma |
| A | 0 | 98 | 1631976 | 9695.23 | 680 | 659 | 168.3 |
| A | 10 | 253 | 588146 | 3491.55 | 680 | 659 | 168.3 |
| A | 11 | 7 | 416996 | 2474.37 | 680 | 659 | 168.3 |
| B | 10 | 28 | 212803 | 1412.89 | 711 | 687 | 150.1 |
| B | 4 | 216 | 81914 | 541.05 | 711 | 687 | 150.1 |
| B | 0 | 245 | 75855 | 500.69 | 711 | 687 | 150.1 |
| C | 4 | 111 | 7142178 | 65311.68 | 382 | 378 | 109.3 |
| C | 15 | 197 | 1439779 | 13163.3 | 382 | 378 | 109.3 |
| C | 15 | 213 | 676008 | 6178.63 | 382 | 378 | 109.3 |
| D | 7 | 61 | 6222823 | 43361.92 | 504 | 485 | 143.5 |
| D | 15 | 108 | 1087840 | 7577.51 | 504 | 485 | 143.5 |
| D | 2 | 165 | 934281 | 6507.39 | 504 | 485 | 143.5 |
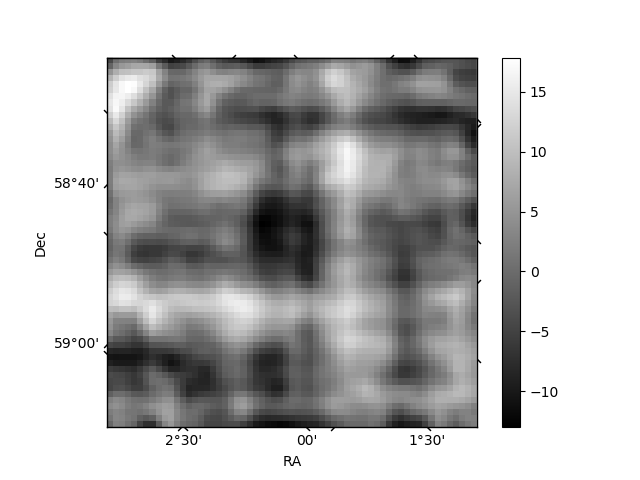
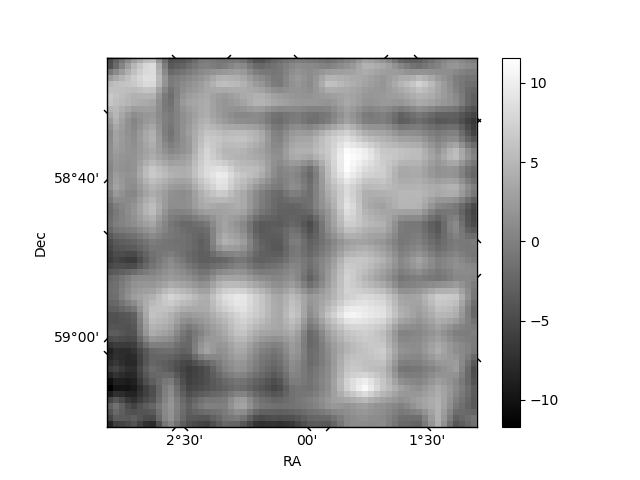
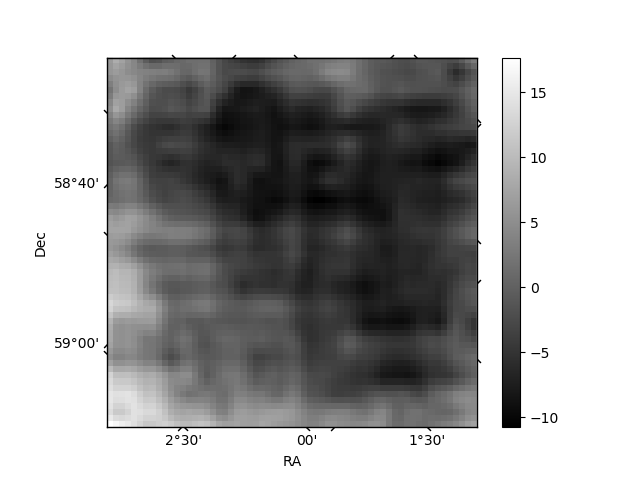
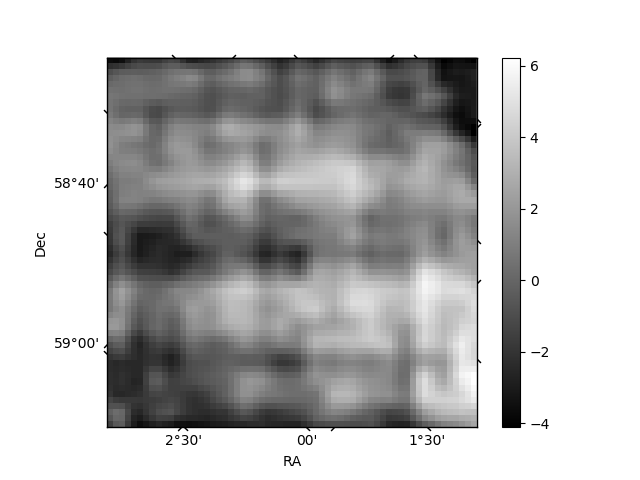
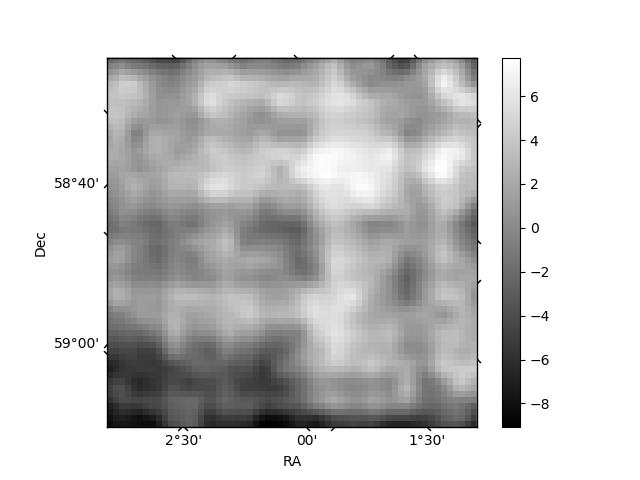
Histogram calculated using DETX and DETY for each event in the final _common_clean file
| Quadrant A | 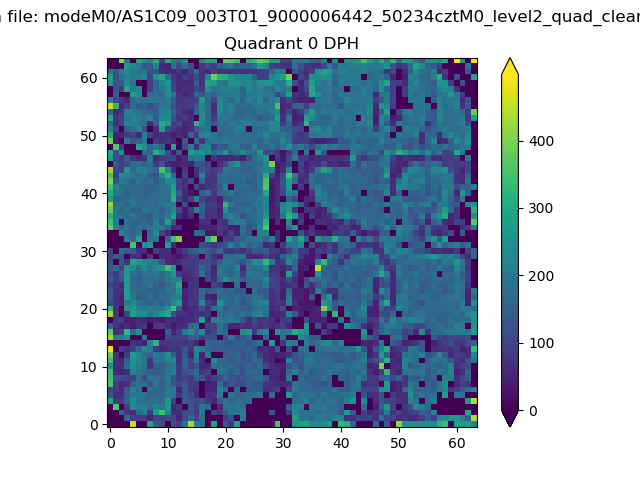 |
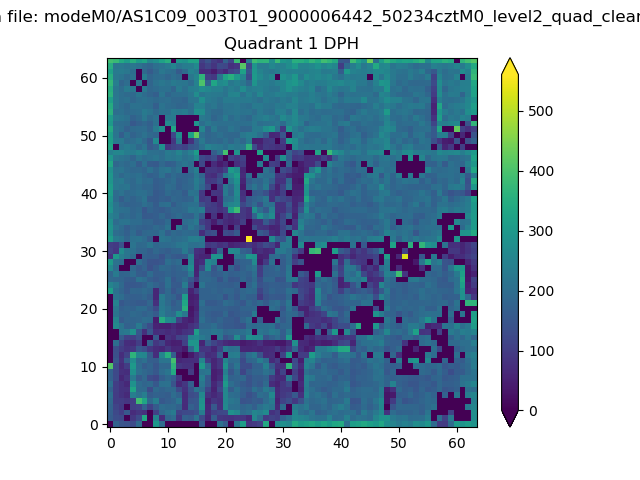 |
Quadrant B |
|---|---|---|---|
| Quadrant D | 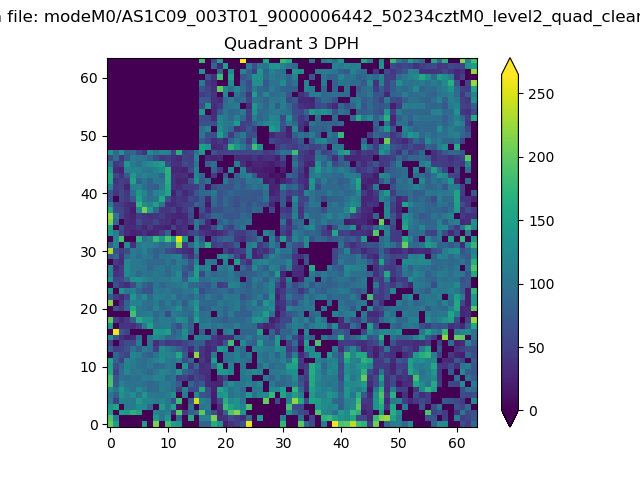 |
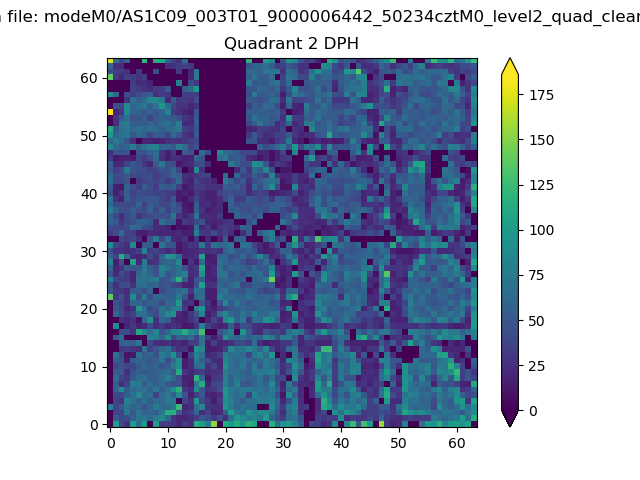 |
Quadrant C |
| Plot type | Count rate plots | Images |
|---|---|---|
| Comparison with Poisson distribution Blue bars denote a histogram of data divided into 1 sec bins. Red curve is a Poisson curve with rate = median count rate of data. |
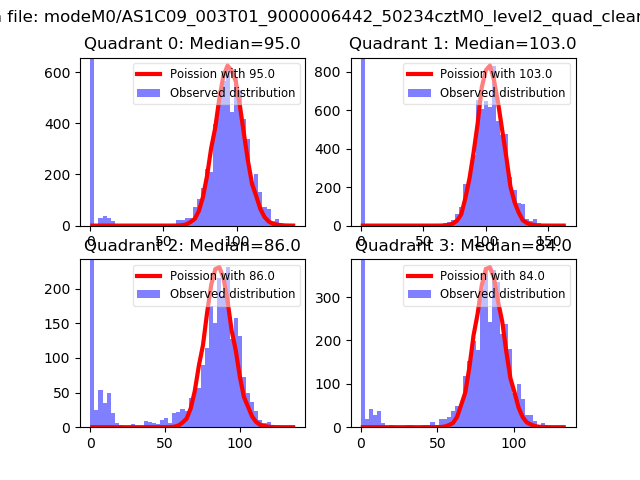 |
 |
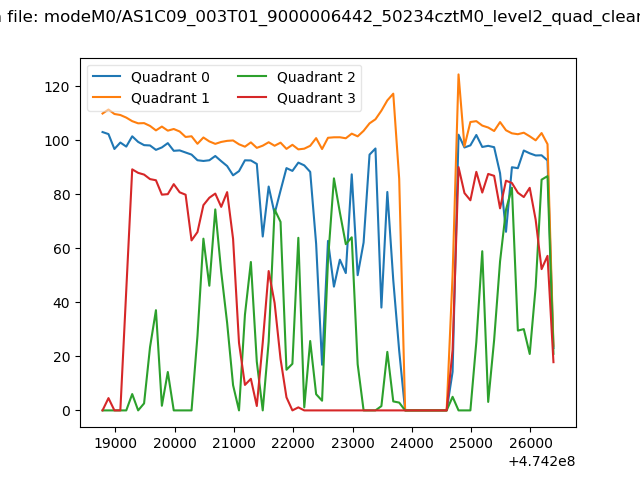
| Quadrant-wise count rates Data is divided into 100 sec bins |
 |
|
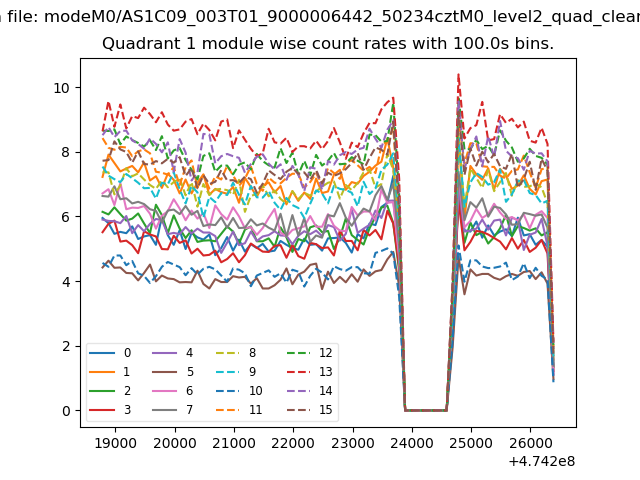
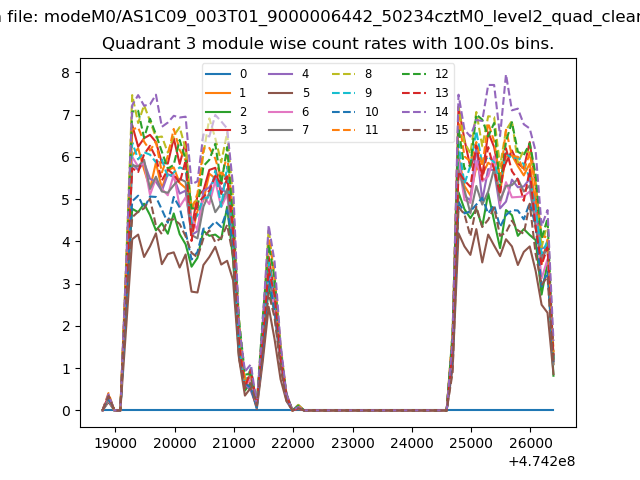
| Module-wise count rates for Quadrant A Data is divided into 100 sec bins |
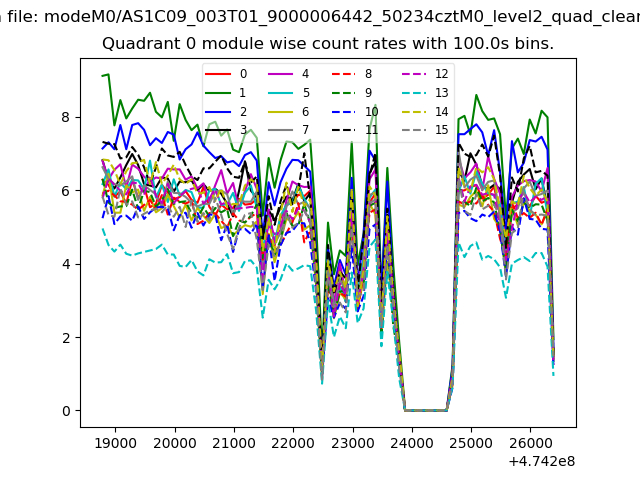 |
 |
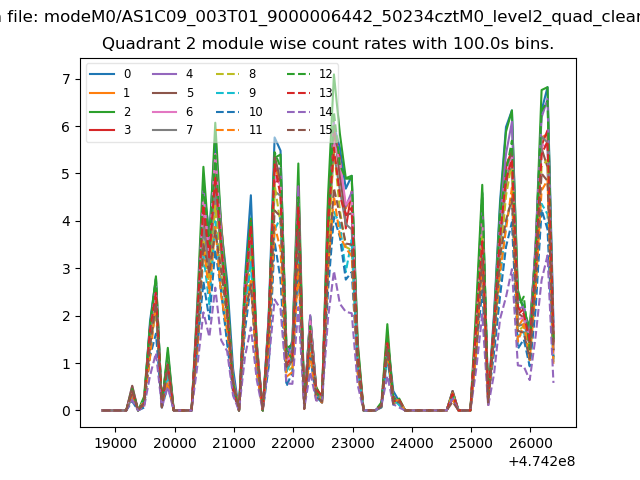
| Module-wise count rates for Quadrant B Data is divided into 100 sec bins |
 |
 |
| Module-wise count rates for Quadrant C Data is divided into 100 sec bins |
 |
 |
| Module-wise count rates for Quadrant D Data is divided into 100 sec bins |
 |
 |
| Parameter | Plot |
|---|---|
| CZT HV Monitor | 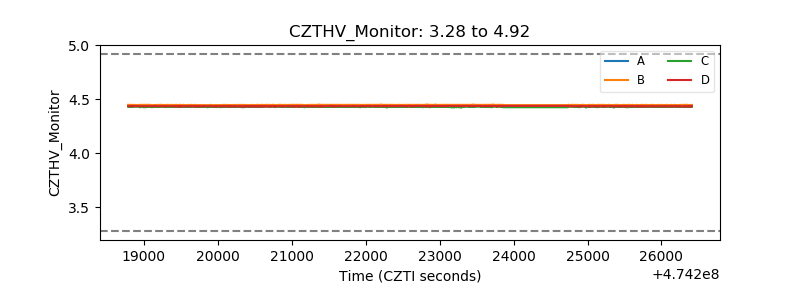 |
| D_VDD | 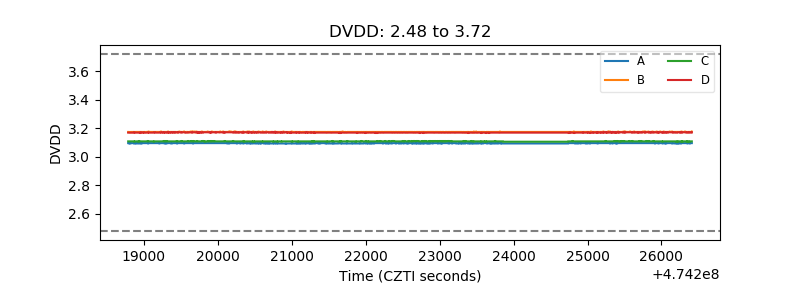 |
| Temperature 1 | 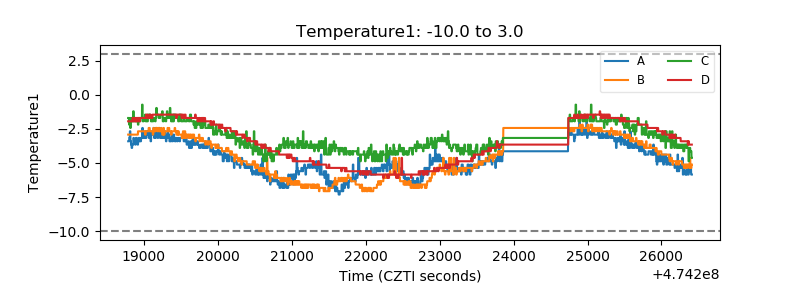 |
| Veto HV Monitor | 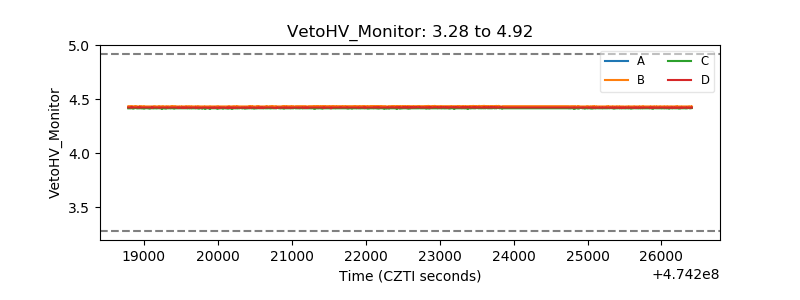 |
| Veto LLD | 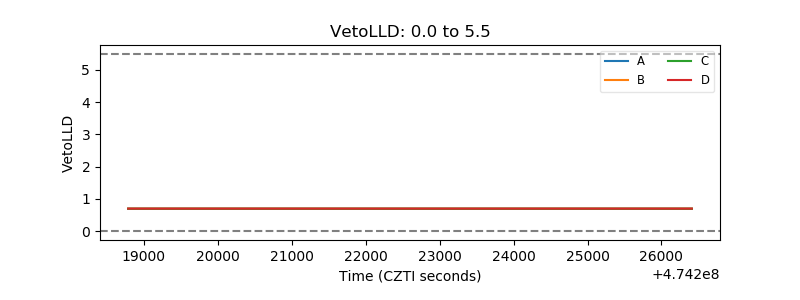 |
| Alpha Counter | 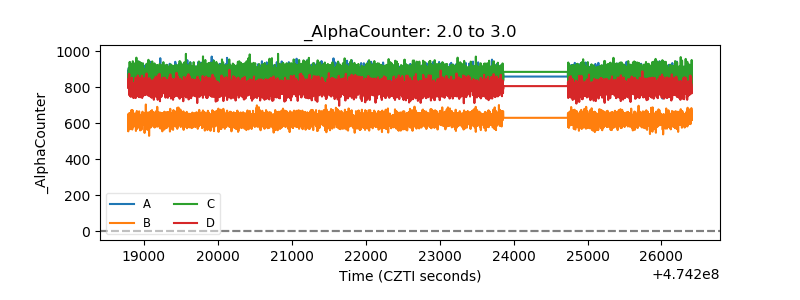 |
| _CPM_Rate | 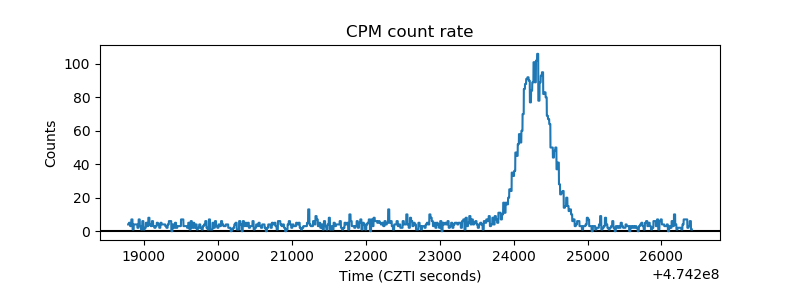 |
| CZT Counter | 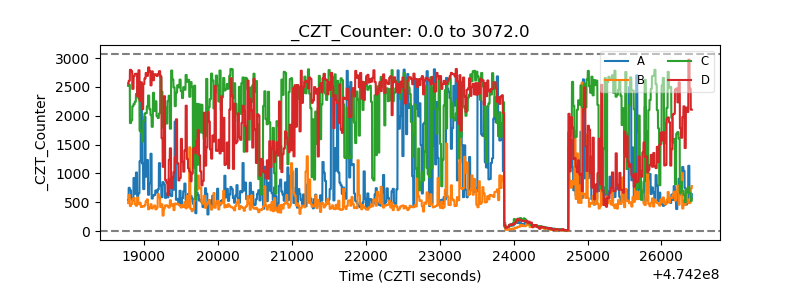 |
| +2.5 Volts monitor | 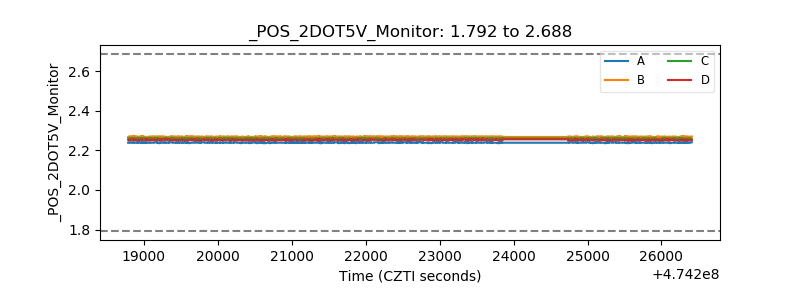 |
| +5 Volts monitor |  |
| _ROLL_ROT | 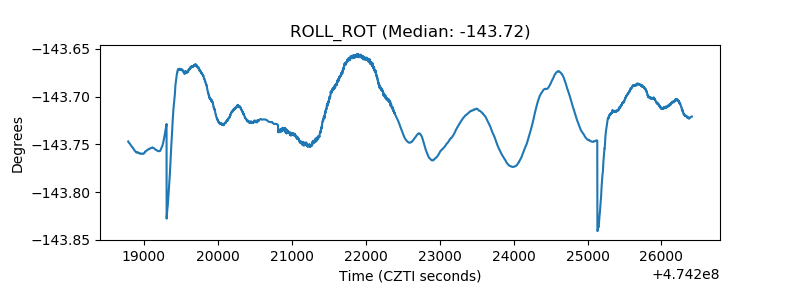 |
| _Roll_DEC | 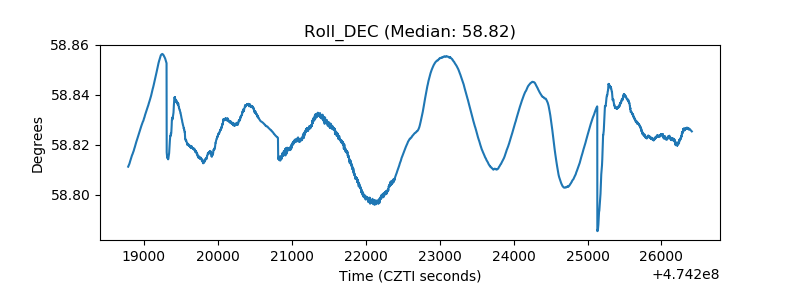 |
| _Roll_RA | 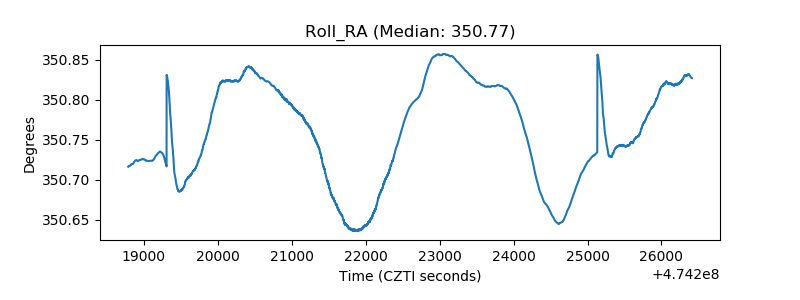 |
| Veto Counter | 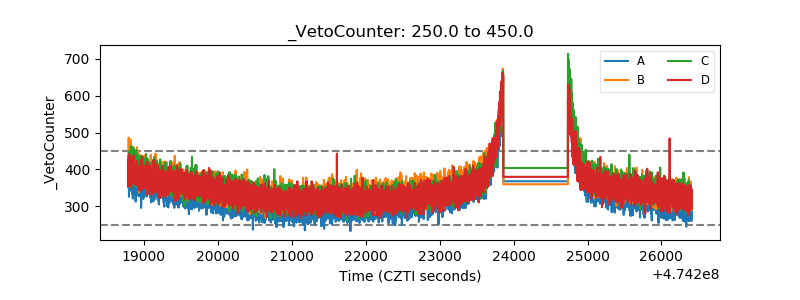 |