| Param | Original file | Final file |
|---|---|---|
| Filename | modeM0/AS1C09_003T01_9000006442_50235cztM0_level2.fits | modeM0/AS1C09_003T01_9000006442_50235cztM0_level2_quad_clean.evt |
| Size (bytes) | 1,082,157,120 | 79,073,280 |
| Size | 1.0 GB | 75.4 MB |
| Events in quadrant A | 6,965,906 | 588,476 |
| Events in quadrant B | 4,392,938 | 729,705 |
| Events in quadrant C | 13,543,549 | 287,547 |
| Events in quadrant D | 14,593,031 | 281,252 |
| Mode M9 | |||
|---|---|---|---|
| Quadrant | BADHDUFLAG | Total packets | Discarded packets |
| A | 0 | 5 | 0 |
| B | 0 | 5 | 0 |
| C | 0 | 5 | 0 |
| D | 0 | 5 | 0 |
| Mode M0 | |||
|---|---|---|---|
| Quadrant | BADHDUFLAG | Total packets | Discarded packets |
| A | 0 | 25631 | 1 |
| B | 0 | 18155 | 1 |
| C | 0 | 45210 | 1 |
| D | 0 | 48463 | 1 |
| Mode SS | |||
|---|---|---|---|
| Quadrant | BADHDUFLAG | Total packets | Discarded packets |
| A | 0 | 150 | 0 |
| B | 0 | 150 | 0 |
| C | 0 | 150 | 0 |
| D | 0 | 150 | 0 |
| Quadrant | Total seconds | Saturated seconds | Saturation percentage |
|---|---|---|---|
| A | 7286 | 1169 | 16.044469% |
| B | 7286 | 256 | 3.513588% |
| C | 7287 | 4377 | 60.065871% |
| D | 7287 | 4284 | 58.789625% |
Noise dominated data is calculated using 1-second bins in cleaned event files. If a bin has >2000 counts, and if more than 50% of those come from <1% of pixels, then it is considered to be noise-dominated and hence unusable.
| Quadrant | # 1 sec bins | Bins with >0 counts | Bins with >2000 counts | High rate bins dominated by noise | Noise dominated (total time) | Noise dominated (detector-on time) | Marked lightcurve |
|---|---|---|---|---|---|---|---|
| A | 7726 | 7289 | 971 | 971 | 12.57% | 13.32% | 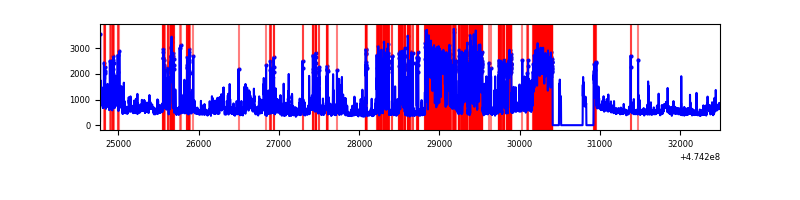 |
| B | 7726 | 7289 | 113 | 113 | 1.46% | 1.55% | 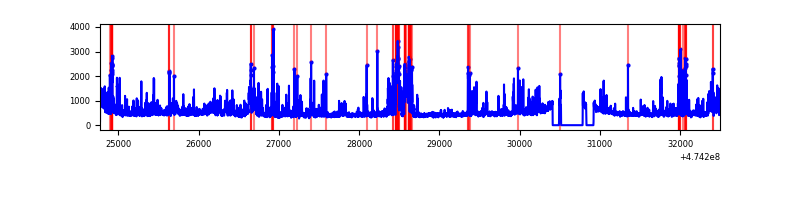 |
| C | 7727 | 7288 | 3422 | 3422 | 44.29% | 46.95% | 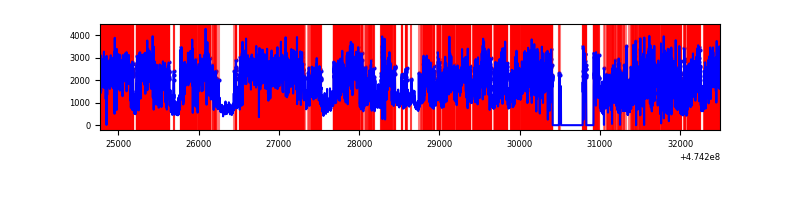 |
| D | 7727 | 7290 | 4303 | 4303 | 55.69% | 59.03% | 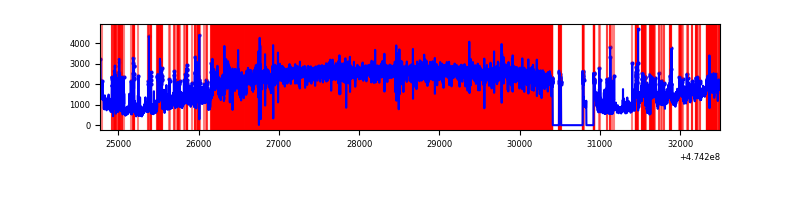 |
Top three noisy pixels from each quadrant. If the there are fewer than three noisy pixels in the level2.evt file, extra rows are filled as -1
| Pixel properties | Quadrant properties | ||||||
|---|---|---|---|---|---|---|---|
| Quadrant | DetID | PixID | Counts | Sigma | Mean | Median | Sigma |
| A | 0 | 98 | 2220391 | 12328.07 | 723 | 706 | 180.1 |
| A | 11 | 7 | 316270 | 1752.63 | 723 | 706 | 180.1 |
| A | 6 | 250 | 279721 | 1549.64 | 723 | 706 | 180.1 |
| B | 3 | 249 | 270655 | 1660.41 | 771 | 744 | 162.6 |
| B | 10 | 28 | 232911 | 1428.22 | 771 | 744 | 162.6 |
| B | 6 | 36 | 163321 | 1000.12 | 771 | 744 | 162.6 |
| C | 4 | 111 | 3767999 | 28336.22 | 473 | 471 | 133.0 |
| C | 15 | 213 | 2162083 | 16257.85 | 473 | 471 | 133.0 |
| C | 15 | 182 | 1570912 | 11811.56 | 473 | 471 | 133.0 |
| D | 7 | 61 | 7359890 | 46859.54 | 559 | 540 | 157.1 |
| D | 15 | 108 | 1562917 | 9948.2 | 559 | 540 | 157.1 |
| D | 15 | 106 | 482477 | 3068.66 | 559 | 540 | 157.1 |
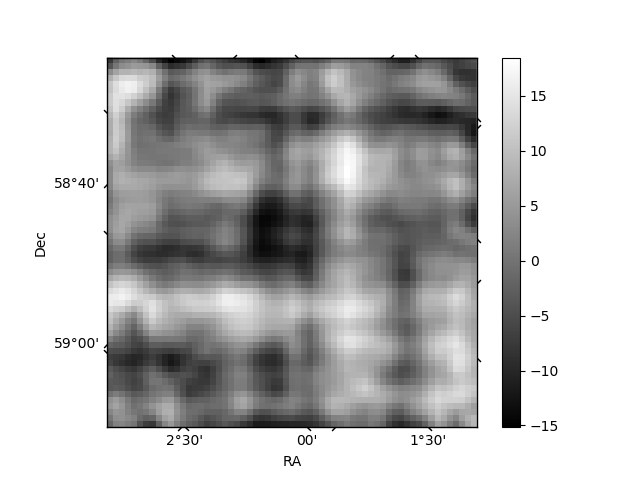
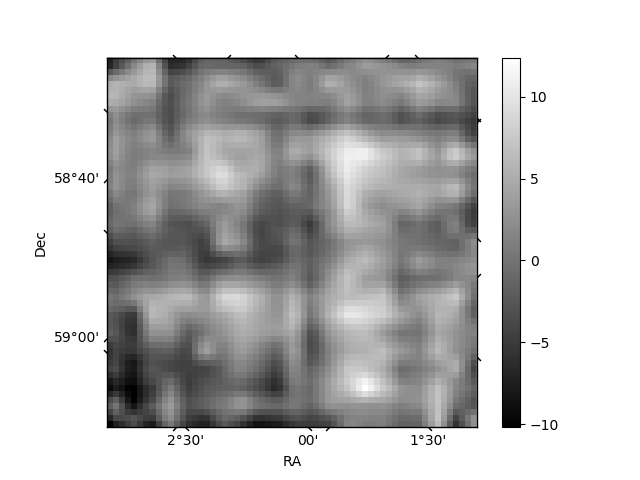
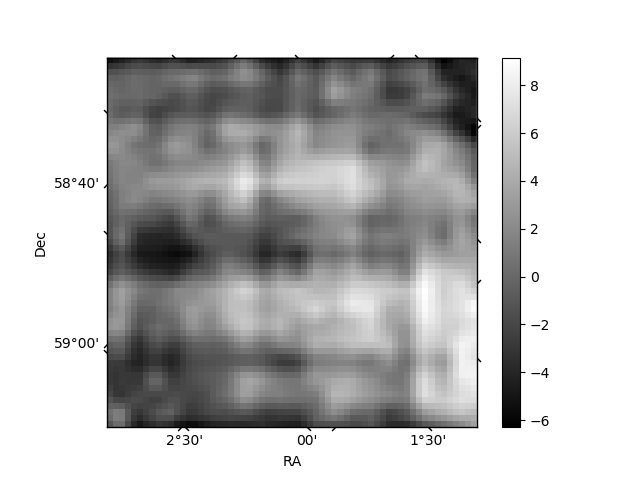
Histogram calculated using DETX and DETY for each event in the final _common_clean file
| Quadrant A | 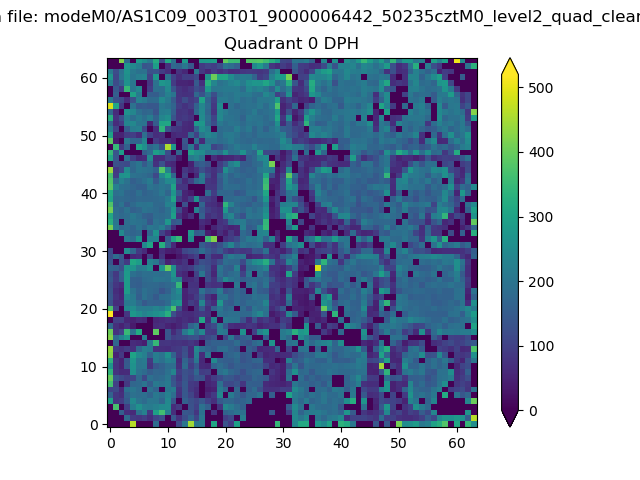 |
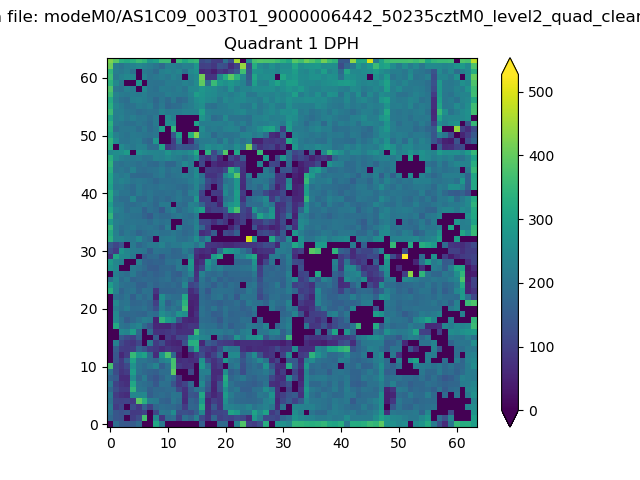 |
Quadrant B |
|---|---|---|---|
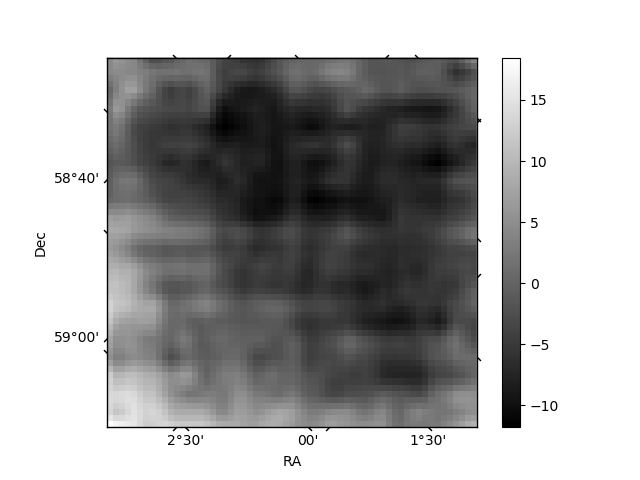
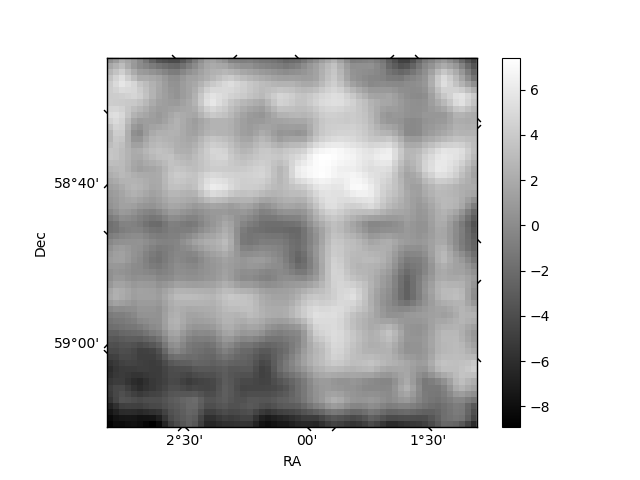
| Quadrant D | 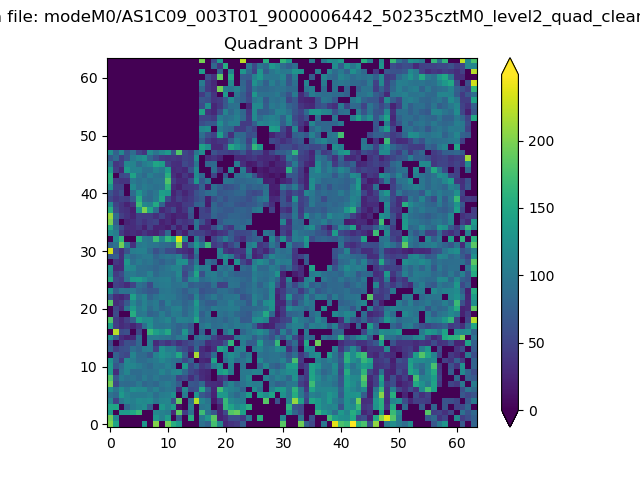 |
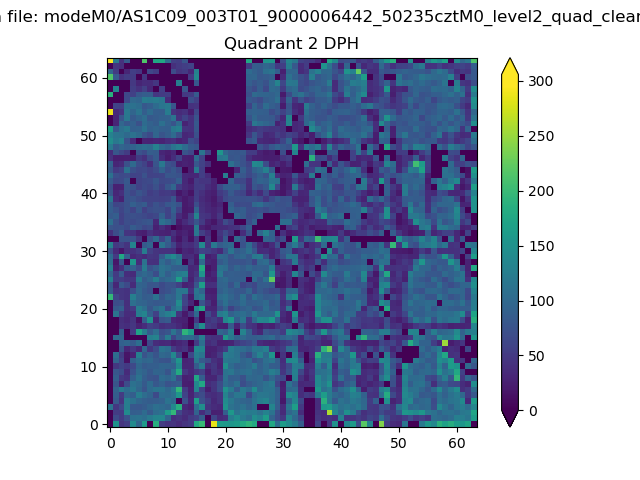 |
Quadrant C |
| Plot type | Count rate plots | Images |
|---|---|---|
| Comparison with Poisson distribution Blue bars denote a histogram of data divided into 1 sec bins. Red curve is a Poisson curve with rate = median count rate of data. |
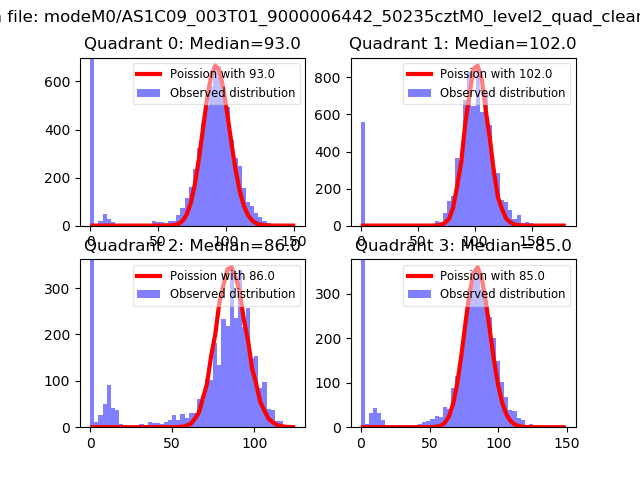 |
 |
| Quadrant-wise count rates Data is divided into 100 sec bins |
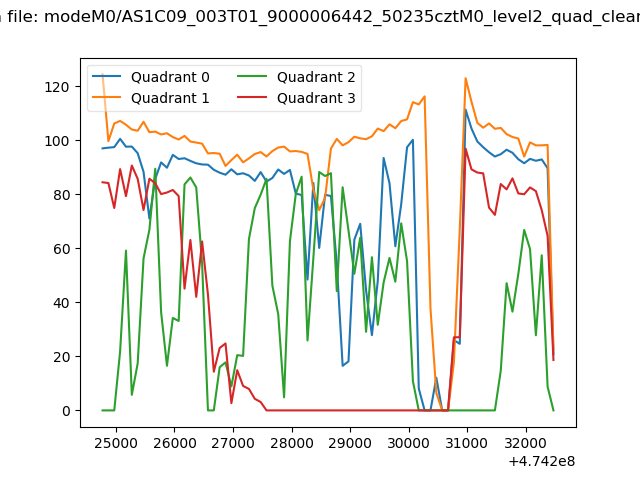 |
|
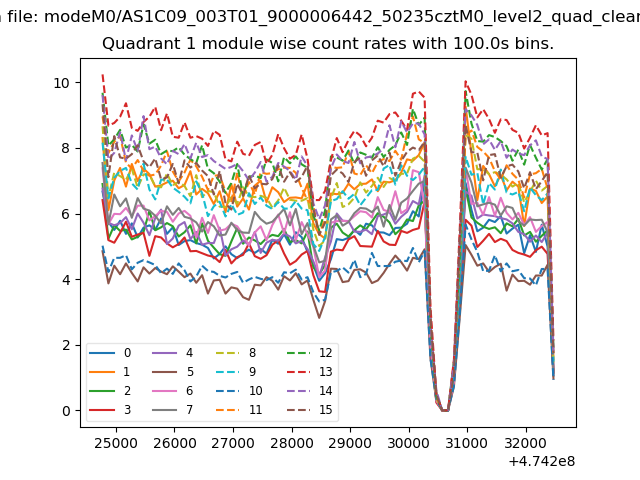
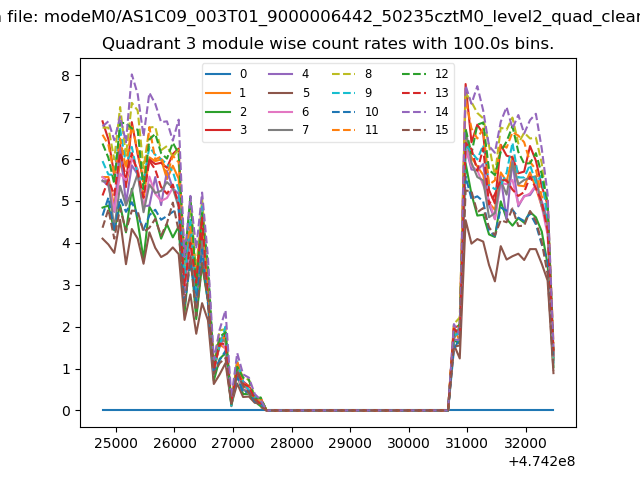
| Module-wise count rates for Quadrant A Data is divided into 100 sec bins |
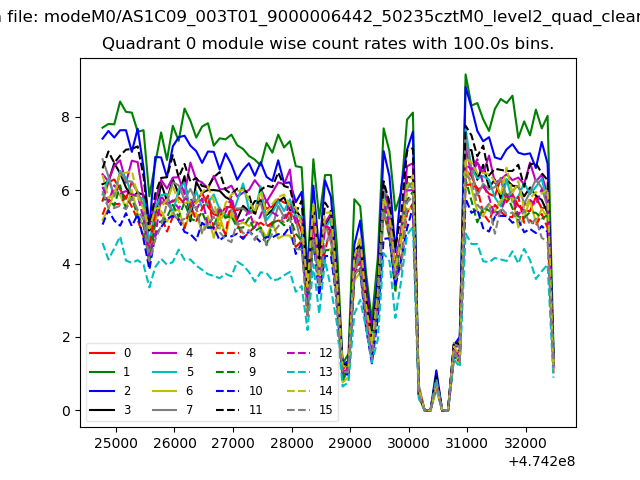 |
 |
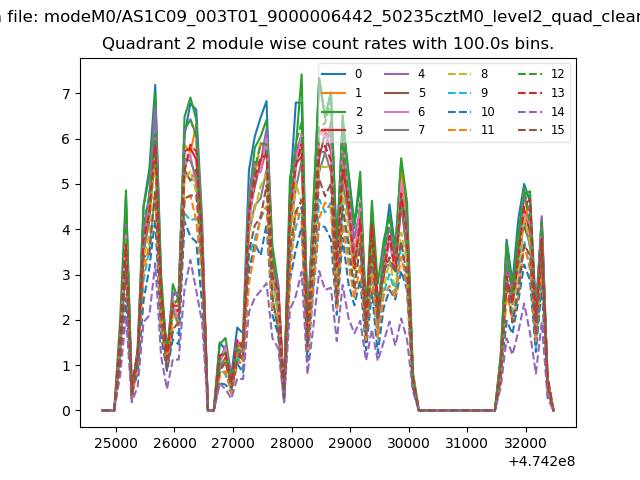
| Module-wise count rates for Quadrant B Data is divided into 100 sec bins |
 |
 |
| Module-wise count rates for Quadrant C Data is divided into 100 sec bins |
 |
 |
| Module-wise count rates for Quadrant D Data is divided into 100 sec bins |
 |
 |
| Parameter | Plot |
|---|---|
| CZT HV Monitor | 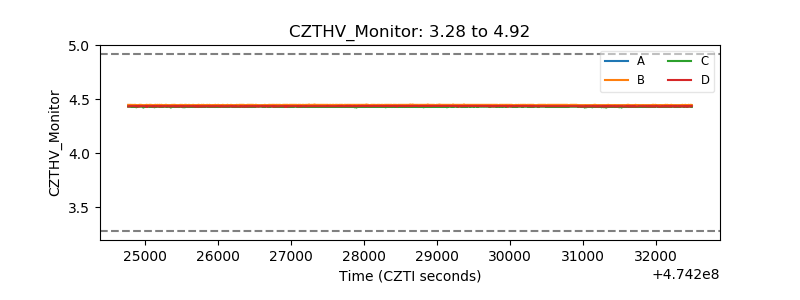 |
| D_VDD | 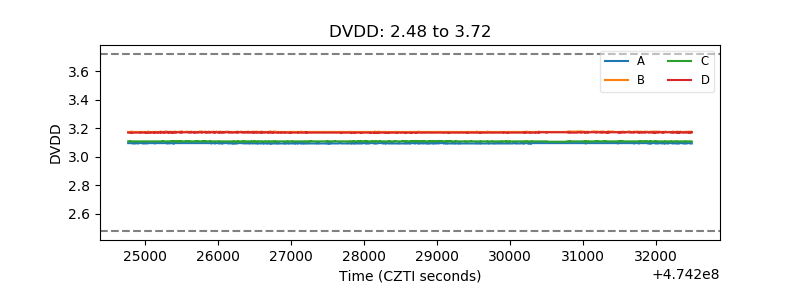 |
| Temperature 1 | 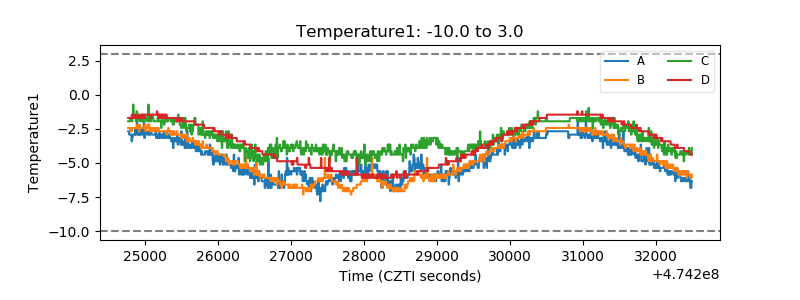 |
| Veto HV Monitor | 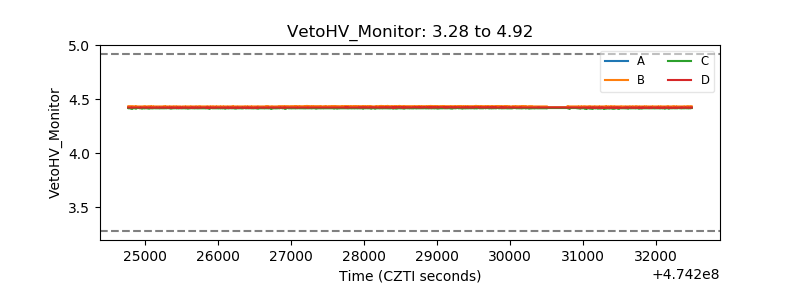 |
| Veto LLD | 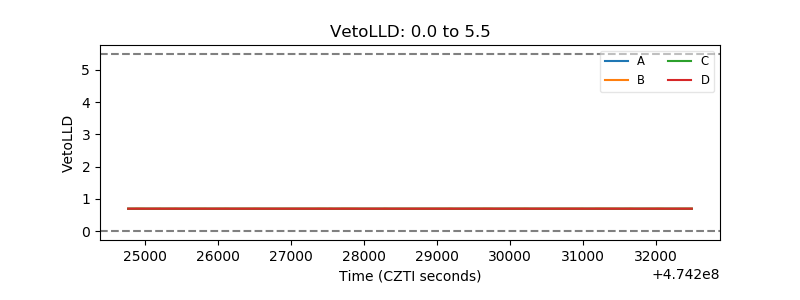 |
| Alpha Counter | 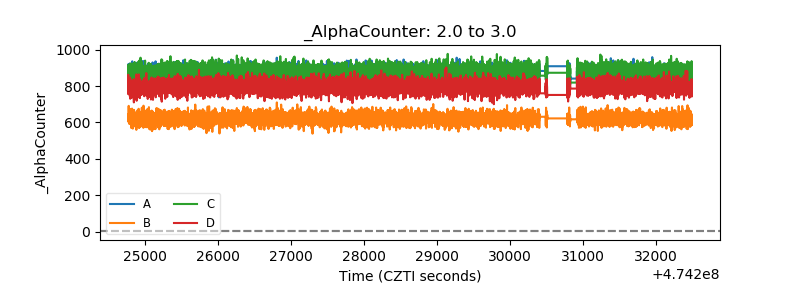 |
| _CPM_Rate | 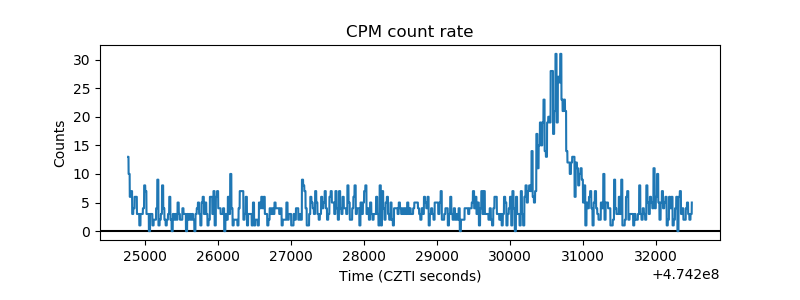 |
| CZT Counter | 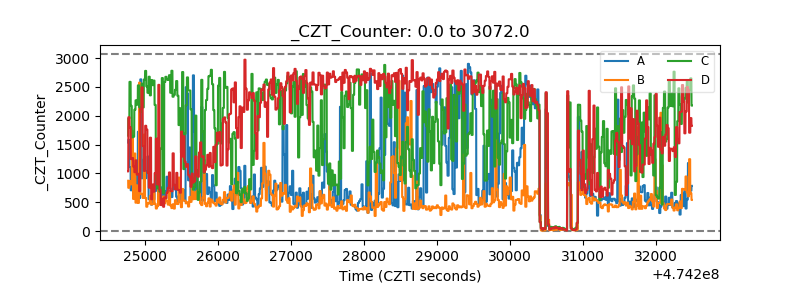 |
| +2.5 Volts monitor |  |
| +5 Volts monitor | 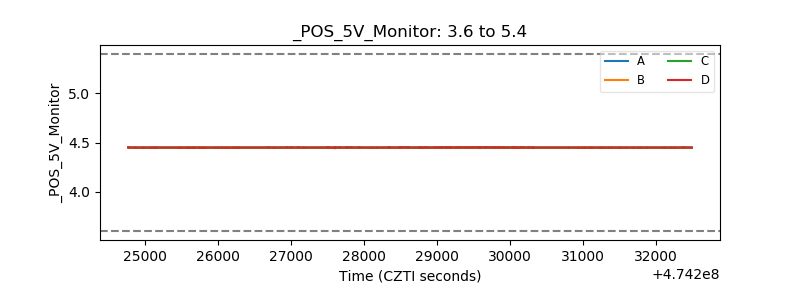 |
| _ROLL_ROT | 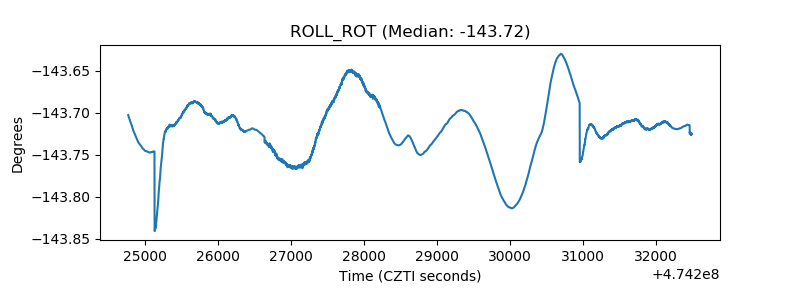 |
| _Roll_DEC | 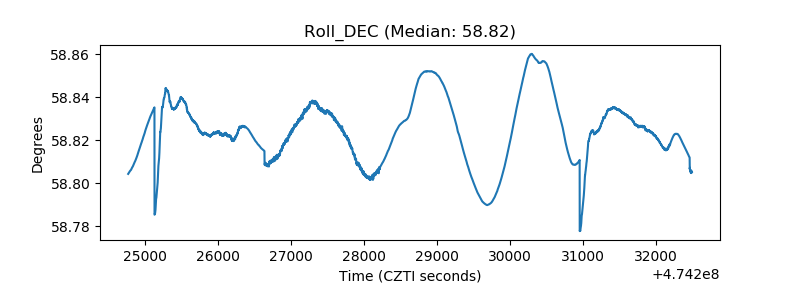 |
| _Roll_RA | 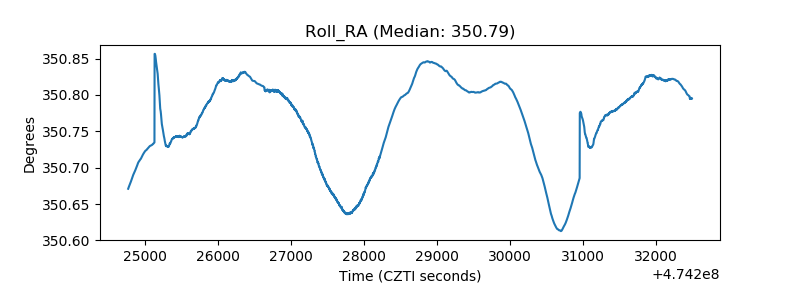 |
| Veto Counter | 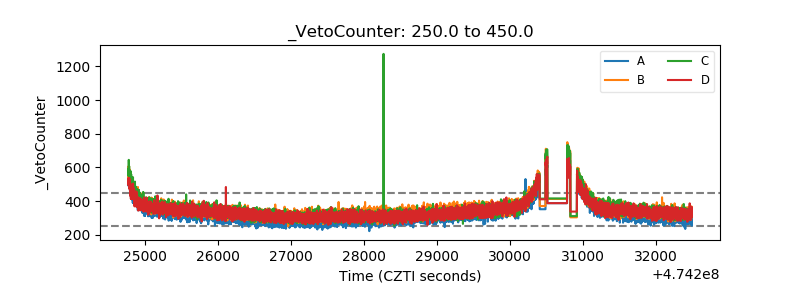 |