| Param | Original file | Final file |
|---|---|---|
| Filename | modeM0/AS1C09_003T01_9000006442_50236cztM0_level2.fits | modeM0/AS1C09_003T01_9000006442_50236cztM0_level2_quad_clean.evt |
| Size (bytes) | 1,081,071,360 | 58,489,920 |
| Size | 1.0 GB | 55.8 MB |
| Events in quadrant A | 9,289,341 | 346,811 |
| Events in quadrant B | 4,017,088 | 621,740 |
| Events in quadrant C | 11,976,041 | 212,568 |
| Events in quadrant D | 14,249,947 | 150,232 |
| Mode M0 | |||
|---|---|---|---|
| Quadrant | BADHDUFLAG | Total packets | Discarded packets |
| A | 0 | 31841 | 0 |
| B | 0 | 16441 | 0 |
| C | 0 | 39895 | 0 |
| D | 0 | 46646 | 0 |
| Mode SS | |||
|---|---|---|---|
| Quadrant | BADHDUFLAG | Total packets | Discarded packets |
| A | 0 | 126 | 0 |
| B | 0 | 126 | 0 |
| C | 0 | 126 | 0 |
| D | 0 | 126 | 0 |
| Quadrant | Total seconds | Saturated seconds | Saturation percentage |
|---|---|---|---|
| A | 6289 | 2732 | 43.440929% |
| B | 6290 | 229 | 3.640700% |
| C | 6290 | 4160 | 66.136725% |
| D | 6290 | 4639 | 73.751987% |
Noise dominated data is calculated using 1-second bins in cleaned event files. If a bin has >2000 counts, and if more than 50% of those come from <1% of pixels, then it is considered to be noise-dominated and hence unusable.
| Quadrant | # 1 sec bins | Bins with >0 counts | Bins with >2000 counts | High rate bins dominated by noise | Noise dominated (total time) | Noise dominated (detector-on time) | Marked lightcurve |
|---|---|---|---|---|---|---|---|
| A | 6289 | 6289 | 2447 | 2447 | 38.91% | 38.91% | 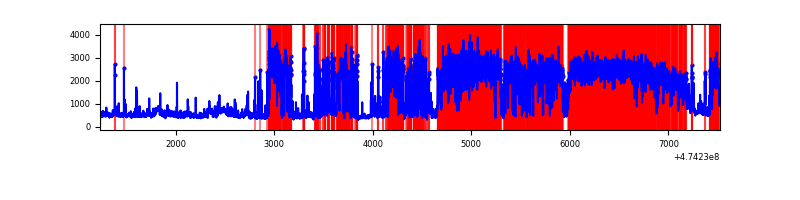 |
| B | 6290 | 6290 | 185 | 185 | 2.94% | 2.94% | 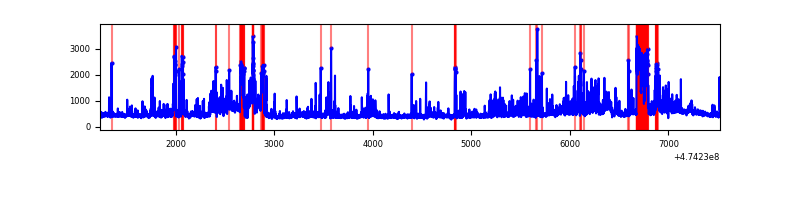 |
| C | 6290 | 6289 | 3016 | 3016 | 47.95% | 47.96% | 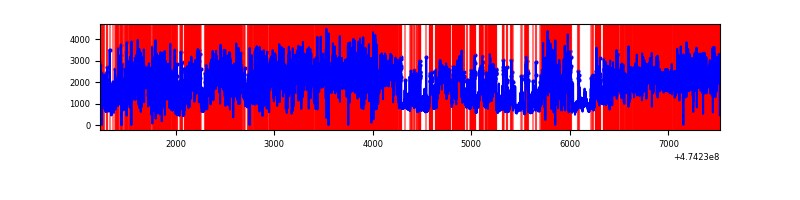 |
| D | 6290 | 6290 | 4696 | 4696 | 74.66% | 74.66% | 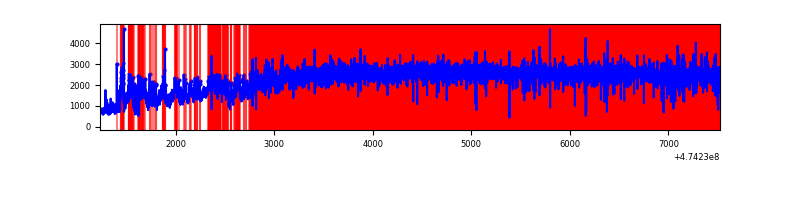 |
Top three noisy pixels from each quadrant. If the there are fewer than three noisy pixels in the level2.evt file, extra rows are filled as -1
| Pixel properties | Quadrant properties | ||||||
|---|---|---|---|---|---|---|---|
| Quadrant | DetID | PixID | Counts | Sigma | Mean | Median | Sigma |
| A | 0 | 98 | 5298672 | 39429.32 | 537 | 524 | 134.4 |
| A | 8 | 38 | 495519 | 3683.8 | 537 | 524 | 134.4 |
| A | 12 | 250 | 342908 | 2548.05 | 537 | 524 | 134.4 |
| B | 4 | 206 | 409161 | 2937.71 | 655 | 632 | 139.1 |
| B | 5 | 32 | 323886 | 2324.5 | 655 | 632 | 139.1 |
| B | 3 | 249 | 90245 | 644.4 | 655 | 632 | 139.1 |
| C | 4 | 111 | 4410324 | 42536.37 | 376 | 375 | 103.7 |
| C | 15 | 213 | 2268648 | 21878.73 | 376 | 375 | 103.7 |
| C | 15 | 197 | 859096 | 8282.83 | 376 | 375 | 103.7 |
| D | 7 | 61 | 8412842 | 79283.78 | 370 | 358 | 106.1 |
| D | 15 | 108 | 1460668 | 13762.75 | 370 | 358 | 106.1 |
| D | 15 | 185 | 465246 | 4381.35 | 370 | 358 | 106.1 |
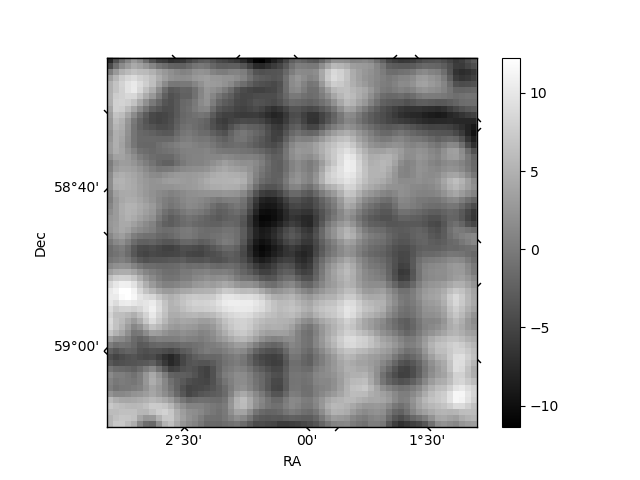
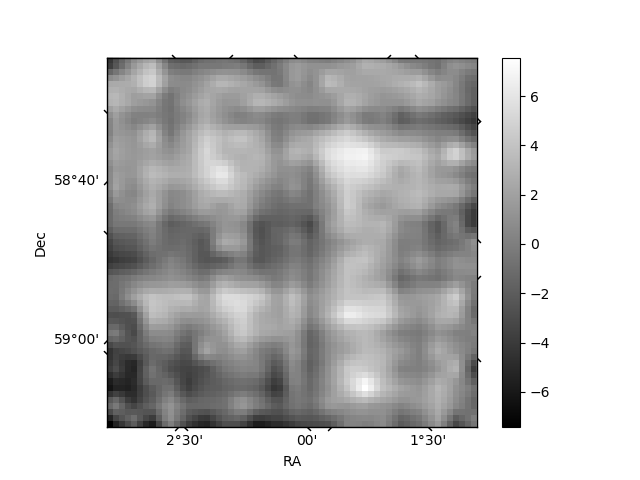
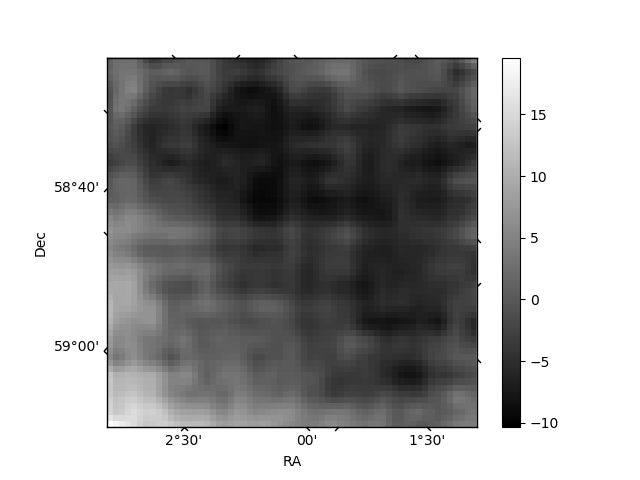
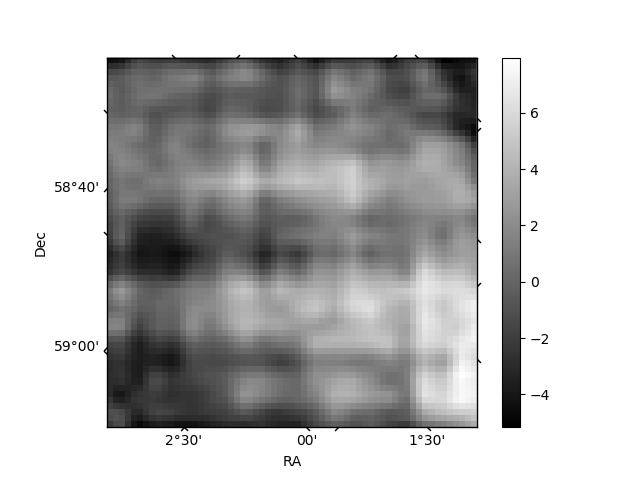
Histogram calculated using DETX and DETY for each event in the final _common_clean file
| Quadrant A | 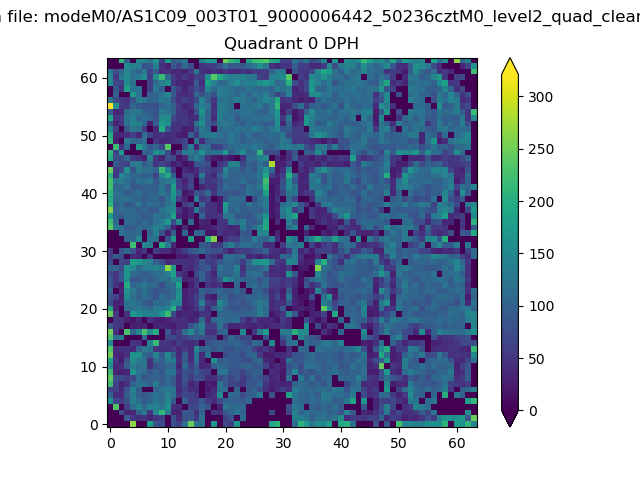 |
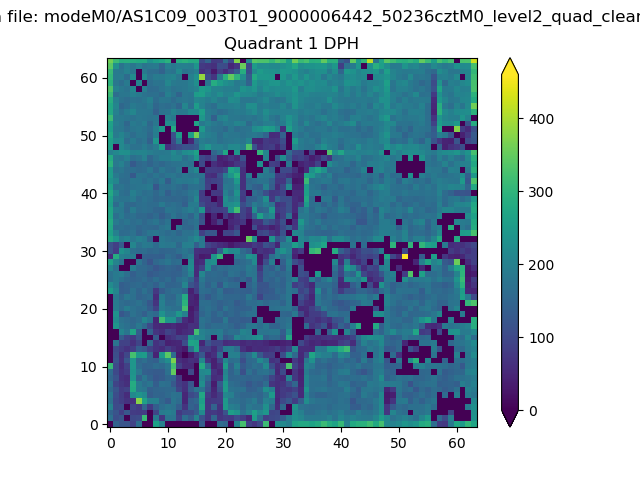 |
Quadrant B |
|---|---|---|---|
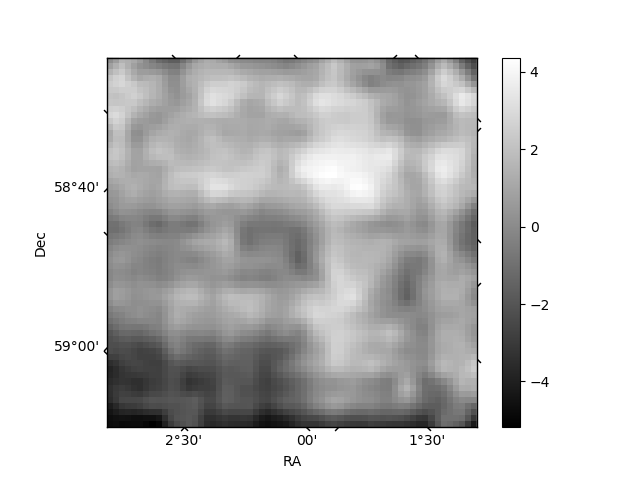
| Quadrant D | 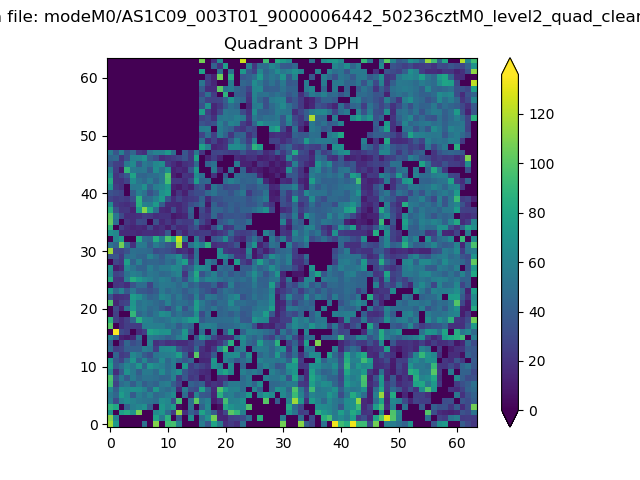 |
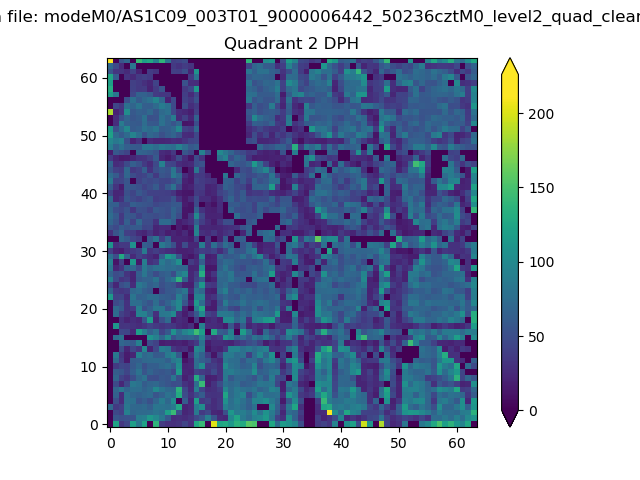 |
Quadrant C |
| Plot type | Count rate plots | Images |
|---|---|---|
| Comparison with Poisson distribution Blue bars denote a histogram of data divided into 1 sec bins. Red curve is a Poisson curve with rate = median count rate of data. |
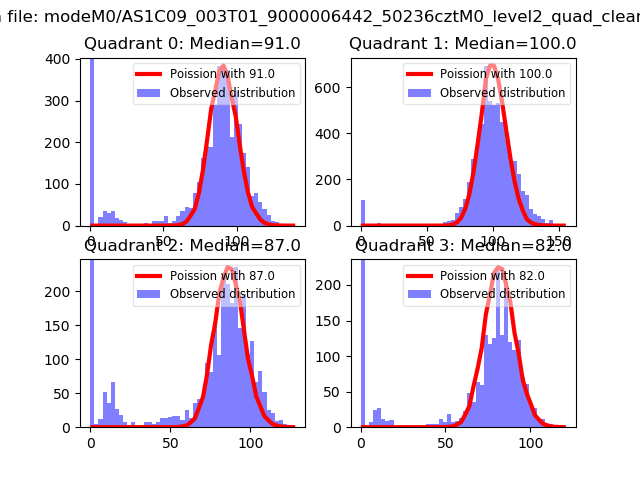 |
 |
| Quadrant-wise count rates Data is divided into 100 sec bins |
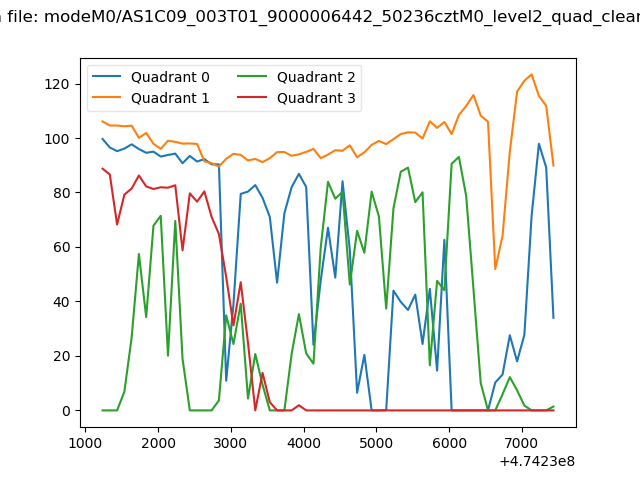 |
|
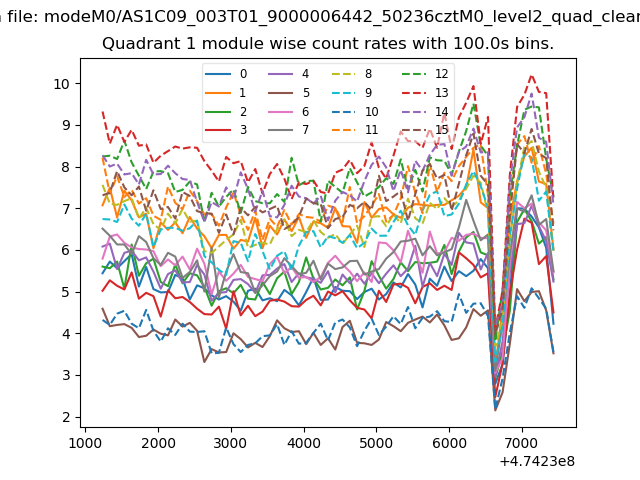
| Module-wise count rates for Quadrant A Data is divided into 100 sec bins |
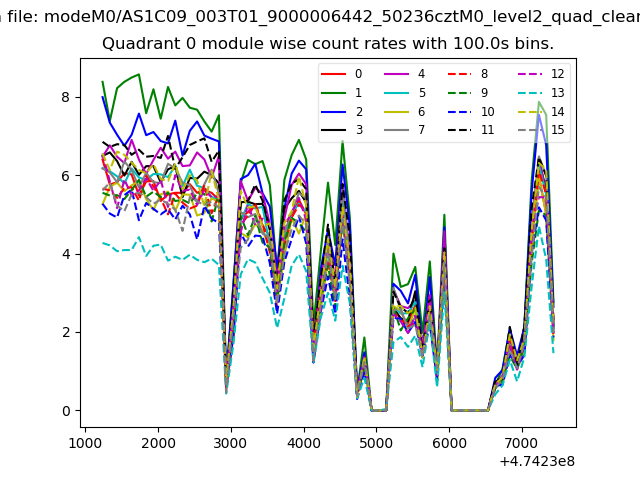 |
 |
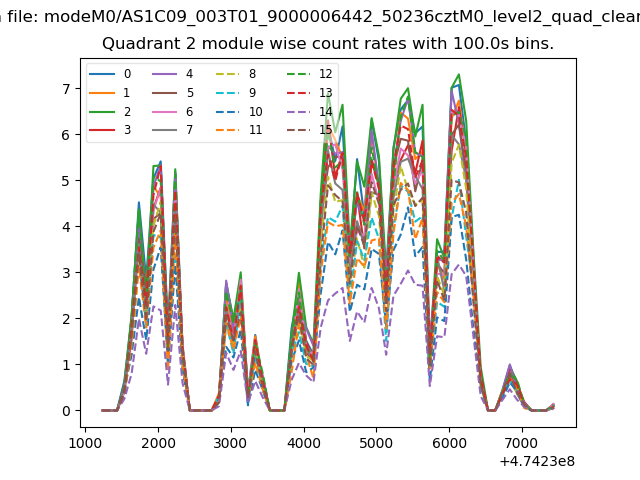
| Module-wise count rates for Quadrant B Data is divided into 100 sec bins |
 |
 |
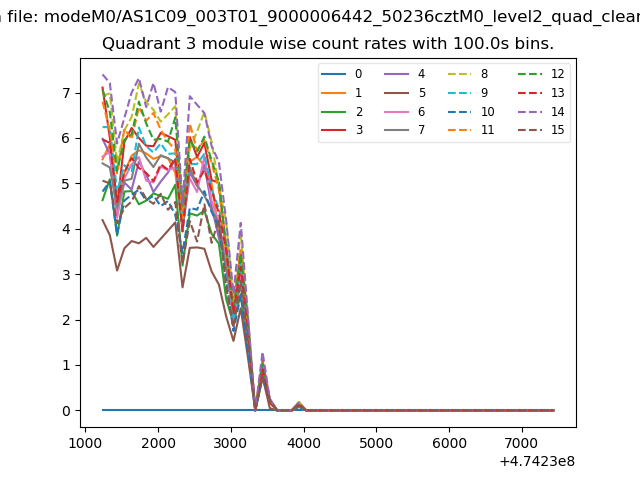
| Module-wise count rates for Quadrant C Data is divided into 100 sec bins |
 |
 |
| Module-wise count rates for Quadrant D Data is divided into 100 sec bins |
 |
 |
| Parameter | Plot |
|---|---|
| CZT HV Monitor | 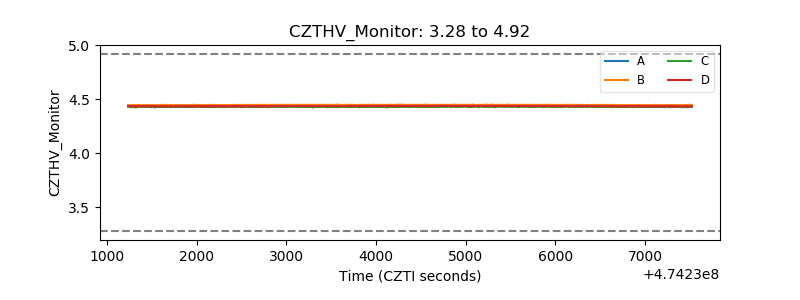 |
| D_VDD | 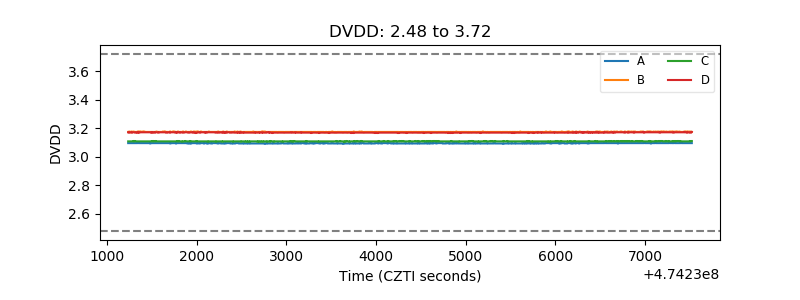 |
| Temperature 1 | 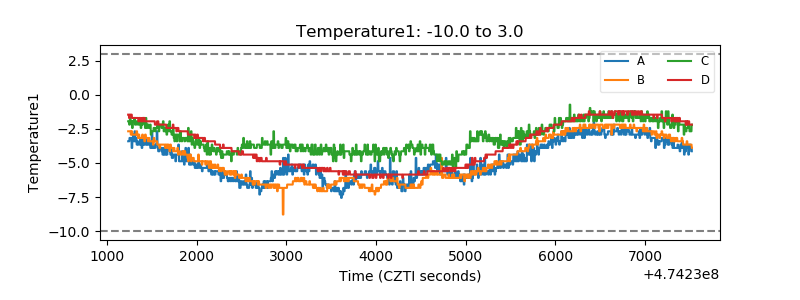 |
| Veto HV Monitor | 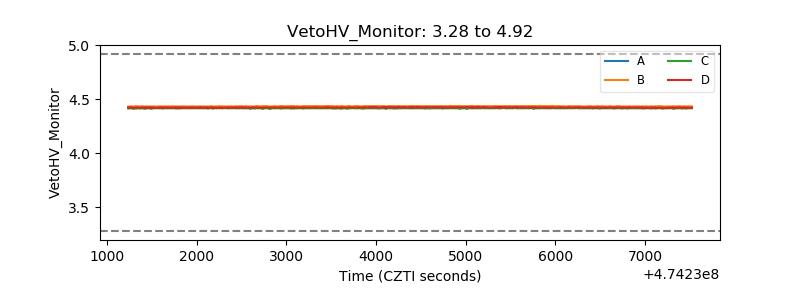 |
| Veto LLD | 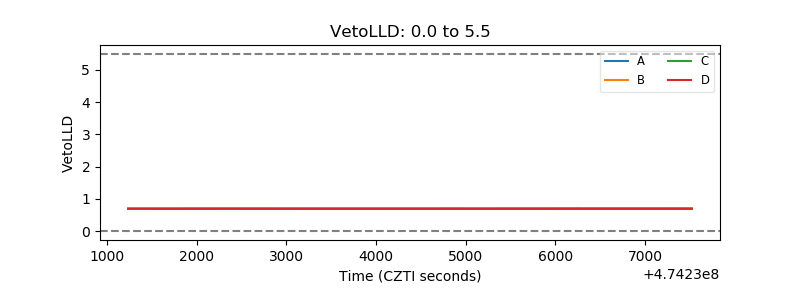 |
| Alpha Counter | 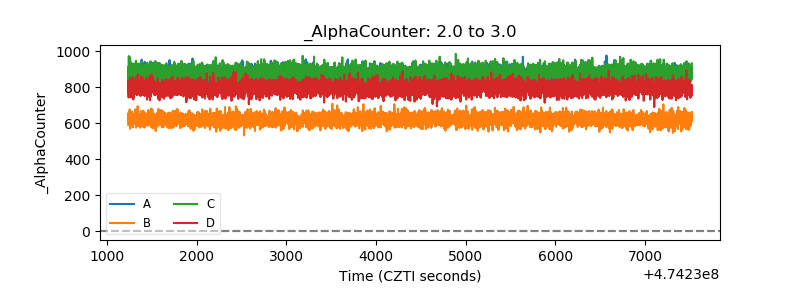 |
| _CPM_Rate | 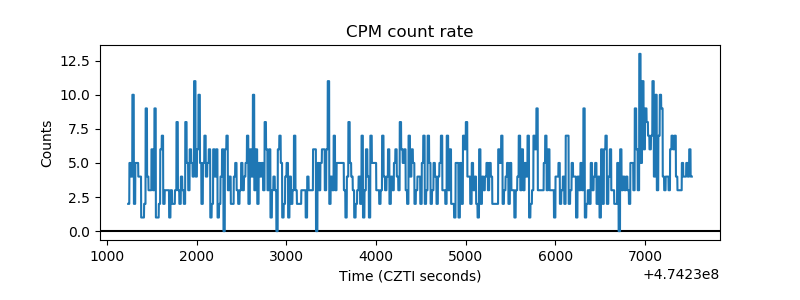 |
| CZT Counter | 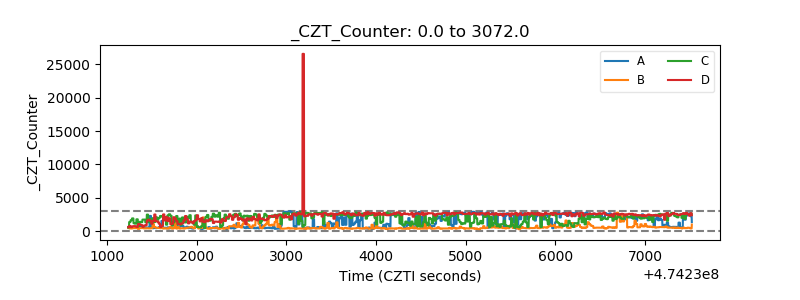 |
| +2.5 Volts monitor | 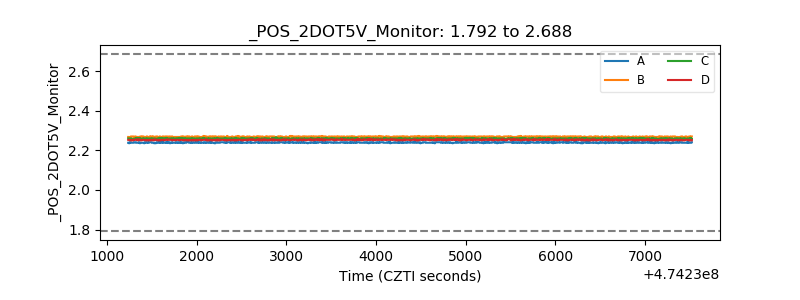 |
| +5 Volts monitor |  |
| _ROLL_ROT | 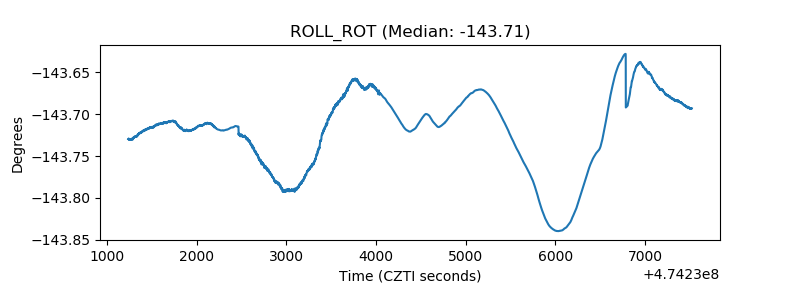 |
| _Roll_DEC | 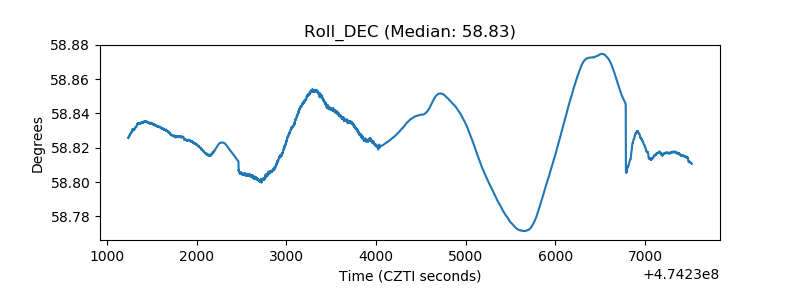 |
| _Roll_RA | 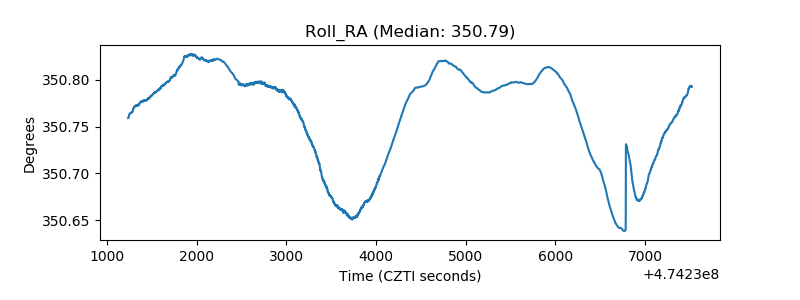 |
| Veto Counter | 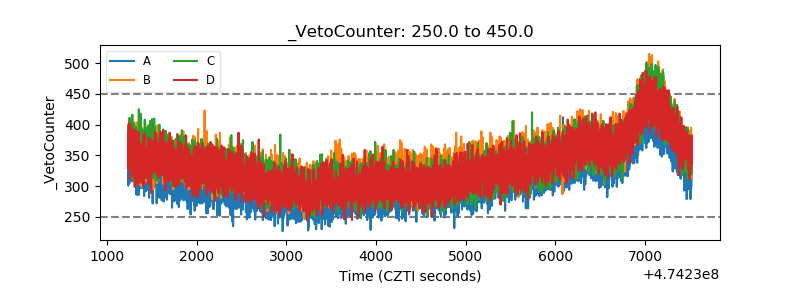 |