| Param | Original file | Final file |
|---|---|---|
| Filename | modeM0/AS1C09_003T01_9000006442_50293cztM0_level2.fits | modeM0/AS1C09_003T01_9000006442_50293cztM0_level2_quad_clean.evt |
| Size (bytes) | 204,877,440 | 10,391,040 |
| Size | 195.4 MB | 9.9 MB |
| Events in quadrant A | 1,774,468 | 75,421 |
| Events in quadrant B | 762,214 | 111,289 |
| Events in quadrant C | 2,626,958 | 1,991 |
| Events in quadrant D | 2,330,982 | 40,998 |
| Mode M0 | |||
|---|---|---|---|
| Quadrant | BADHDUFLAG | Total packets | Discarded packets |
| A | 0 | 6059 | 0 |
| B | 0 | 3004 | 0 |
| C | 0 | 8550 | 0 |
| D | 0 | 7702 | 0 |
| Mode SS | |||
|---|---|---|---|
| Quadrant | BADHDUFLAG | Total packets | Discarded packets |
| A | 0 | 22 | 0 |
| B | 0 | 22 | 0 |
| C | 0 | 22 | 0 |
| D | 0 | 22 | 0 |
| Quadrant | Total seconds | Saturated seconds | Saturation percentage |
|---|---|---|---|
| A | 1120 | 371 | 33.125000% |
| B | 1119 | 39 | 3.485255% |
| C | 1119 | 1096 | 97.944593% |
| D | 1119 | 694 | 62.019660% |
Noise dominated data is calculated using 1-second bins in cleaned event files. If a bin has >2000 counts, and if more than 50% of those come from <1% of pixels, then it is considered to be noise-dominated and hence unusable.
| Quadrant | # 1 sec bins | Bins with >0 counts | Bins with >2000 counts | High rate bins dominated by noise | Noise dominated (total time) | Noise dominated (detector-on time) | Marked lightcurve |
|---|---|---|---|---|---|---|---|
| A | 1120 | 1120 | 373 | 373 | 33.30% | 33.30% | 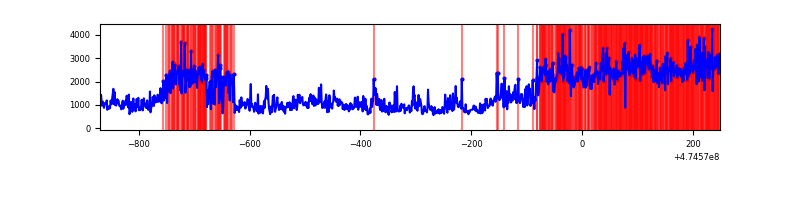 |
| B | 1119 | 1119 | 34 | 34 | 3.04% | 3.04% | 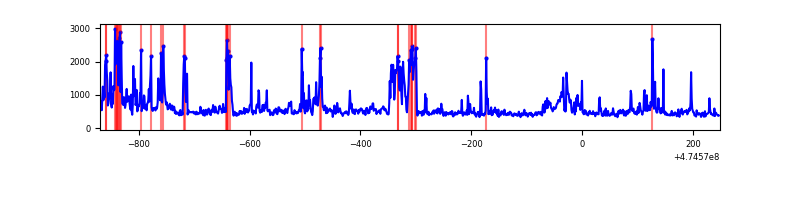 |
| C | 1119 | 1119 | 896 | 896 | 80.07% | 80.07% | 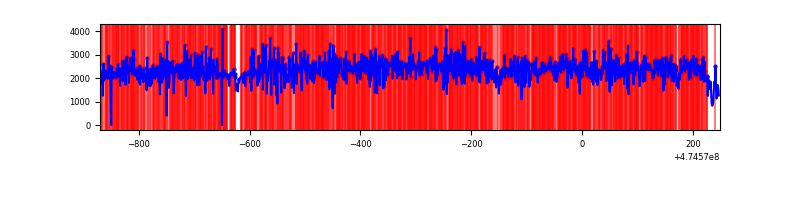 |
| D | 1119 | 1119 | 698 | 698 | 62.38% | 62.38% | 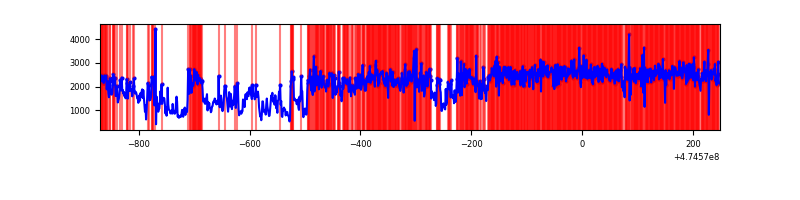 |
Top three noisy pixels from each quadrant. If the there are fewer than three noisy pixels in the level2.evt file, extra rows are filled as -1
| Pixel properties | Quadrant properties | ||||||
|---|---|---|---|---|---|---|---|
| Quadrant | DetID | PixID | Counts | Sigma | Mean | Median | Sigma |
| A | 6 | 250 | 1212836 | 45253.66 | 100 | 97 | 26.8 |
| A | 12 | 250 | 64562 | 2405.53 | 100 | 97 | 26.8 |
| A | 3 | 231 | 27191 | 1011.02 | 100 | 97 | 26.8 |
| B | 4 | 206 | 213153 | 8266.97 | 113 | 109 | 25.8 |
| B | 0 | 172 | 53212 | 2060.61 | 113 | 109 | 25.8 |
| B | 0 | 213 | 11323 | 435.15 | 113 | 109 | 25.8 |
| C | 15 | 197 | 1817772 | 166634.24 | 33 | 33 | 10.9 |
| C | 4 | 111 | 622632 | 57074.37 | 33 | 33 | 10.9 |
| C | 15 | 127 | 15867 | 1451.52 | 33 | 33 | 10.9 |
| D | 7 | 61 | 1226300 | 48108.07 | 88 | 85 | 25.5 |
| D | 2 | 37 | 242525 | 9511.64 | 88 | 85 | 25.5 |
| D | 15 | 108 | 127254 | 4989.22 | 88 | 85 | 25.5 |
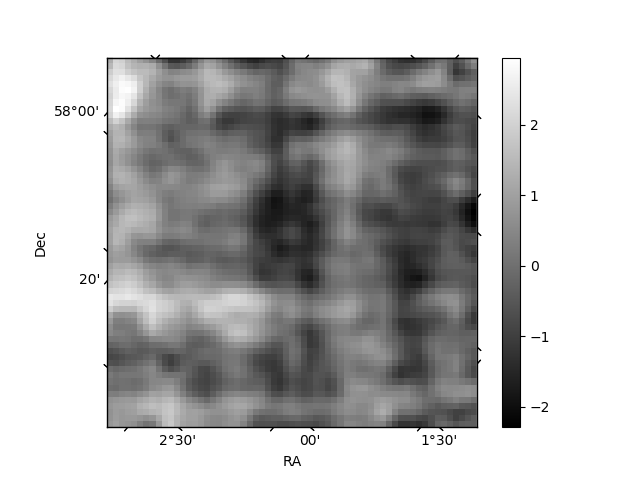
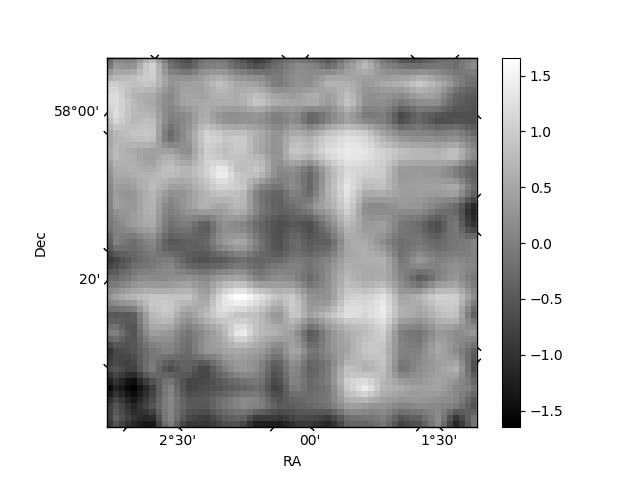
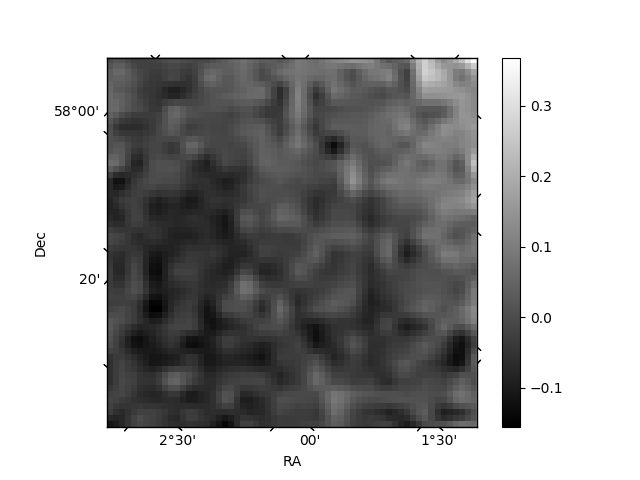
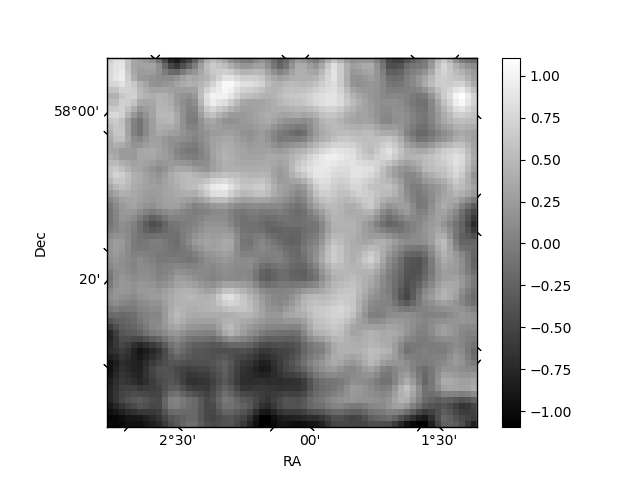
Histogram calculated using DETX and DETY for each event in the final _common_clean file
| Quadrant A | 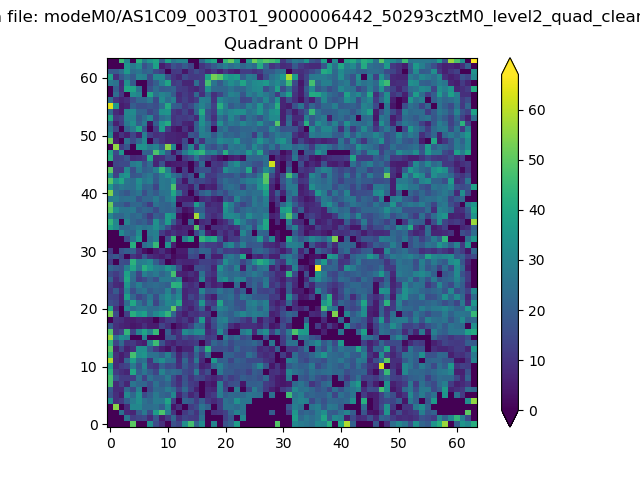 |
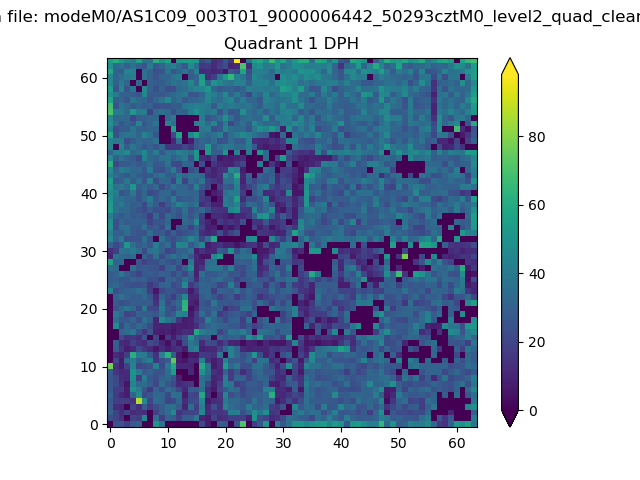 |
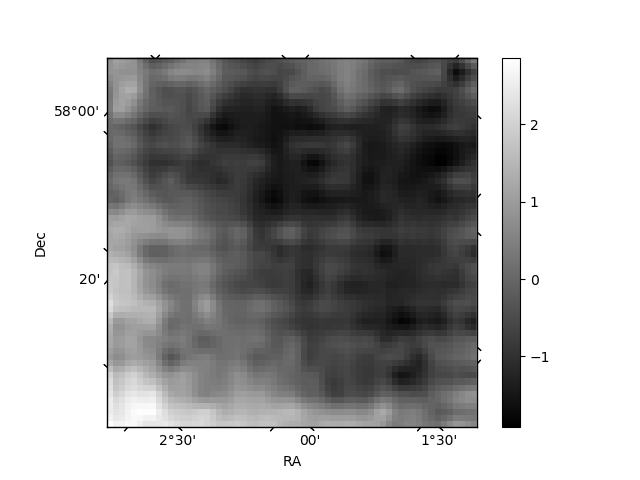
Quadrant B |
|---|---|---|---|
| Quadrant D | 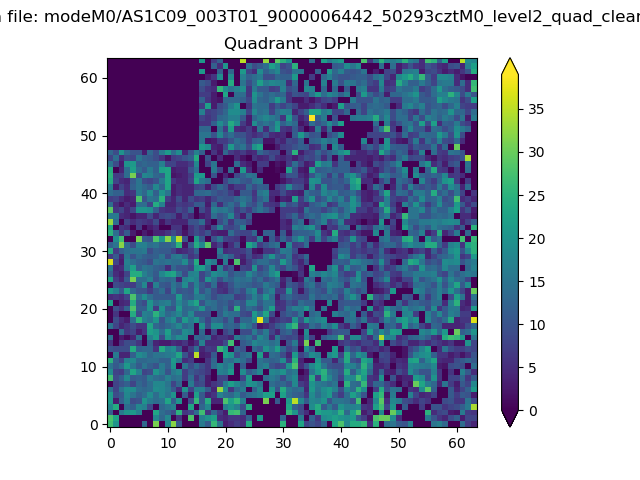 |
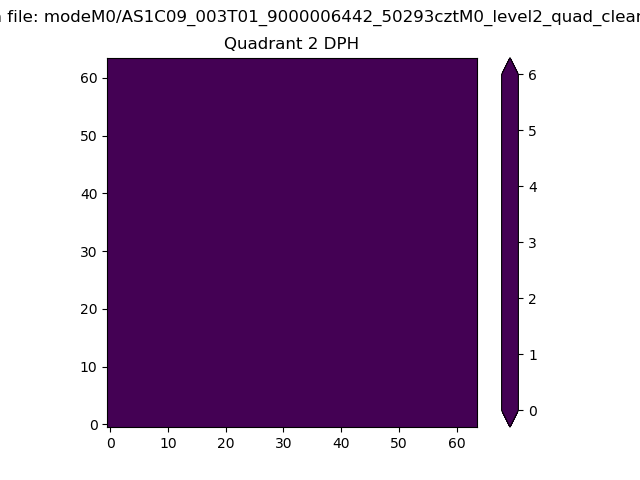 |
Quadrant C |
| Plot type | Count rate plots | Images |
|---|---|---|
| Comparison with Poisson distribution Blue bars denote a histogram of data divided into 1 sec bins. Red curve is a Poisson curve with rate = median count rate of data. |
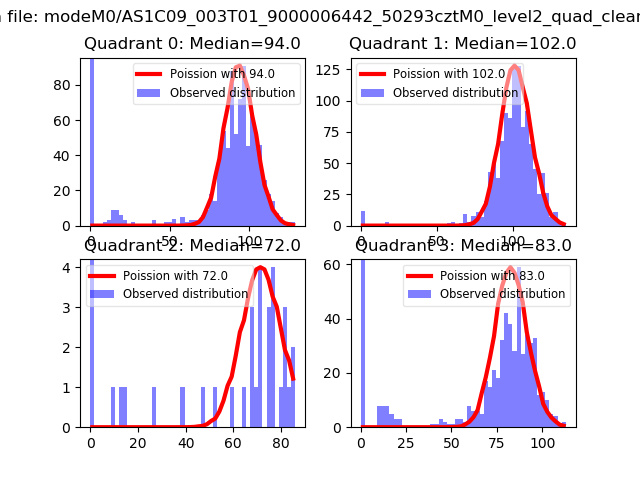 |
 |
| Quadrant-wise count rates Data is divided into 100 sec bins |
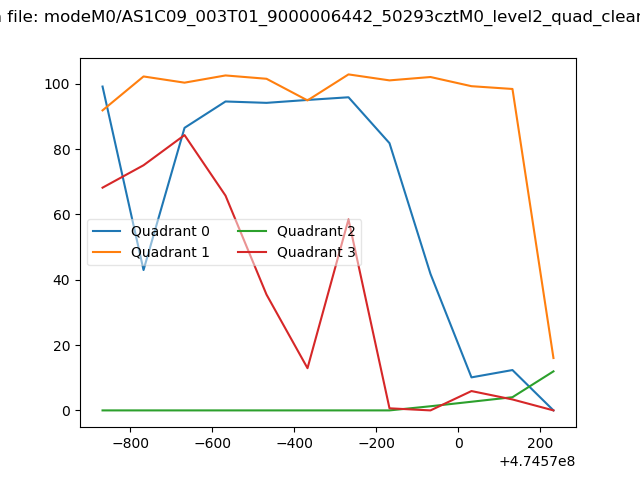 |
|
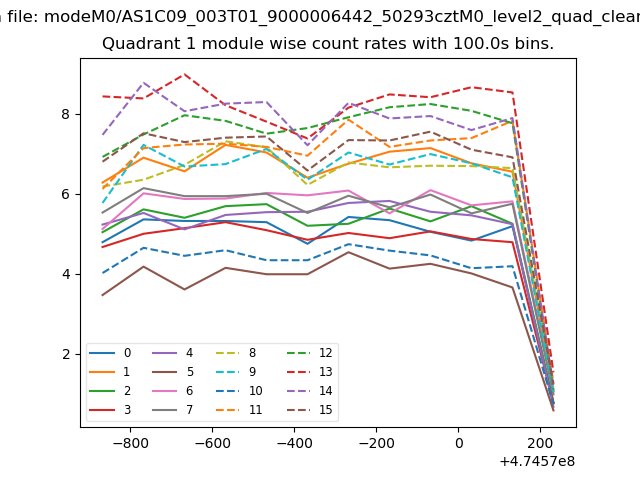
| Module-wise count rates for Quadrant A Data is divided into 100 sec bins |
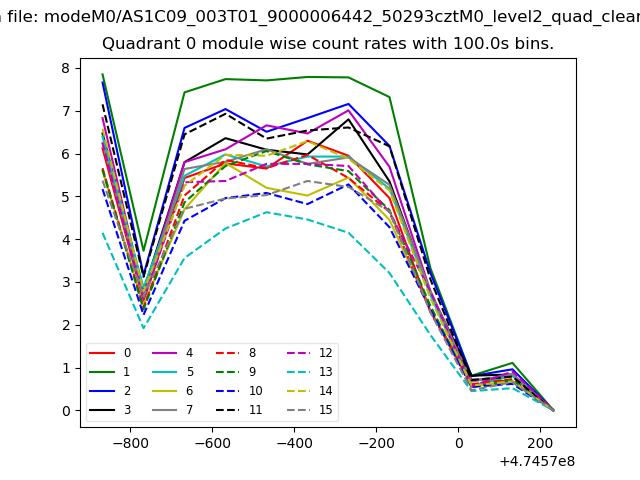 |
 |
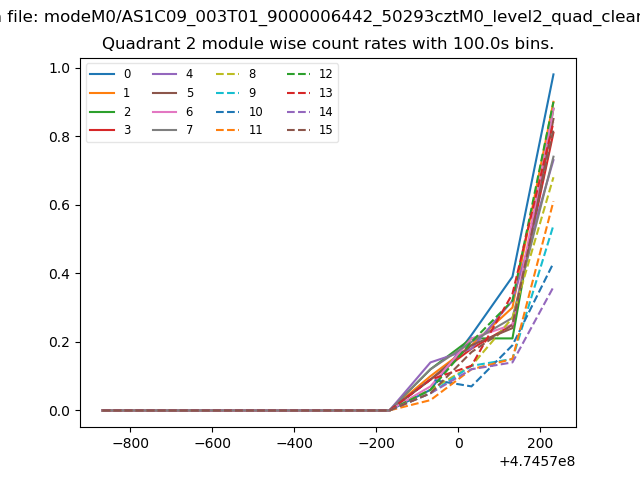
| Module-wise count rates for Quadrant B Data is divided into 100 sec bins |
 |
 |
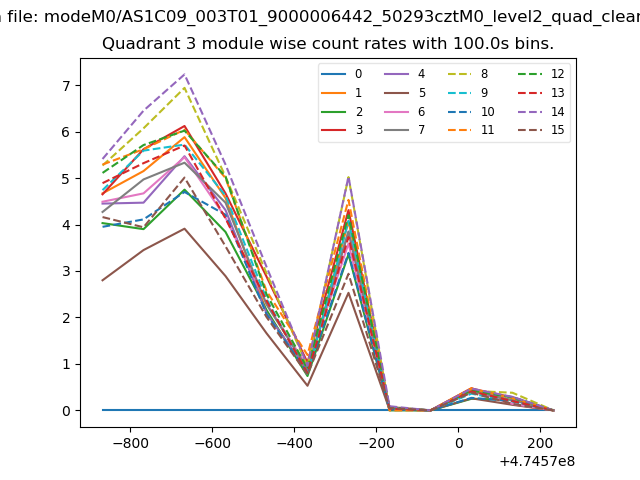
| Module-wise count rates for Quadrant C Data is divided into 100 sec bins |
 |
 |
| Module-wise count rates for Quadrant D Data is divided into 100 sec bins |
 |
 |
| Parameter | Plot |
|---|---|
| CZT HV Monitor | 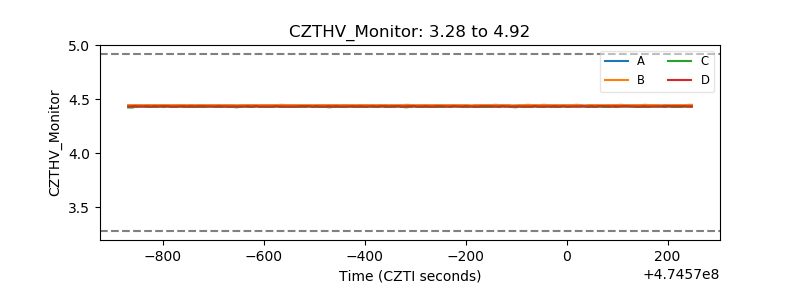 |
| D_VDD | 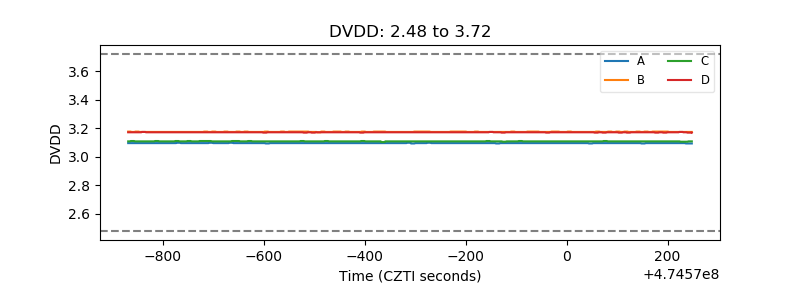 |
| Temperature 1 | 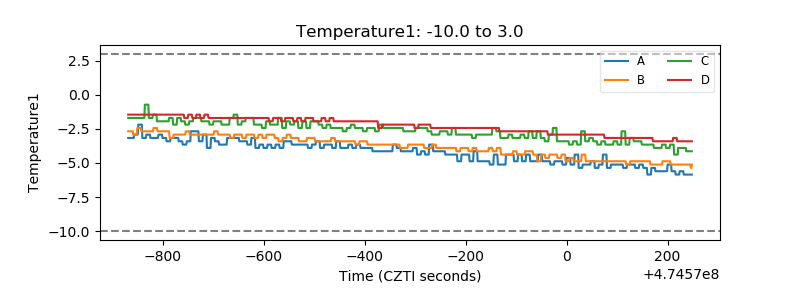 |
| Veto HV Monitor | 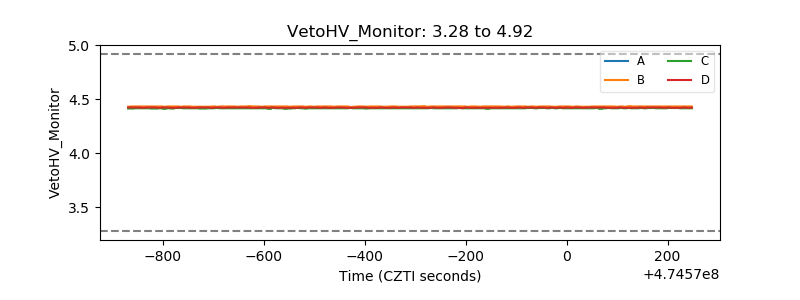 |
| Veto LLD | 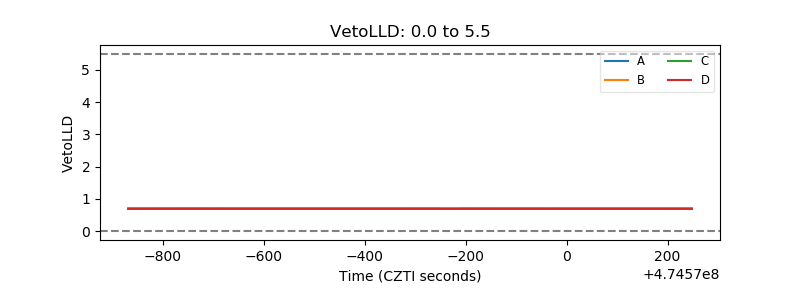 |
| Alpha Counter | 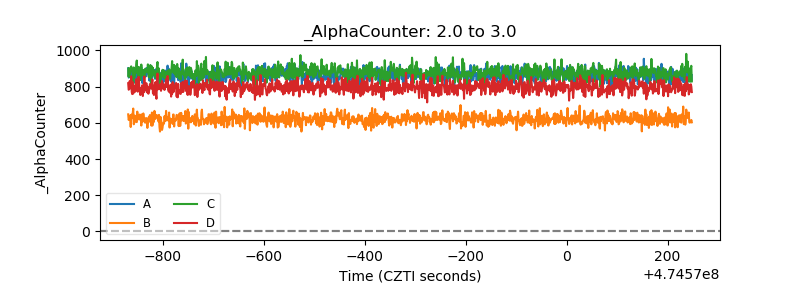 |
| _CPM_Rate | 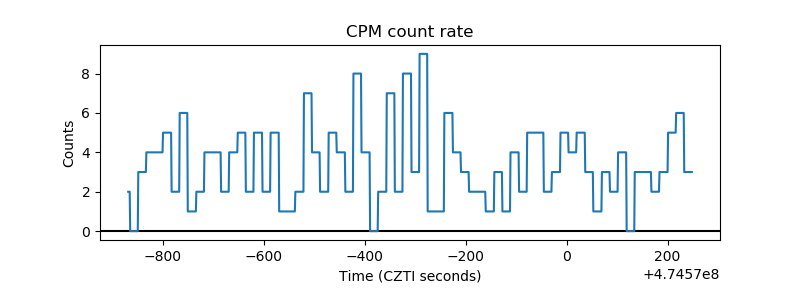 |
| CZT Counter | 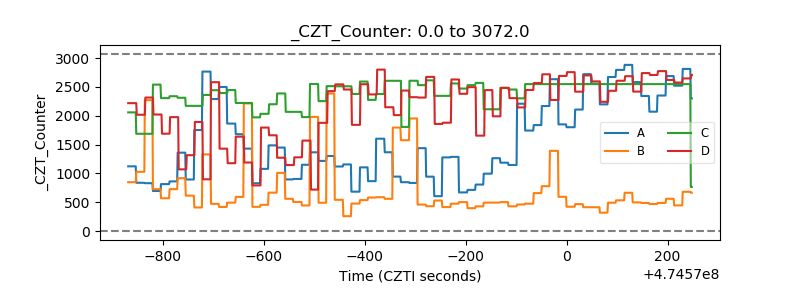 |
| +2.5 Volts monitor |  |
| +5 Volts monitor |  |
| _ROLL_ROT | 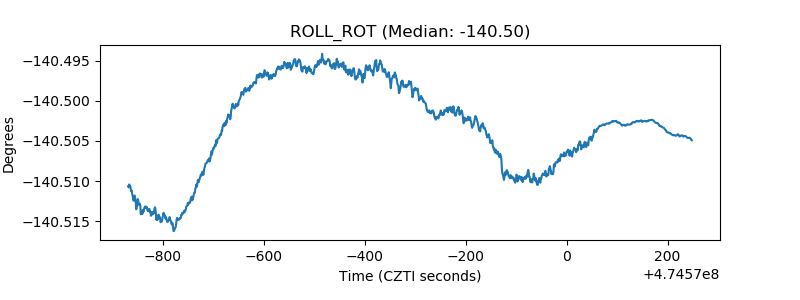 |
| _Roll_DEC | 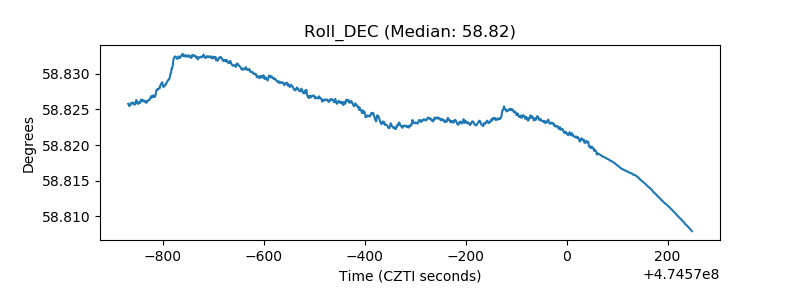 |
| _Roll_RA | 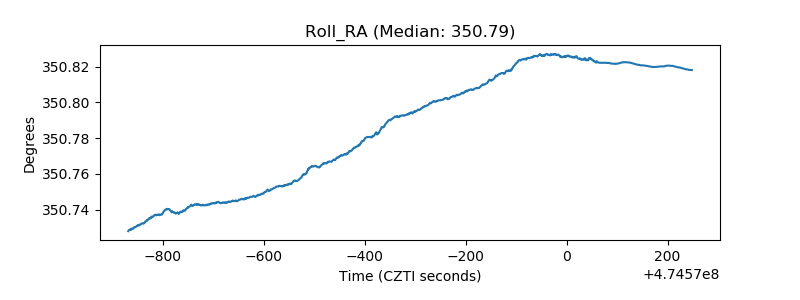 |
| Veto Counter | 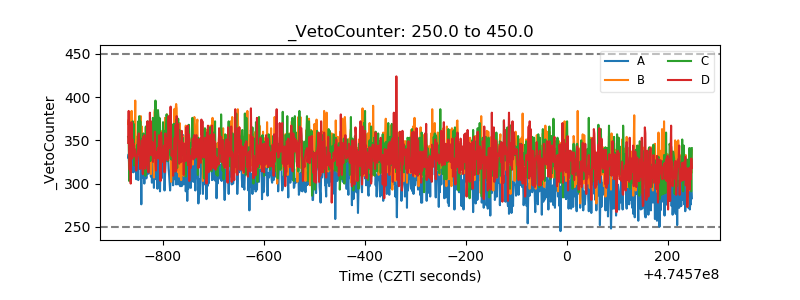 |