| Param | Original file | Final file |
|---|---|---|
| Filename | modeM0/AS1C09_003T01_9000006442_50294cztM0_level2.fits | modeM0/AS1C09_003T01_9000006442_50294cztM0_level2_quad_clean.evt |
| Size (bytes) | 1,508,552,640 | 47,108,160 |
| Size | 1.4 GB | 44.9 MB |
| Events in quadrant A | 17,131,924 | 139,319 |
| Events in quadrant B | 5,093,035 | 708,916 |
| Events in quadrant C | 16,211,588 | 35,526 |
| Events in quadrant D | 16,852,241 | 41,230 |
| Mode M0 | |||
|---|---|---|---|
| Quadrant | BADHDUFLAG | Total packets | Discarded packets |
| A | 0 | 55653 | 0 |
| B | 0 | 20078 | 5 |
| C | 0 | 53046 | 0 |
| D | 0 | 54907 | 0 |
| Mode SS | |||
|---|---|---|---|
| Quadrant | BADHDUFLAG | Total packets | Discarded packets |
| A | 0 | 144 | 0 |
| B | 0 | 144 | 0 |
| C | 0 | 144 | 0 |
| D | 0 | 144 | 0 |
| Quadrant | Total seconds | Saturated seconds | Saturation percentage |
|---|---|---|---|
| A | 7196 | 5824 | 80.933852% |
| B | 7195 | 396 | 5.503822% |
| C | 7195 | 6819 | 94.774149% |
| D | 7195 | 6767 | 94.051425% |
Noise dominated data is calculated using 1-second bins in cleaned event files. If a bin has >2000 counts, and if more than 50% of those come from <1% of pixels, then it is considered to be noise-dominated and hence unusable.
| Quadrant | # 1 sec bins | Bins with >0 counts | Bins with >2000 counts | High rate bins dominated by noise | Noise dominated (total time) | Noise dominated (detector-on time) | Marked lightcurve |
|---|---|---|---|---|---|---|---|
| A | 7196 | 7196 | 5388 | 5388 | 74.87% | 74.87% | 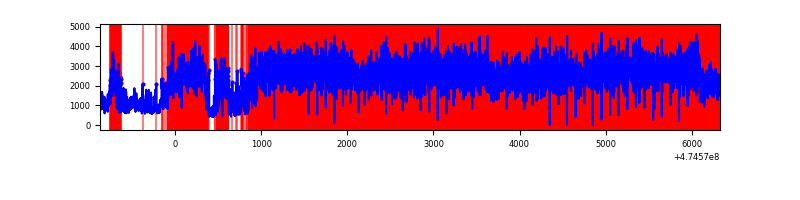 |
| B | 7195 | 7195 | 230 | 230 | 3.20% | 3.20% | 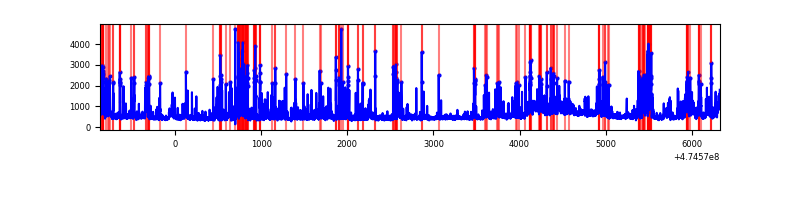 |
| C | 7194 | 7192 | 5203 | 5203 | 72.32% | 72.34% | 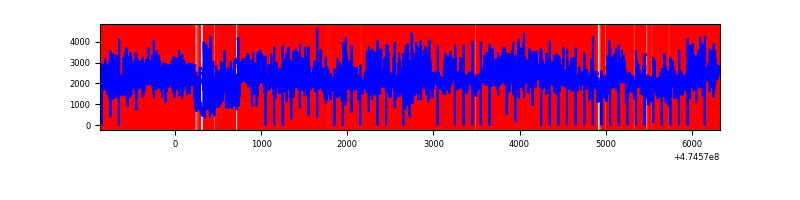 |
| D | 7194 | 7192 | 5956 | 5956 | 82.79% | 82.81% | 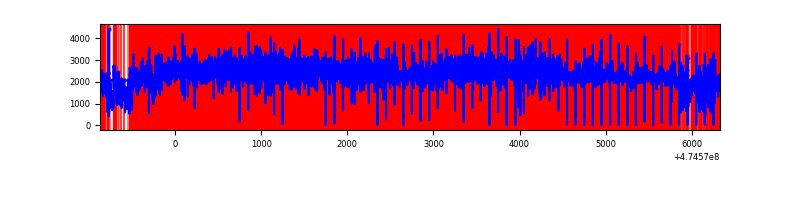 |
Top three noisy pixels from each quadrant. If the there are fewer than three noisy pixels in the level2.evt file, extra rows are filled as -1
| Pixel properties | Quadrant properties | ||||||
|---|---|---|---|---|---|---|---|
| Quadrant | DetID | PixID | Counts | Sigma | Mean | Median | Sigma |
| A | 6 | 250 | 12684615 | 142996.76 | 350 | 342 | 88.7 |
| A | 0 | 98 | 1679082 | 18925.36 | 350 | 342 | 88.7 |
| A | 12 | 250 | 517319 | 5828.17 | 350 | 342 | 88.7 |
| B | 4 | 206 | 1096913 | 6856.08 | 755 | 731 | 159.9 |
| B | 1 | 238 | 297081 | 1853.52 | 755 | 731 | 159.9 |
| B | 0 | 172 | 253929 | 1583.63 | 755 | 731 | 159.9 |
| C | 15 | 197 | 9076593 | 165161.38 | 176 | 173 | 55.0 |
| C | 4 | 111 | 3094973 | 56315.31 | 176 | 173 | 55.0 |
| C | 15 | 127 | 1526172 | 27768.23 | 176 | 173 | 55.0 |
| D | 7 | 61 | 13356577 | 199947.71 | 225 | 215 | 66.8 |
| D | 15 | 108 | 575028 | 8605.08 | 225 | 215 | 66.8 |
| D | 2 | 37 | 319247 | 4775.98 | 225 | 215 | 66.8 |
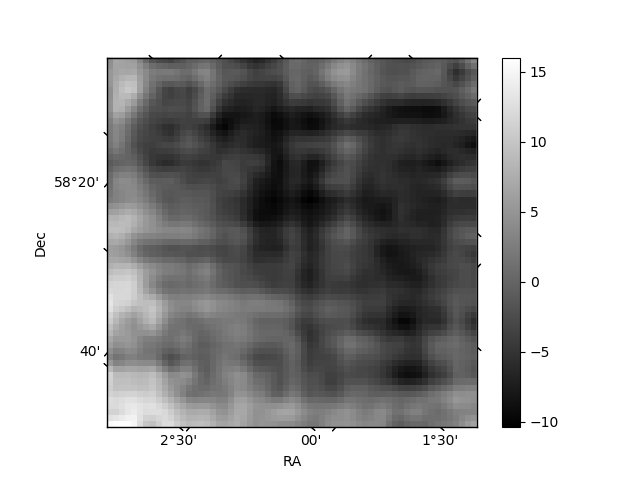
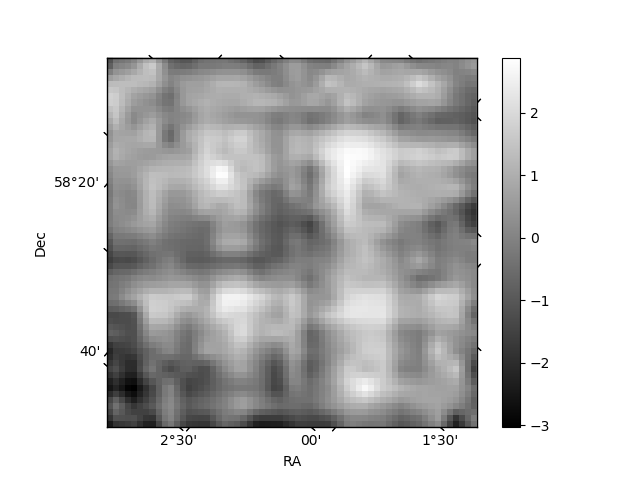
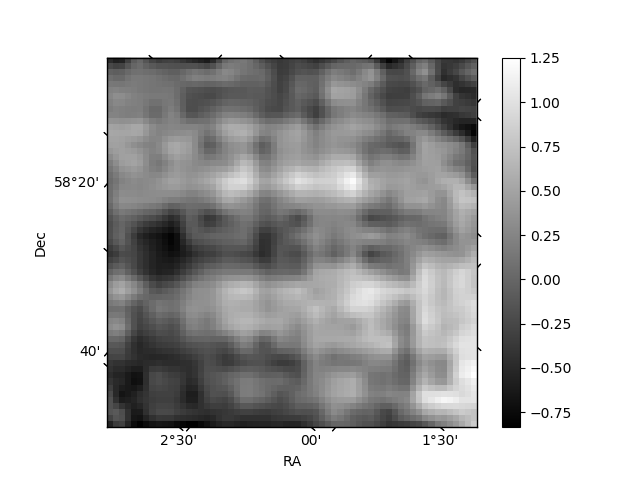
Histogram calculated using DETX and DETY for each event in the final _common_clean file
| Quadrant A | 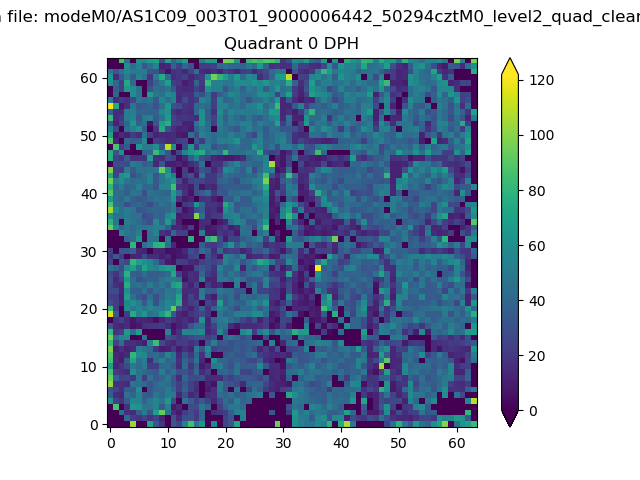 |
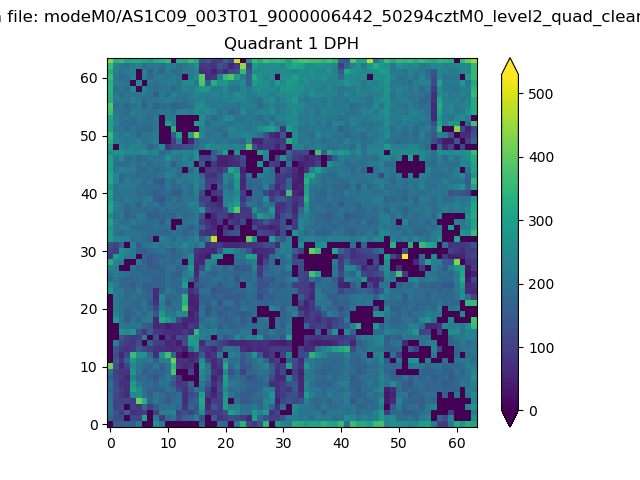 |
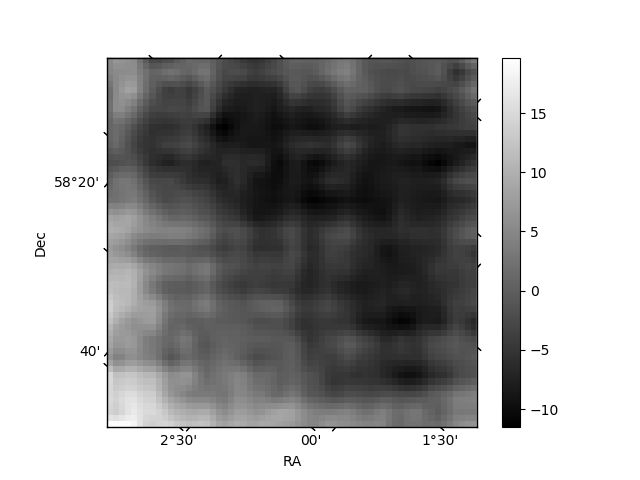
Quadrant B |
|---|---|---|---|
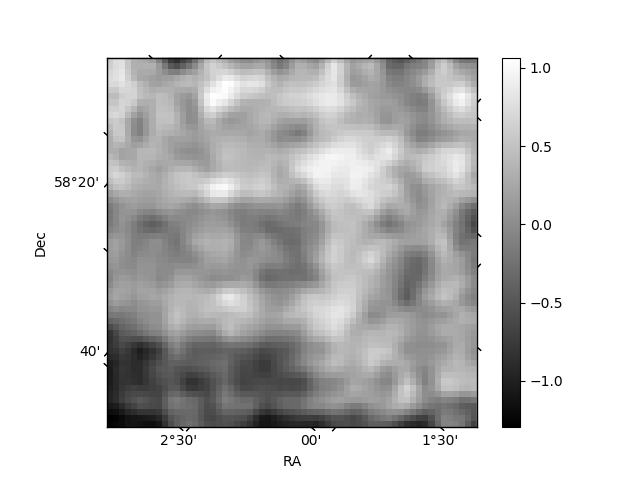
| Quadrant D | 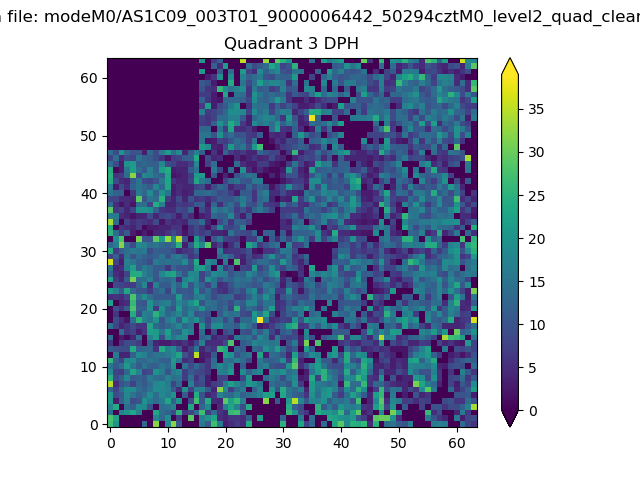 |
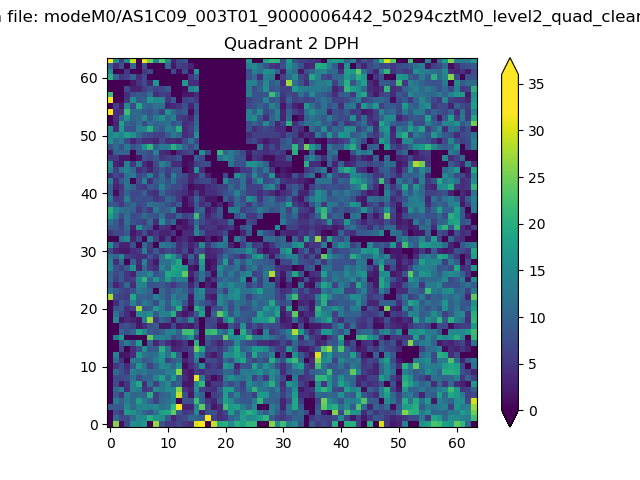 |
Quadrant C |
| Plot type | Count rate plots | Images |
|---|---|---|
| Comparison with Poisson distribution Blue bars denote a histogram of data divided into 1 sec bins. Red curve is a Poisson curve with rate = median count rate of data. |
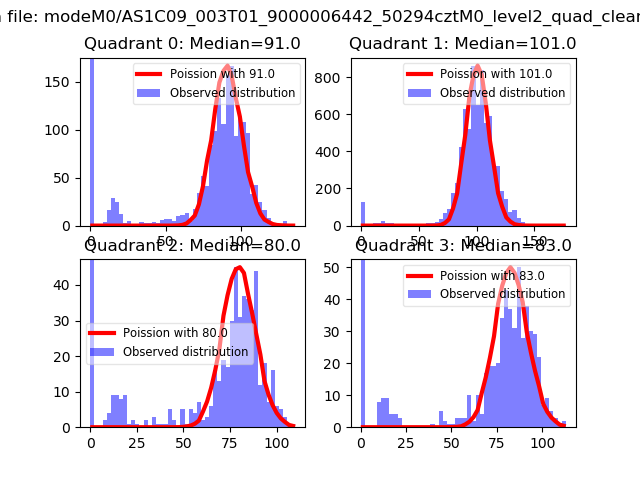 |
 |
| Quadrant-wise count rates Data is divided into 100 sec bins |
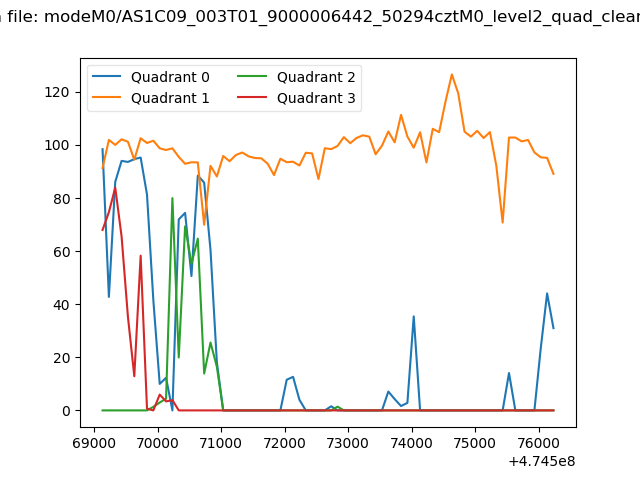 |
|
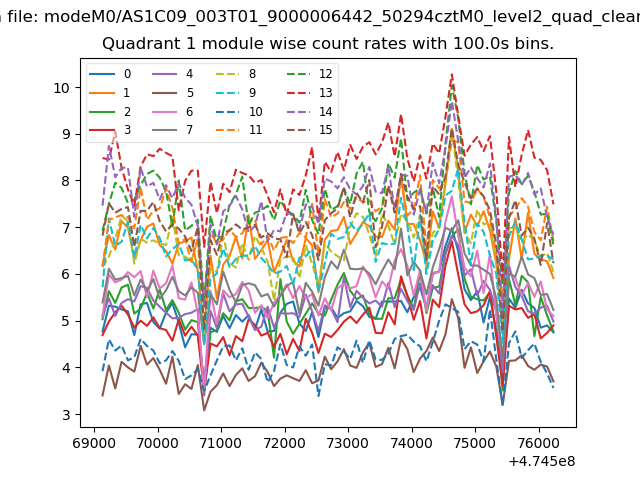
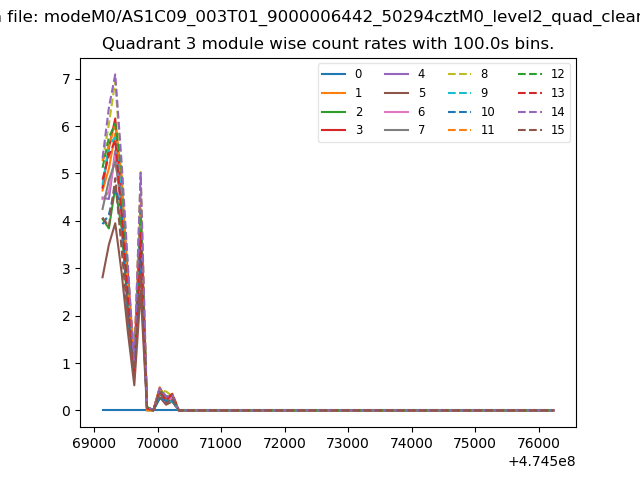
| Module-wise count rates for Quadrant A Data is divided into 100 sec bins |
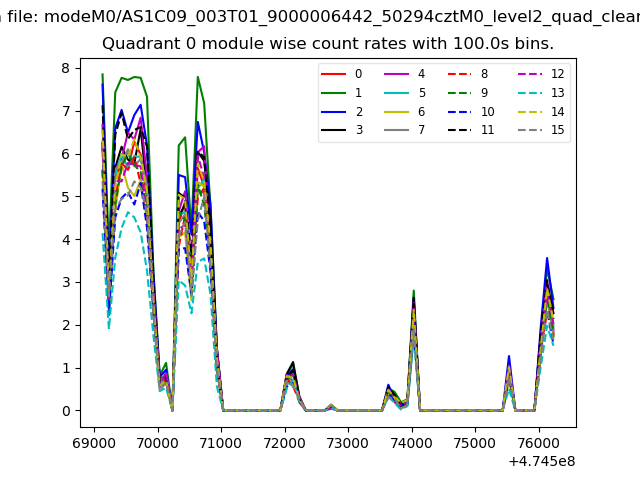 |
 |
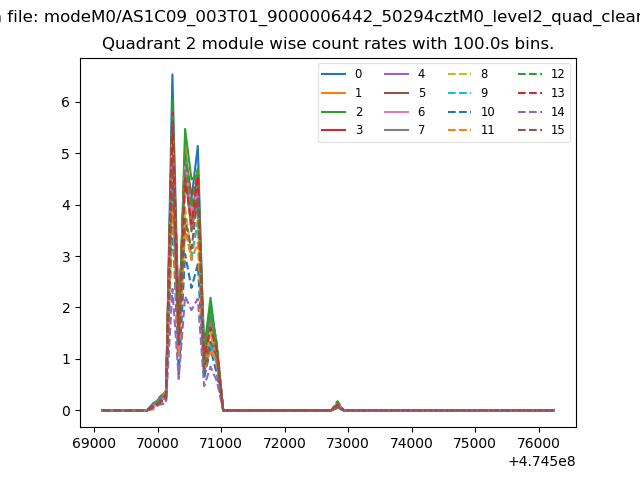
| Module-wise count rates for Quadrant B Data is divided into 100 sec bins |
 |
 |
| Module-wise count rates for Quadrant C Data is divided into 100 sec bins |
 |
 |
| Module-wise count rates for Quadrant D Data is divided into 100 sec bins |
 |
 |
| Parameter | Plot |
|---|---|
| CZT HV Monitor | 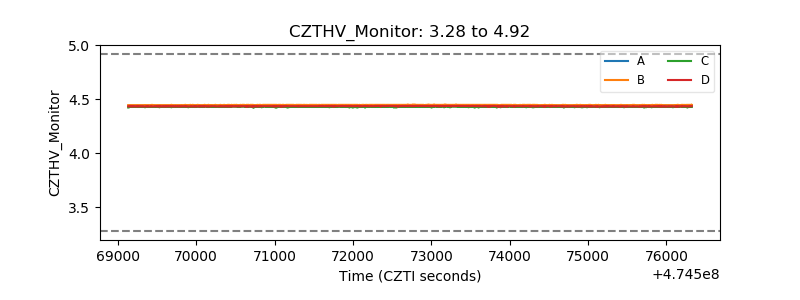 |
| D_VDD | 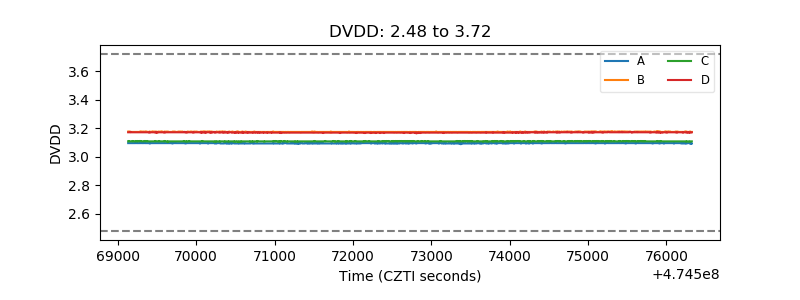 |
| Temperature 1 | 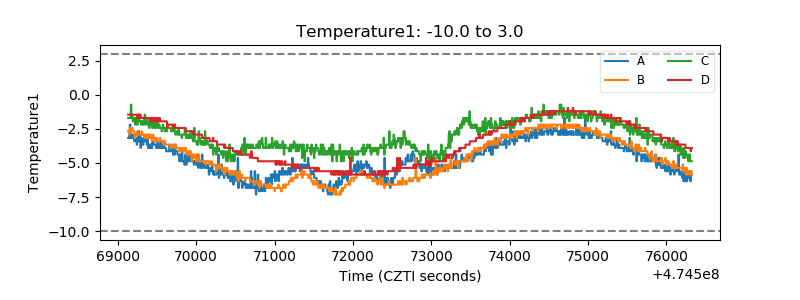 |
| Veto HV Monitor | 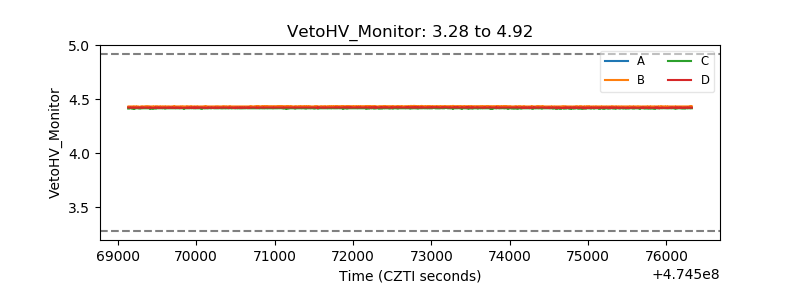 |
| Veto LLD | 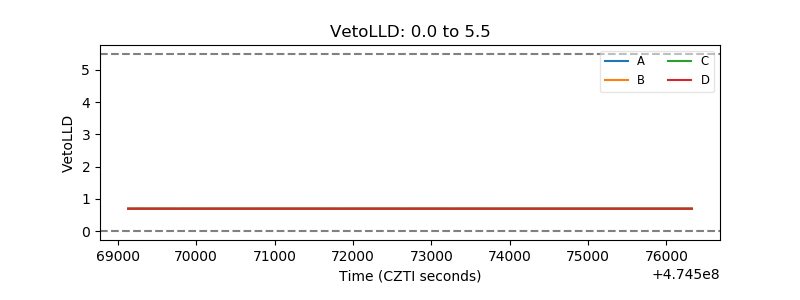 |
| Alpha Counter | 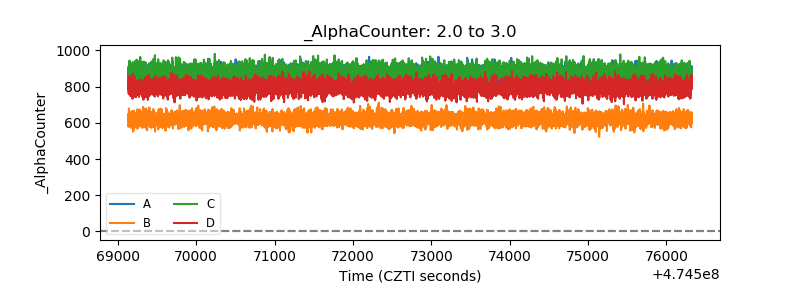 |
| _CPM_Rate | 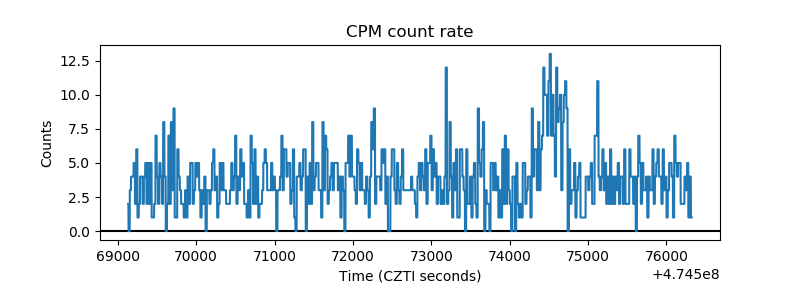 |
| CZT Counter | 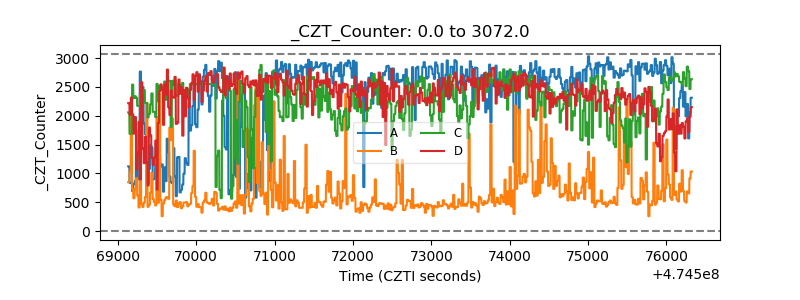 |
| +2.5 Volts monitor | 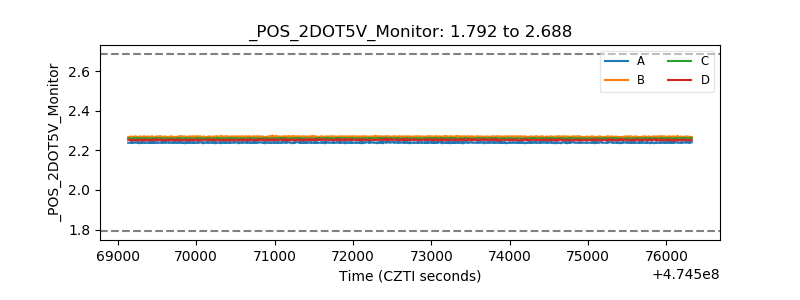 |
| +5 Volts monitor | 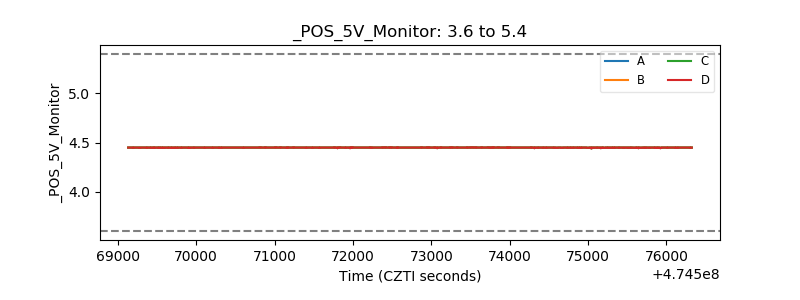 |
| _ROLL_ROT | 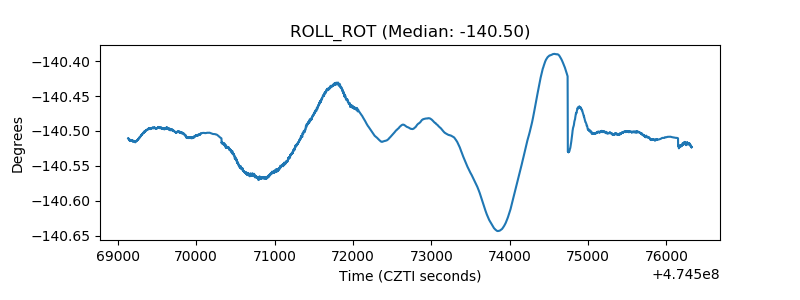 |
| _Roll_DEC | 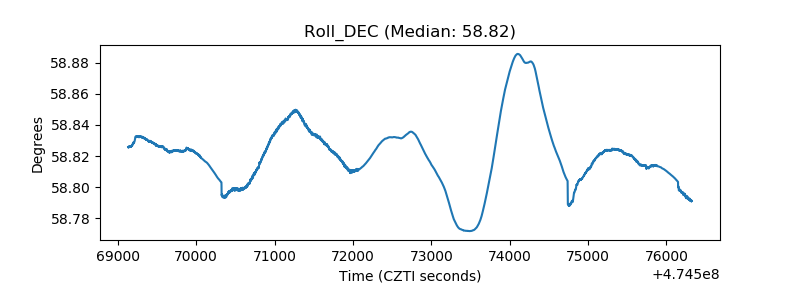 |
| _Roll_RA | 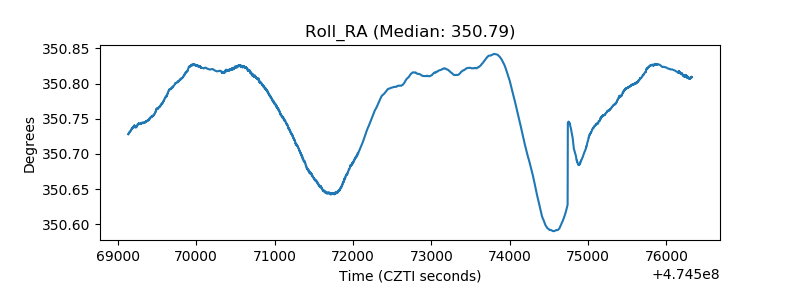 |
| Veto Counter | 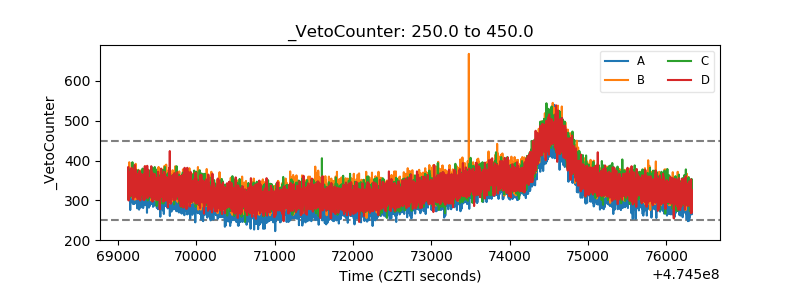 |