| Param | Original file | Final file |
|---|---|---|
| Filename | modeM0/AS1C09_003T01_9000006442_50295cztM0_level2.fits | modeM0/AS1C09_003T01_9000006442_50295cztM0_level2_quad_clean.evt |
| Size (bytes) | 1,498,501,440 | 42,880,320 |
| Size | 1.4 GB | 40.9 MB |
| Events in quadrant A | 18,892,600 | 63,100 |
| Events in quadrant B | 5,250,534 | 721,608 |
| Events in quadrant C | 16,213,881 | 1,802 |
| Events in quadrant D | 14,546,744 | 108 |
| Mode M0 | |||
|---|---|---|---|
| Quadrant | BADHDUFLAG | Total packets | Discarded packets |
| A | 0 | 60961 | 0 |
| B | 0 | 20721 | 0 |
| C | 0 | 53197 | 0 |
| D | 0 | 48219 | 0 |
| Mode SS | |||
|---|---|---|---|
| Quadrant | BADHDUFLAG | Total packets | Discarded packets |
| A | 0 | 148 | 0 |
| B | 0 | 148 | 0 |
| C | 0 | 148 | 0 |
| D | 0 | 148 | 0 |
| Quadrant | Total seconds | Saturated seconds | Saturation percentage |
|---|---|---|---|
| A | 7340 | 6798 | 92.615804% |
| B | 7340 | 324 | 4.414169% |
| C | 7341 | 7326 | 99.795668% |
| D | 7340 | 7339 | 99.986376% |
Noise dominated data is calculated using 1-second bins in cleaned event files. If a bin has >2000 counts, and if more than 50% of those come from <1% of pixels, then it is considered to be noise-dominated and hence unusable.
| Quadrant | # 1 sec bins | Bins with >0 counts | Bins with >2000 counts | High rate bins dominated by noise | Noise dominated (total time) | Noise dominated (detector-on time) | Marked lightcurve |
|---|---|---|---|---|---|---|---|
| A | 7340 | 7340 | 6253 | 6253 | 85.19% | 85.19% | 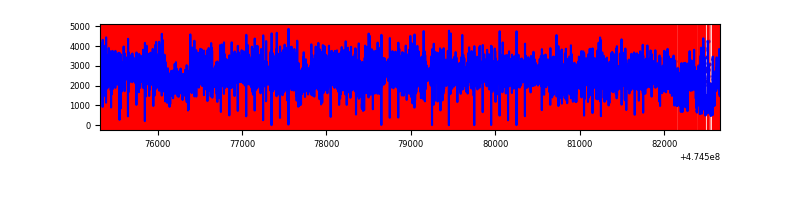 |
| B | 7340 | 7340 | 194 | 194 | 2.64% | 2.64% | 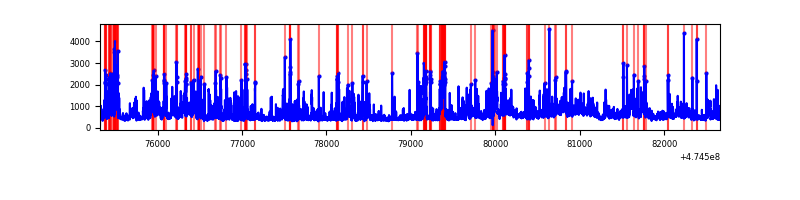 |
| C | 7340 | 7339 | 5081 | 5081 | 69.22% | 69.23% | 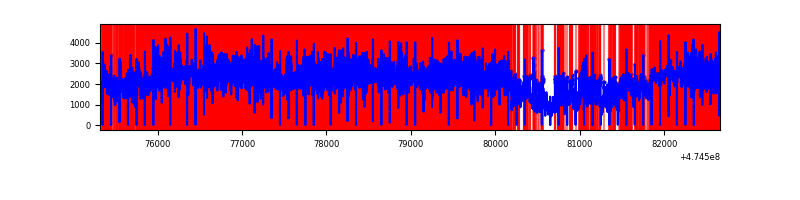 |
| D | 7339 | 7333 | 3899 | 3899 | 53.13% | 53.17% | 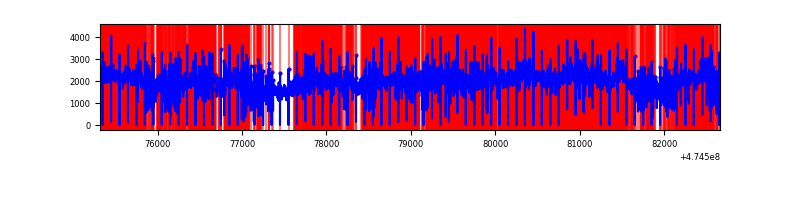 |
Top three noisy pixels from each quadrant. If the there are fewer than three noisy pixels in the level2.evt file, extra rows are filled as -1
| Pixel properties | Quadrant properties | ||||||
|---|---|---|---|---|---|---|---|
| Quadrant | DetID | PixID | Counts | Sigma | Mean | Median | Sigma |
| A | 6 | 250 | 9242989 | 118430.71 | 301 | 293 | 78.0 |
| A | 0 | 98 | 7198577 | 92234.76 | 301 | 293 | 78.0 |
| A | 12 | 250 | 262143 | 3355.2 | 301 | 293 | 78.0 |
| B | 4 | 206 | 1280276 | 7845.65 | 763 | 736 | 163.1 |
| B | 0 | 172 | 224204 | 1370.22 | 763 | 736 | 163.1 |
| B | 1 | 238 | 115722 | 705.05 | 763 | 736 | 163.1 |
| C | 15 | 197 | 5534755 | 131211.57 | 129 | 126 | 42.2 |
| C | 4 | 111 | 2984583 | 70753.66 | 129 | 126 | 42.2 |
| C | 15 | 127 | 1796989 | 42598.92 | 129 | 126 | 42.2 |
| D | 7 | 61 | 12165357 | 327858.34 | 107 | 101 | 37.1 |
| D | 15 | 108 | 473828 | 12767.13 | 107 | 101 | 37.1 |
| D | 7 | 126 | 170923 | 4603.72 | 107 | 101 | 37.1 |
Histogram calculated using DETX and DETY for each event in the final _common_clean file
| Quadrant A | 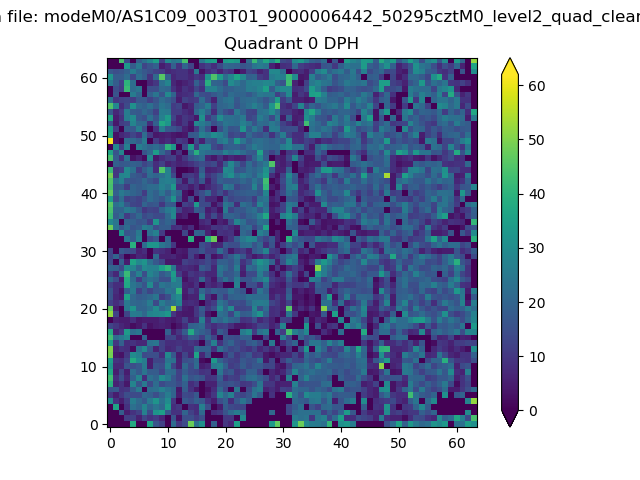 |
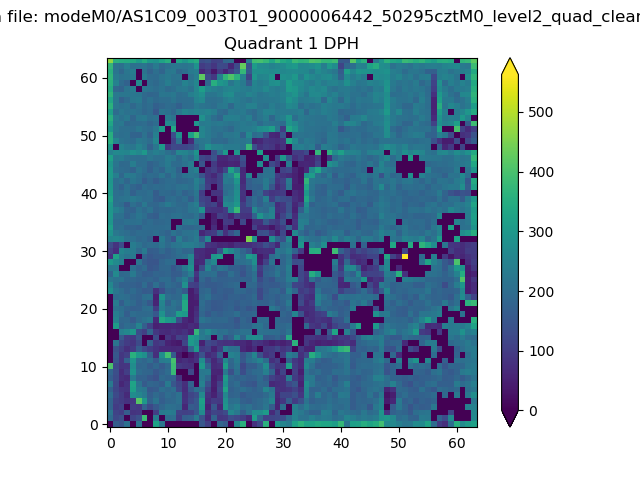 |
Quadrant B |
|---|---|---|---|
| Quadrant D |  |
 |
Quadrant C |
| Plot type | Count rate plots | Images |
|---|---|---|
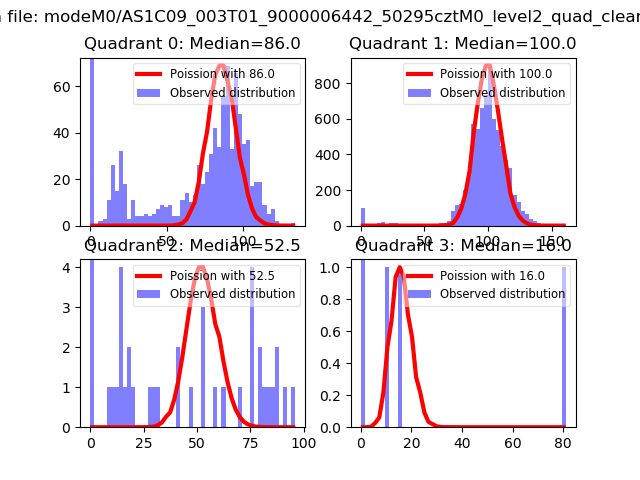
| Comparison with Poisson distribution Blue bars denote a histogram of data divided into 1 sec bins. Red curve is a Poisson curve with rate = median count rate of data. |
 |
 |
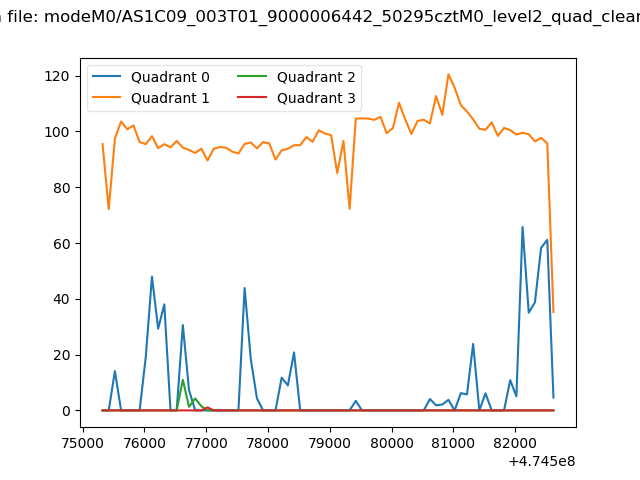
| Quadrant-wise count rates Data is divided into 100 sec bins |
 |
|
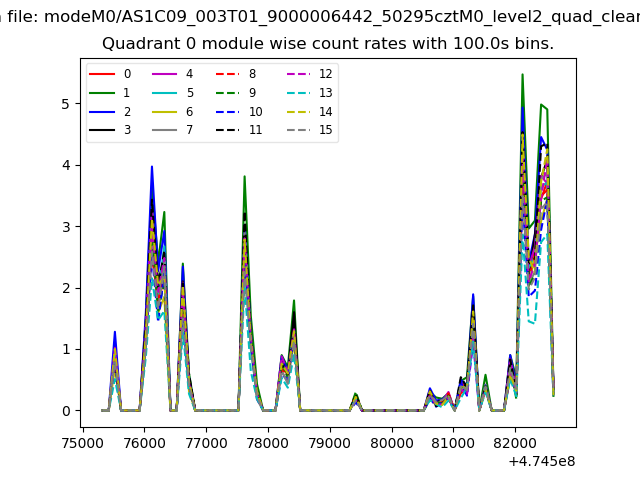
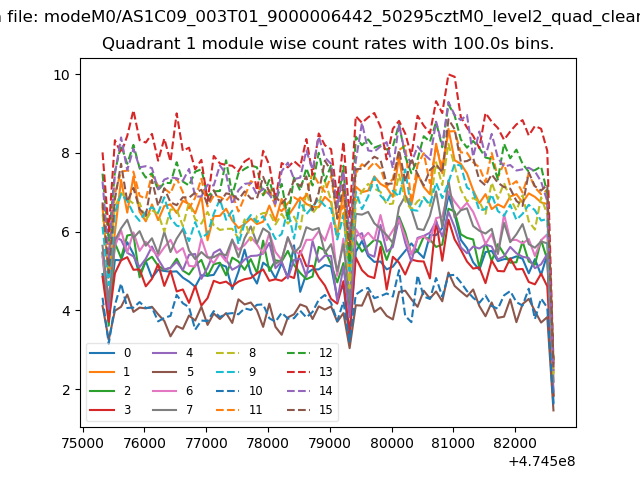
| Module-wise count rates for Quadrant A Data is divided into 100 sec bins |
 |
 |
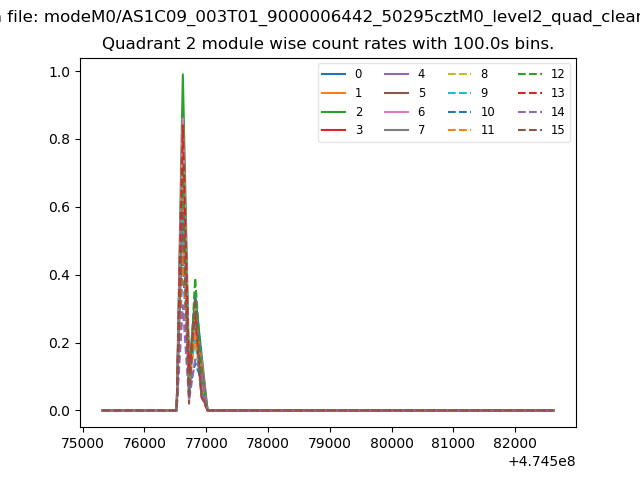
| Module-wise count rates for Quadrant B Data is divided into 100 sec bins |
 |
 |
| Module-wise count rates for Quadrant C Data is divided into 100 sec bins |
 |
 |
| Module-wise count rates for Quadrant D Data is divided into 100 sec bins |
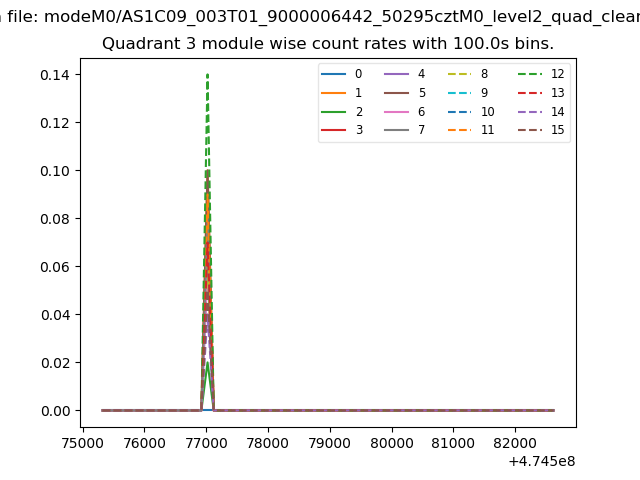 |
 |
| Parameter | Plot |
|---|---|
| CZT HV Monitor | 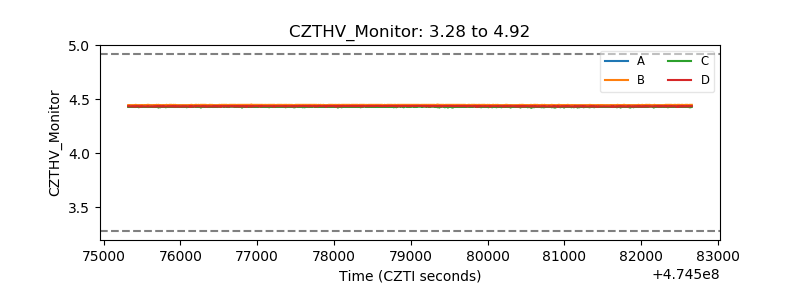 |
| D_VDD | 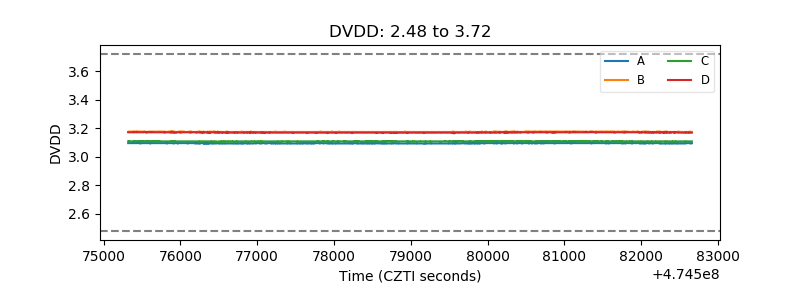 |
| Temperature 1 | 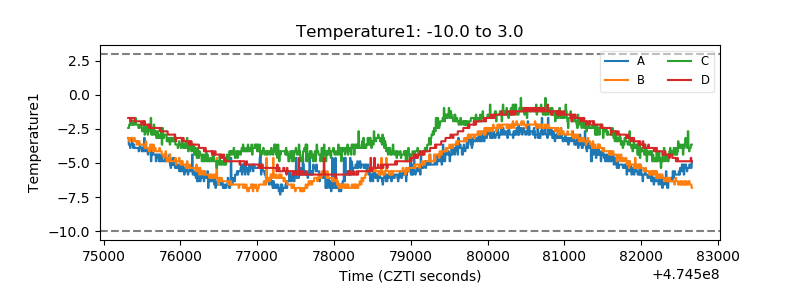 |
| Veto HV Monitor | 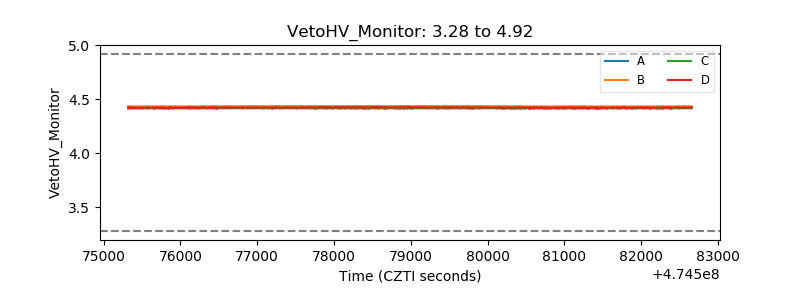 |
| Veto LLD | 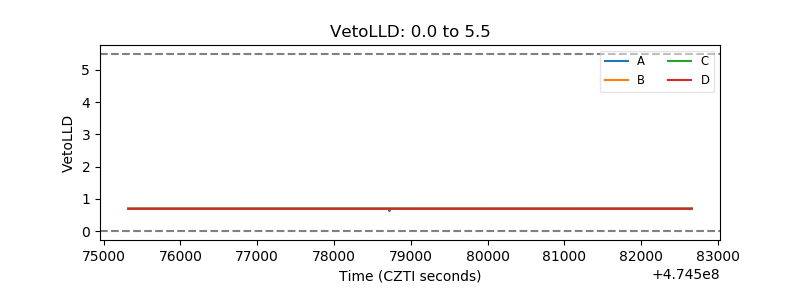 |
| Alpha Counter | 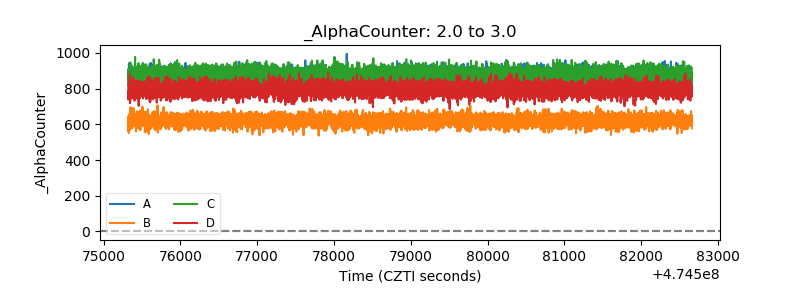 |
| _CPM_Rate | 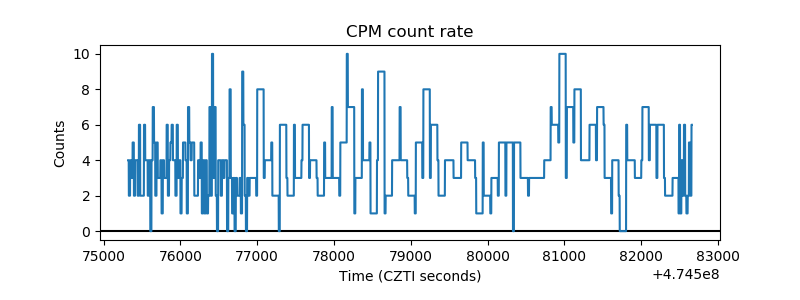 |
| CZT Counter | 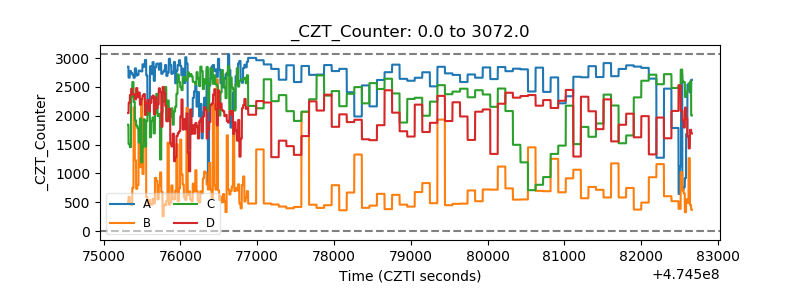 |
| +2.5 Volts monitor | 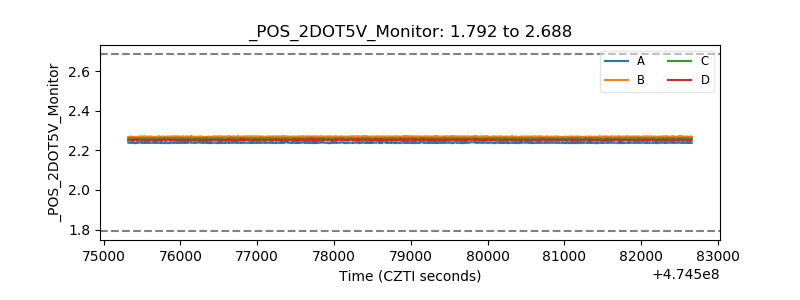 |
| +5 Volts monitor |  |
| _ROLL_ROT | 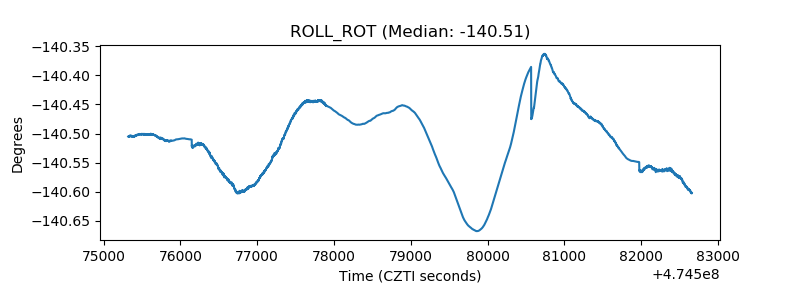 |
| _Roll_DEC | 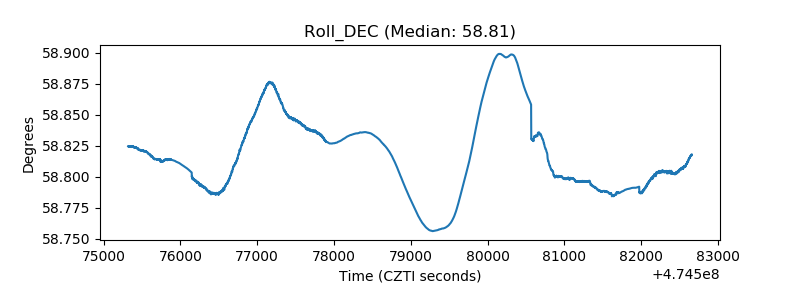 |
| _Roll_RA | 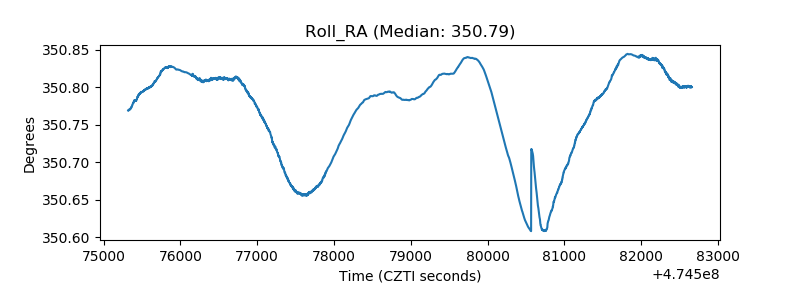 |
| Veto Counter | 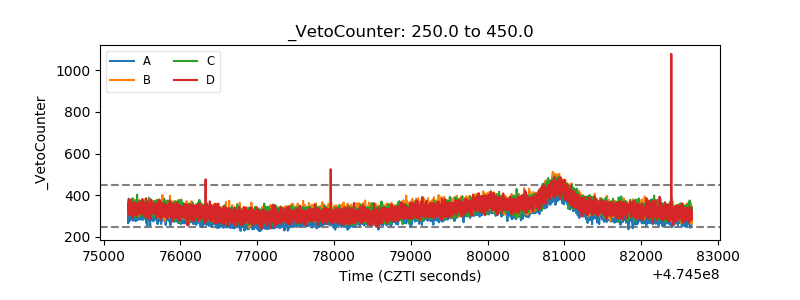 |