| Param | Original file | Final file |
|---|---|---|
| Filename | modeM0/AS1C09_003T01_9000006442_50299cztM0_level2.fits | modeM0/AS1C09_003T01_9000006442_50299cztM0_level2_quad_clean.evt |
| Size (bytes) | 2,317,440,960 | 109,926,720 |
| Size | 2.2 GB | 104.8 MB |
| Events in quadrant A | 17,930,760 | 928,915 |
| Events in quadrant B | 12,626,689 | 1,141,095 |
| Events in quadrant C | 24,445,439 | 98,136 |
| Events in quadrant D | 29,763,860 | 244,671 |
| Mode M9 | |||
|---|---|---|---|
| Quadrant | BADHDUFLAG | Total packets | Discarded packets |
| A | 0 | 14 | 0 |
| B | 0 | 14 | 0 |
| C | 0 | 14 | 0 |
| D | 0 | 14 | 0 |
| Mode M0 | |||
|---|---|---|---|
| Quadrant | BADHDUFLAG | Total packets | Discarded packets |
| A | 0 | 62582 | 4 |
| B | 0 | 46659 | 8 |
| C | 0 | 81709 | 4 |
| D | 0 | 97438 | 4 |
| Mode SS | |||
|---|---|---|---|
| Quadrant | BADHDUFLAG | Total packets | Discarded packets |
| A | 0 | 274 | 0 |
| B | 0 | 274 | 0 |
| C | 0 | 274 | 0 |
| D | 0 | 274 | 0 |
| Quadrant | Total seconds | Saturated seconds | Saturation percentage |
|---|---|---|---|
| A | 13221 | 3448 | 26.079722% |
| B | 13221 | 2097 | 15.861130% |
| C | 13221 | 12257 | 92.708570% |
| D | 13221 | 10673 | 80.727630% |
Noise dominated data is calculated using 1-second bins in cleaned event files. If a bin has >2000 counts, and if more than 50% of those come from <1% of pixels, then it is considered to be noise-dominated and hence unusable.
| Quadrant | # 1 sec bins | Bins with >0 counts | Bins with >2000 counts | High rate bins dominated by noise | Noise dominated (total time) | Noise dominated (detector-on time) | Marked lightcurve |
|---|---|---|---|---|---|---|---|
| A | 14776 | 13225 | 3136 | 3136 | 21.22% | 23.71% | 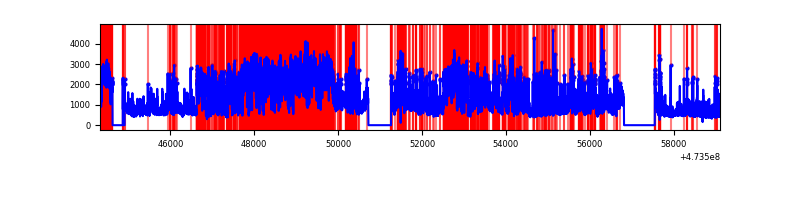 |
| B | 14776 | 13225 | 1338 | 1338 | 9.06% | 10.12% | 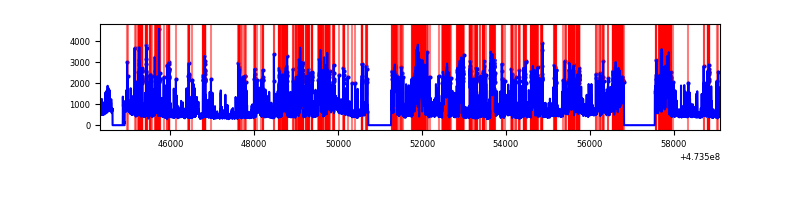 |
| C | 14776 | 13222 | 5283 | 5283 | 35.75% | 39.96% | 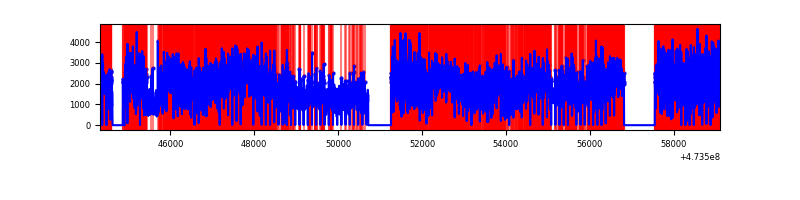 |
| D | 14776 | 13225 | 9845 | 9845 | 66.63% | 74.44% | 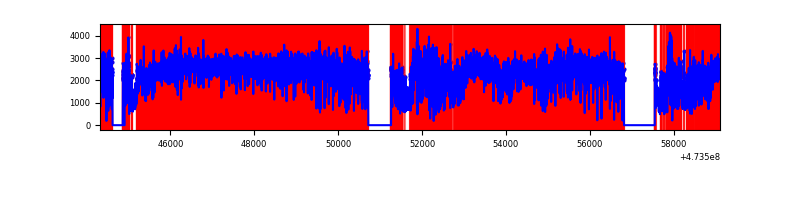 |
Top three noisy pixels from each quadrant. If the there are fewer than three noisy pixels in the level2.evt file, extra rows are filled as -1
| Pixel properties | Quadrant properties | ||||||
|---|---|---|---|---|---|---|---|
| Quadrant | DetID | PixID | Counts | Sigma | Mean | Median | Sigma |
| A | 6 | 250 | 7306575 | 23207.91 | 1275 | 1245 | 314.8 |
| A | 0 | 98 | 1775826 | 5637.57 | 1275 | 1245 | 314.8 |
| A | 3 | 63 | 1292420 | 4101.86 | 1275 | 1245 | 314.8 |
| B | 4 | 206 | 4963615 | 17537.01 | 1336 | 1290 | 283.0 |
| B | 5 | 172 | 694437 | 2449.6 | 1336 | 1290 | 283.0 |
| B | 5 | 185 | 302385 | 1064.08 | 1336 | 1290 | 283.0 |
| C | 15 | 197 | 12815192 | 133636.8 | 326 | 322 | 95.9 |
| C | 4 | 111 | 8346965 | 87040.96 | 326 | 322 | 95.9 |
| C | 1 | 60 | 371058 | 3866.13 | 326 | 322 | 95.9 |
| D | 7 | 61 | 19533393 | 91761.22 | 685 | 653 | 212.9 |
| D | 15 | 108 | 1878120 | 8819.99 | 685 | 653 | 212.9 |
| D | 12 | 6 | 1124988 | 5281.92 | 685 | 653 | 212.9 |
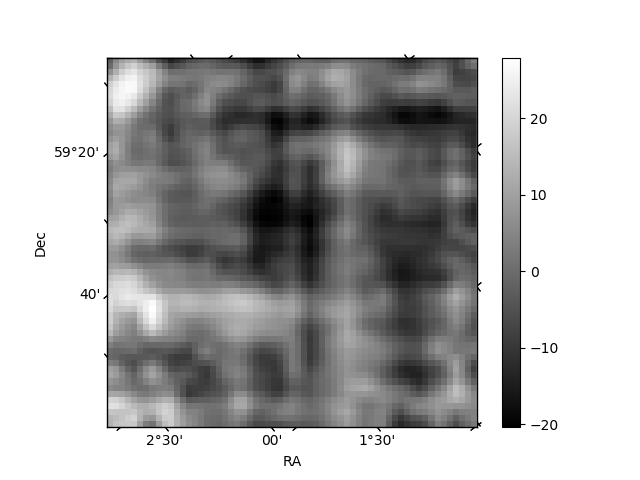
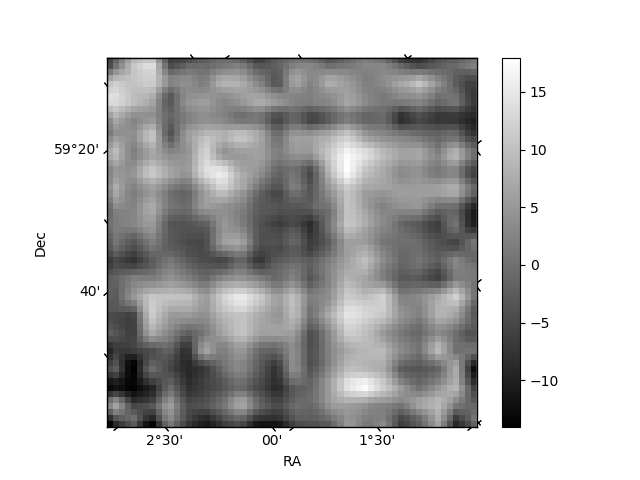
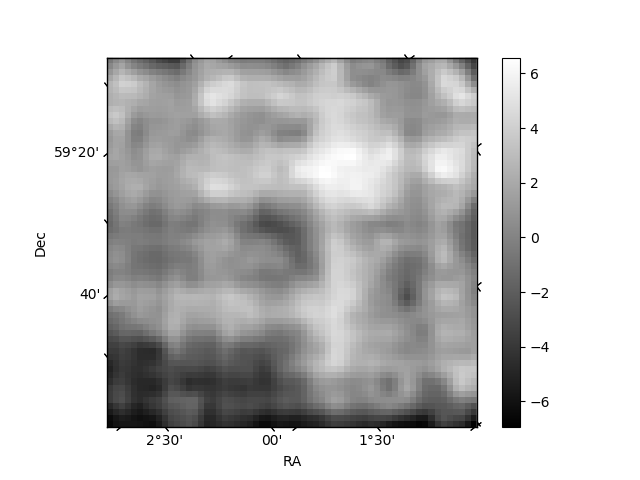
Histogram calculated using DETX and DETY for each event in the final _common_clean file
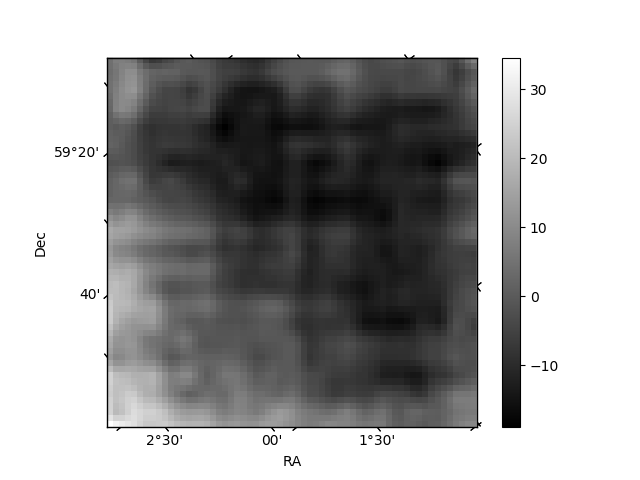
| Quadrant A | 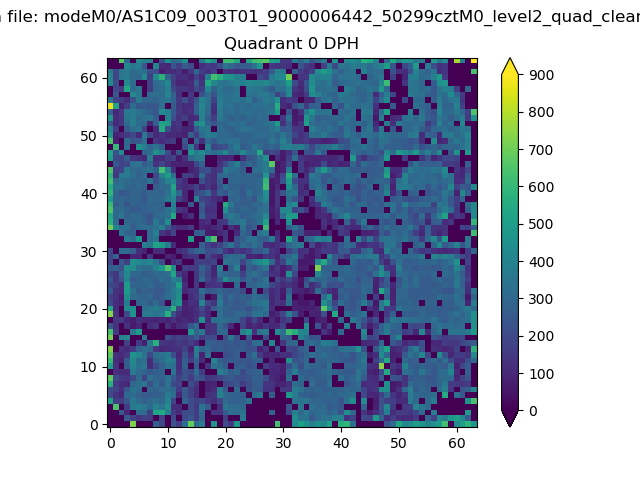 |
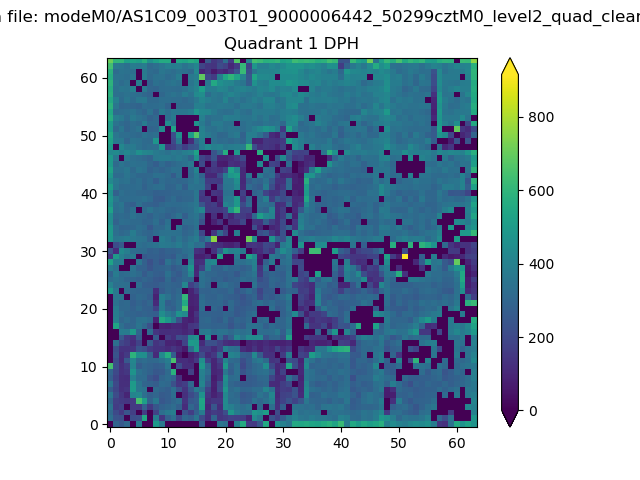 |
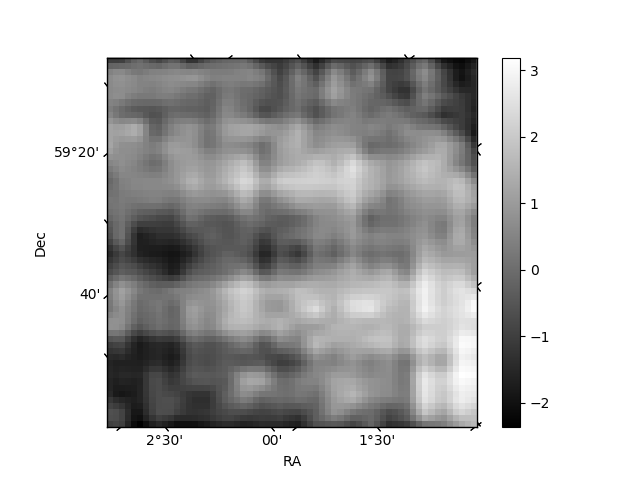
Quadrant B |
|---|---|---|---|
| Quadrant D |  |
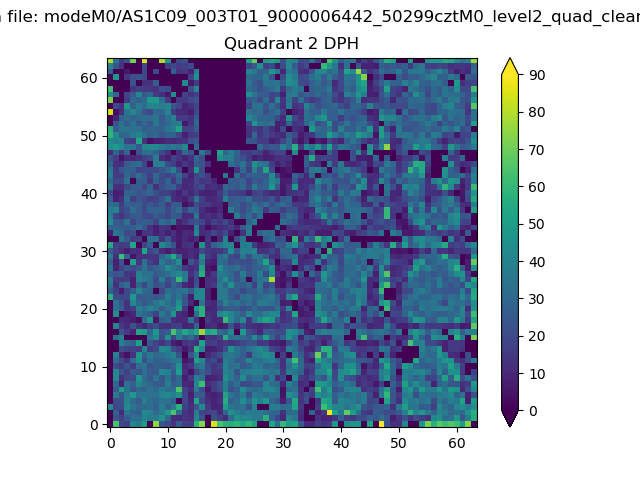 |
Quadrant C |
| Plot type | Count rate plots | Images |
|---|---|---|
| Comparison with Poisson distribution Blue bars denote a histogram of data divided into 1 sec bins. Red curve is a Poisson curve with rate = median count rate of data. |
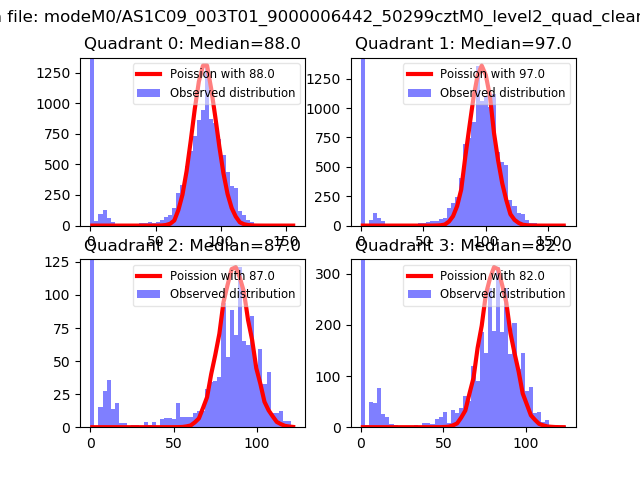 |
 |
| Quadrant-wise count rates Data is divided into 100 sec bins |
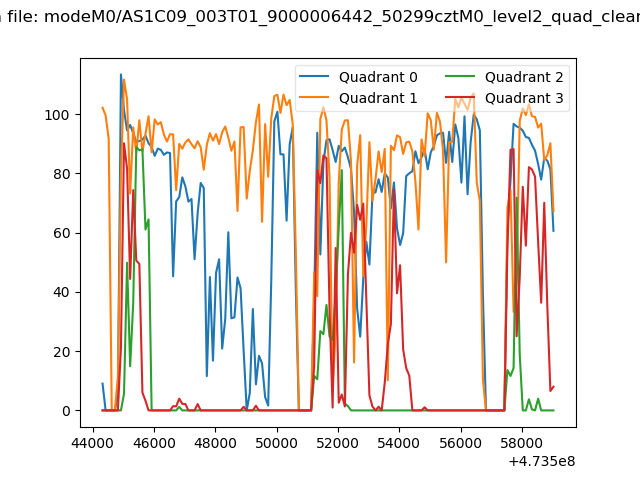 |
|
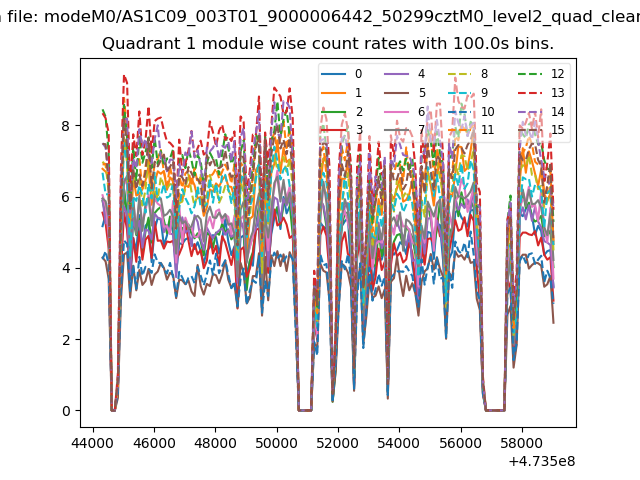
| Module-wise count rates for Quadrant A Data is divided into 100 sec bins |
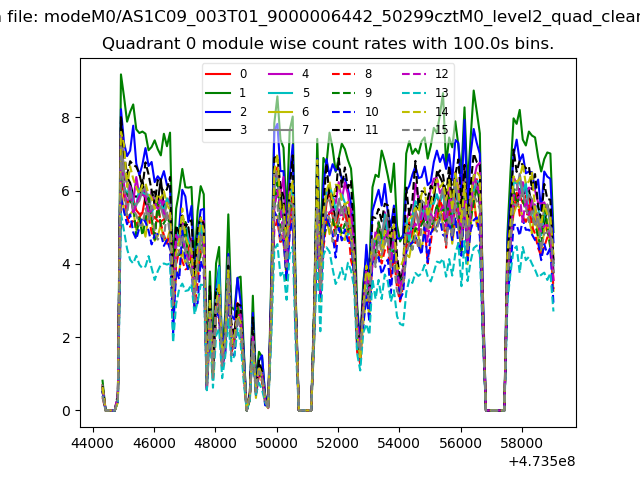 |
 |
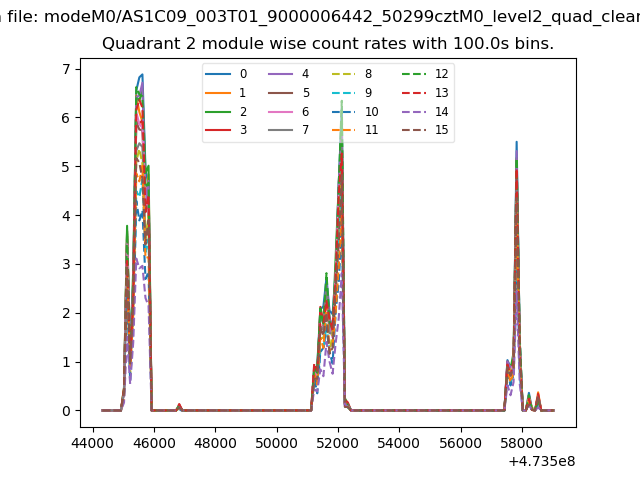
| Module-wise count rates for Quadrant B Data is divided into 100 sec bins |
 |
 |
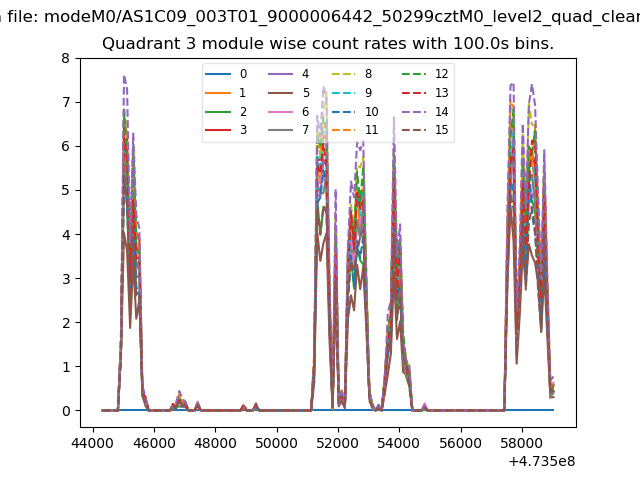
| Module-wise count rates for Quadrant C Data is divided into 100 sec bins |
 |
 |
| Module-wise count rates for Quadrant D Data is divided into 100 sec bins |
 |
 |
| Parameter | Plot |
|---|---|
| CZT HV Monitor | 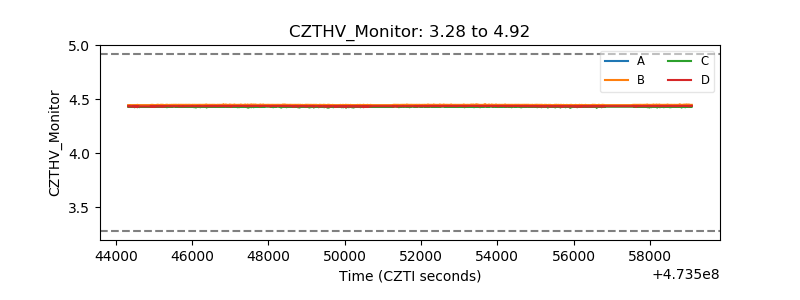 |
| D_VDD | 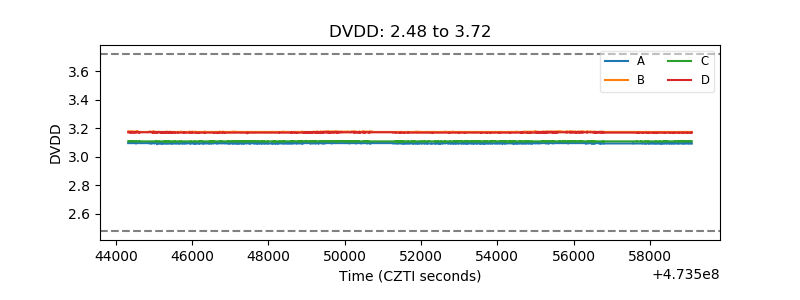 |
| Temperature 1 | 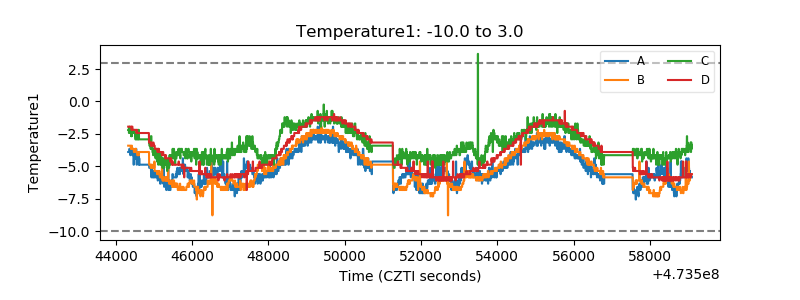 |
| Veto HV Monitor | 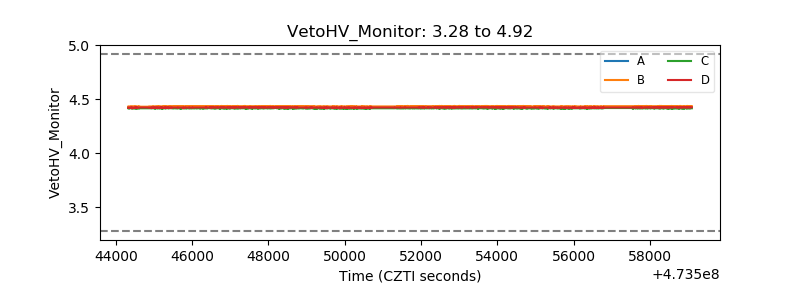 |
| Veto LLD | 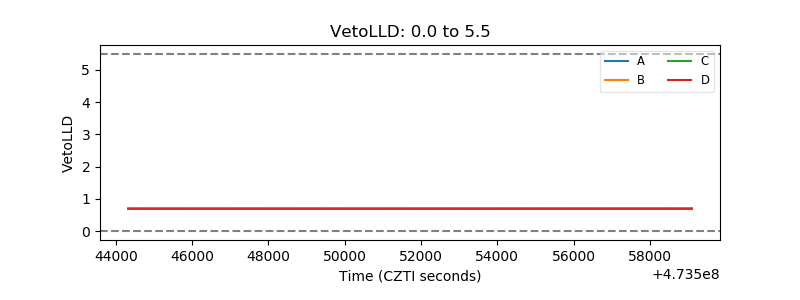 |
| Alpha Counter | 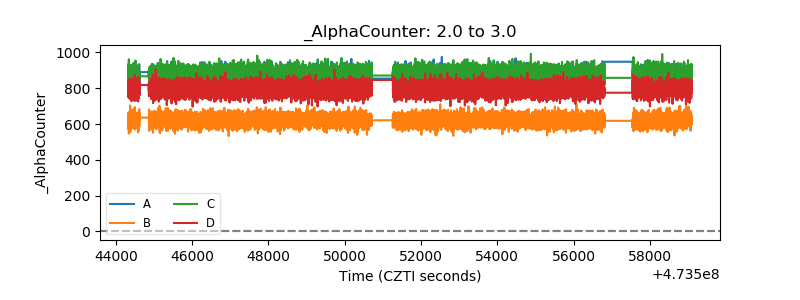 |
| _CPM_Rate | 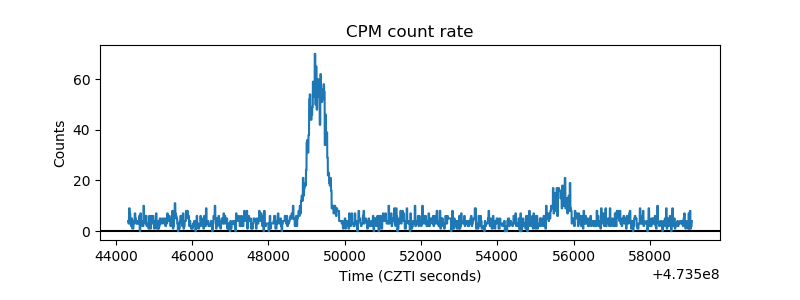 |
| CZT Counter | 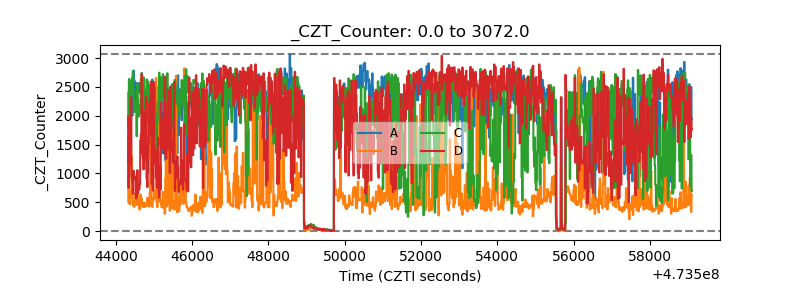 |
| +2.5 Volts monitor | 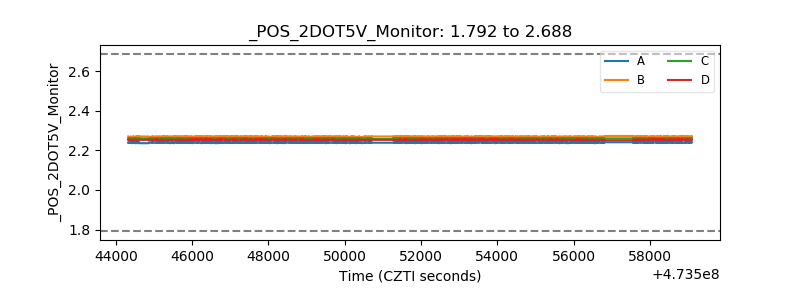 |
| +5 Volts monitor |  |
| _ROLL_ROT | 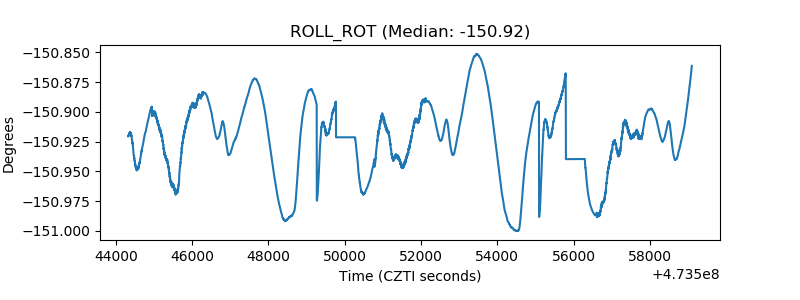 |
| _Roll_DEC | 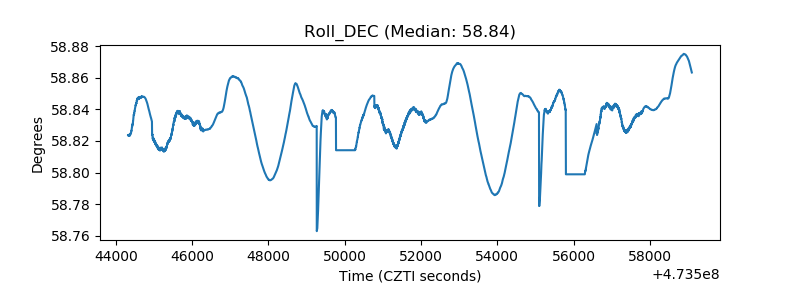 |
| _Roll_RA | 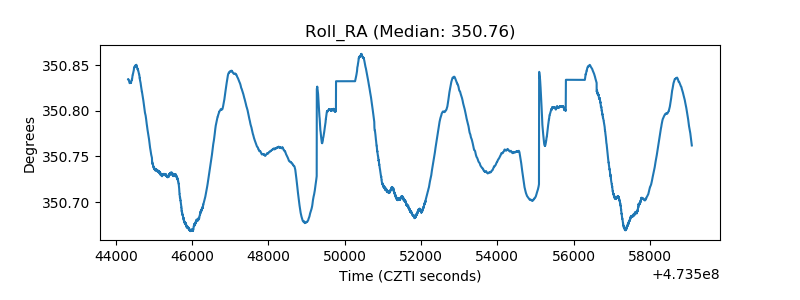 |
| Veto Counter | 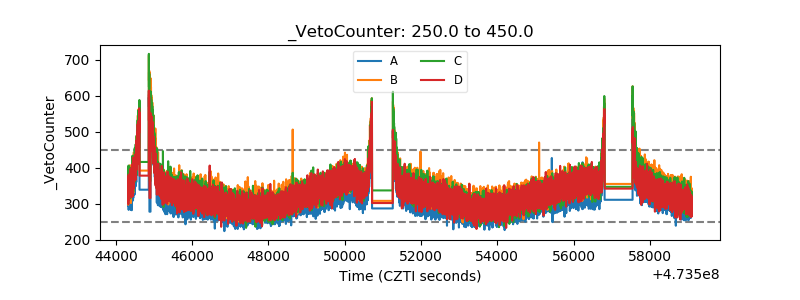 |