| Param | Original file | Final file |
|---|---|---|
| Filename | modeM0/AS1C09_003T01_9000006442_50300cztM0_level2.fits | modeM0/AS1C09_003T01_9000006442_50300cztM0_level2_quad_clean.evt |
| Size (bytes) | 1,075,438,080 | 66,047,040 |
| Size | 1.0 GB | 63.0 MB |
| Events in quadrant A | 5,580,140 | 597,881 |
| Events in quadrant B | 5,978,911 | 606,378 |
| Events in quadrant C | 13,885,773 | 96,260 |
| Events in quadrant D | 13,847,914 | 232,885 |
| Mode M9 | |||
|---|---|---|---|
| Quadrant | BADHDUFLAG | Total packets | Discarded packets |
| A | 0 | 9 | 0 |
| B | 0 | 9 | 0 |
| C | 0 | 9 | 0 |
| D | 0 | 9 | 0 |
| Mode M0 | |||
|---|---|---|---|
| Quadrant | BADHDUFLAG | Total packets | Discarded packets |
| A | 0 | 21164 | 1 |
| B | 0 | 22391 | 1 |
| C | 0 | 45824 | 1 |
| D | 0 | 45724 | 1 |
| Mode SS | |||
|---|---|---|---|
| Quadrant | BADHDUFLAG | Total packets | Discarded packets |
| A | 0 | 136 | 0 |
| B | 0 | 136 | 0 |
| C | 0 | 136 | 0 |
| D | 0 | 136 | 0 |
| Quadrant | Total seconds | Saturated seconds | Saturation percentage |
|---|---|---|---|
| A | 6684 | 400 | 5.984440% |
| B | 6684 | 861 | 12.881508% |
| C | 6685 | 5692 | 85.145849% |
| D | 6685 | 4220 | 63.126402% |
Noise dominated data is calculated using 1-second bins in cleaned event files. If a bin has >2000 counts, and if more than 50% of those come from <1% of pixels, then it is considered to be noise-dominated and hence unusable.
| Quadrant | # 1 sec bins | Bins with >0 counts | Bins with >2000 counts | High rate bins dominated by noise | Noise dominated (total time) | Noise dominated (detector-on time) | Marked lightcurve |
|---|---|---|---|---|---|---|---|
| A | 7599 | 6685 | 279 | 279 | 3.67% | 4.17% | 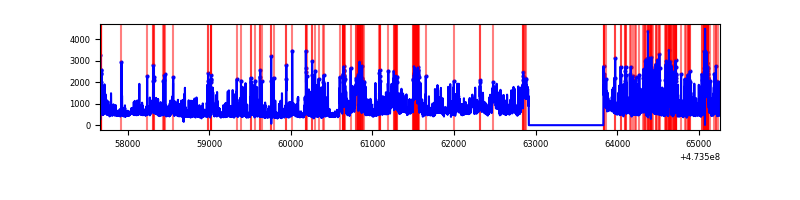 |
| B | 7599 | 6685 | 644 | 644 | 8.47% | 9.63% | 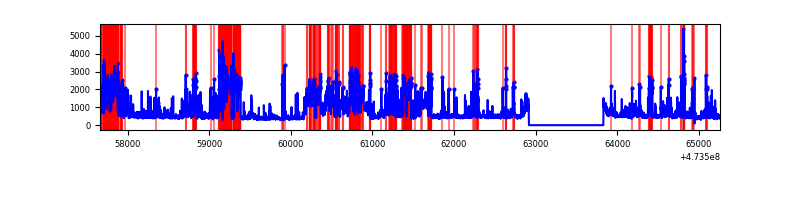 |
| C | 7600 | 6686 | 3874 | 3874 | 50.97% | 57.94% | 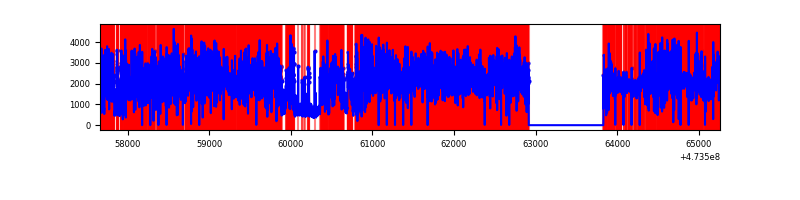 |
| D | 7600 | 6685 | 4321 | 4321 | 56.86% | 64.64% | 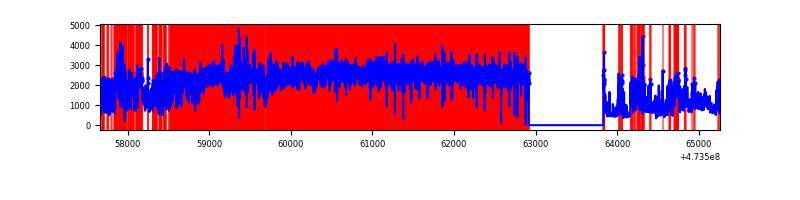 |
Top three noisy pixels from each quadrant. If the there are fewer than three noisy pixels in the level2.evt file, extra rows are filled as -1
| Pixel properties | Quadrant properties | ||||||
|---|---|---|---|---|---|---|---|
| Quadrant | DetID | PixID | Counts | Sigma | Mean | Median | Sigma |
| A | 3 | 14 | 932799 | 5458.18 | 698 | 684 | 170.8 |
| A | 0 | 98 | 437766 | 2559.42 | 698 | 684 | 170.8 |
| A | 4 | 13 | 239062 | 1395.87 | 698 | 684 | 170.8 |
| B | 4 | 206 | 2241828 | 15325.22 | 680 | 656 | 146.2 |
| B | 0 | 198 | 159777 | 1088.08 | 680 | 656 | 146.2 |
| B | 5 | 185 | 140781 | 958.18 | 680 | 656 | 146.2 |
| C | 4 | 111 | 9260170 | 127922.89 | 242 | 240 | 72.4 |
| C | 15 | 197 | 2071168 | 28609.19 | 242 | 240 | 72.4 |
| C | 15 | 199 | 257303 | 3551.24 | 242 | 240 | 72.4 |
| D | 7 | 61 | 7679721 | 58830.29 | 447 | 432 | 130.5 |
| D | 12 | 6 | 2470500 | 18922.95 | 447 | 432 | 130.5 |
| D | 2 | 37 | 447996 | 3428.74 | 447 | 432 | 130.5 |
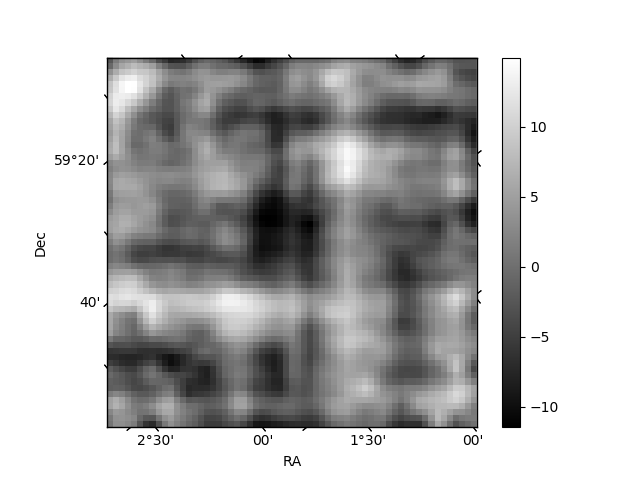
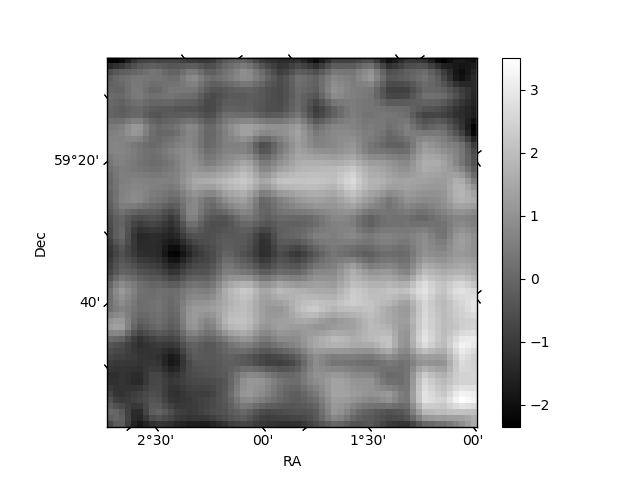
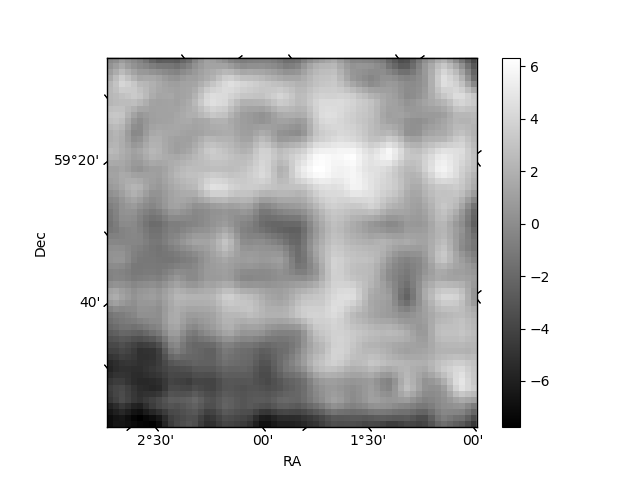
Histogram calculated using DETX and DETY for each event in the final _common_clean file
| Quadrant A | 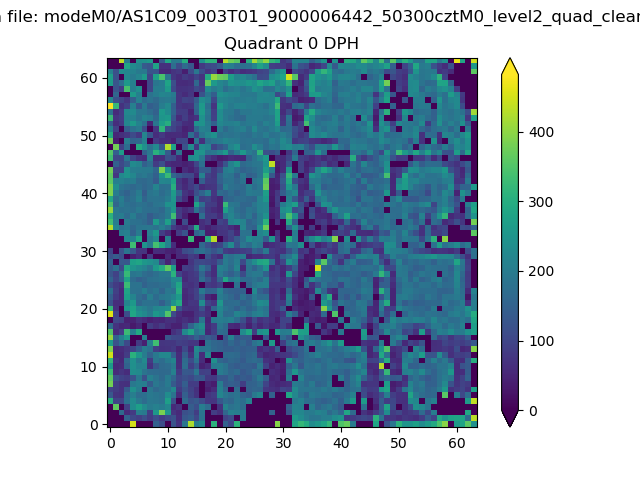 |
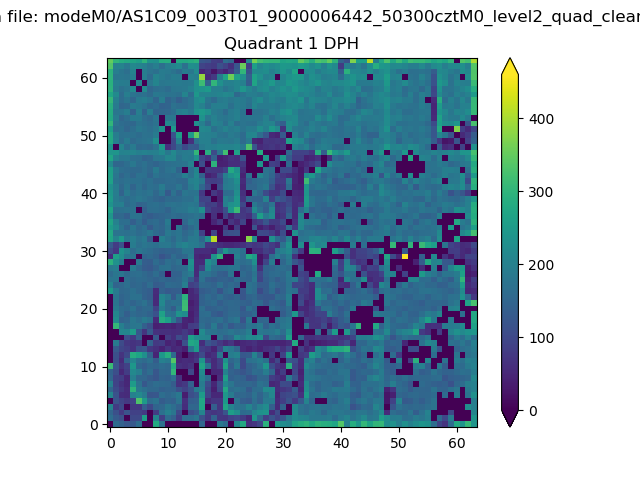 |
Quadrant B |
|---|---|---|---|
| Quadrant D | 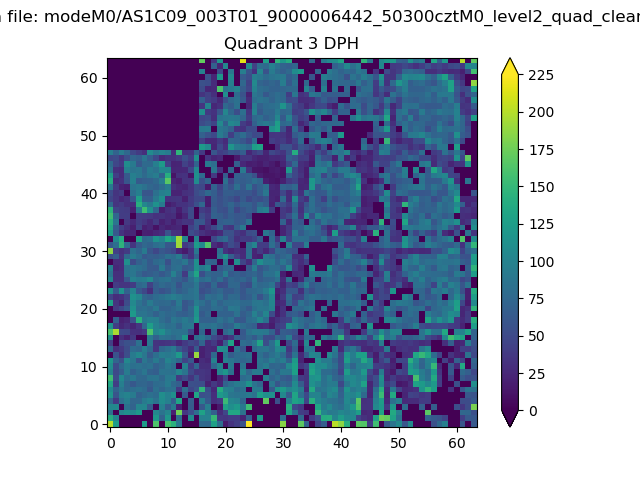 |
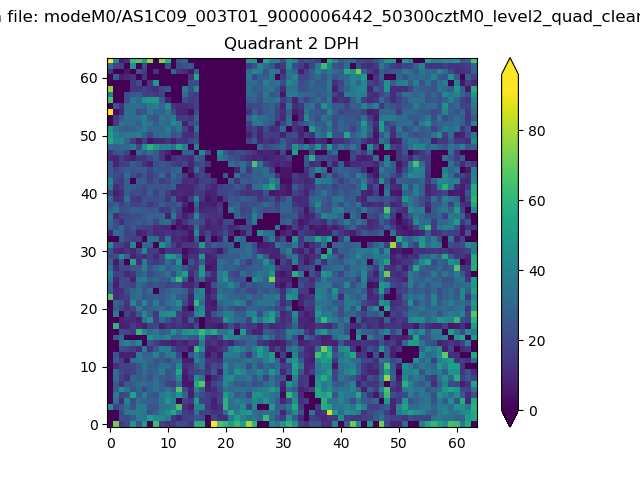 |
Quadrant C |
| Plot type | Count rate plots | Images |
|---|---|---|
| Comparison with Poisson distribution Blue bars denote a histogram of data divided into 1 sec bins. Red curve is a Poisson curve with rate = median count rate of data. |
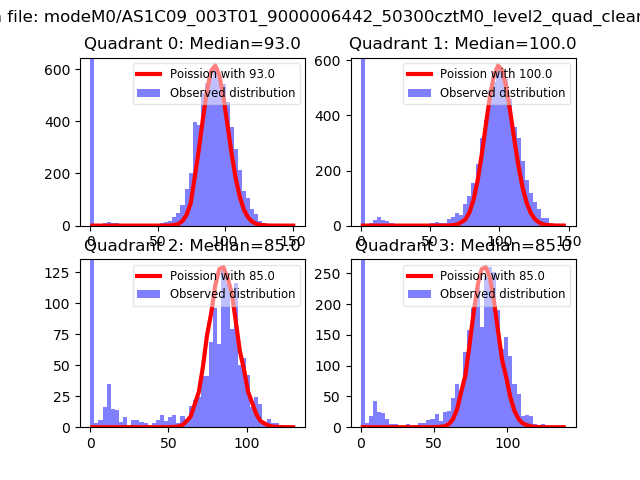 |
 |
| Quadrant-wise count rates Data is divided into 100 sec bins |
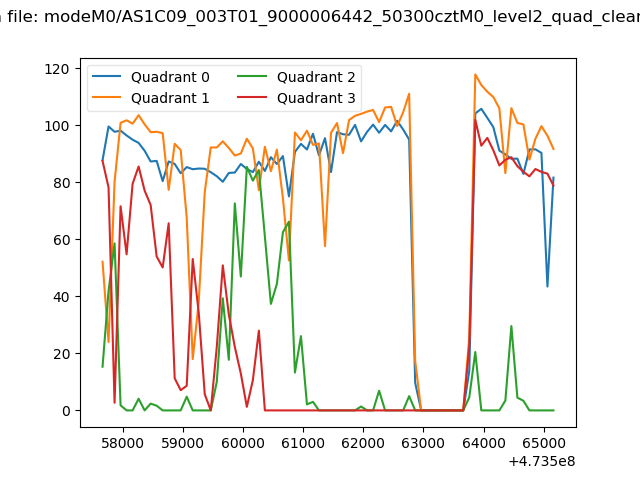 |
|
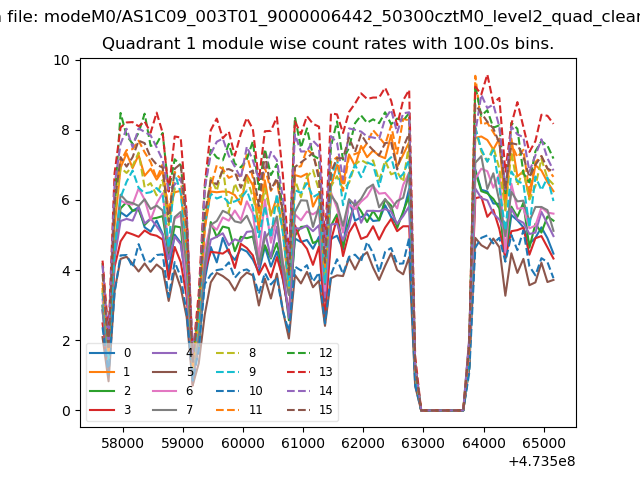
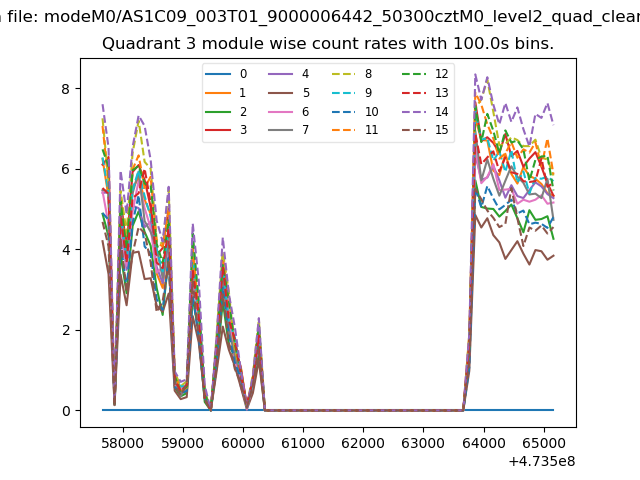
| Module-wise count rates for Quadrant A Data is divided into 100 sec bins |
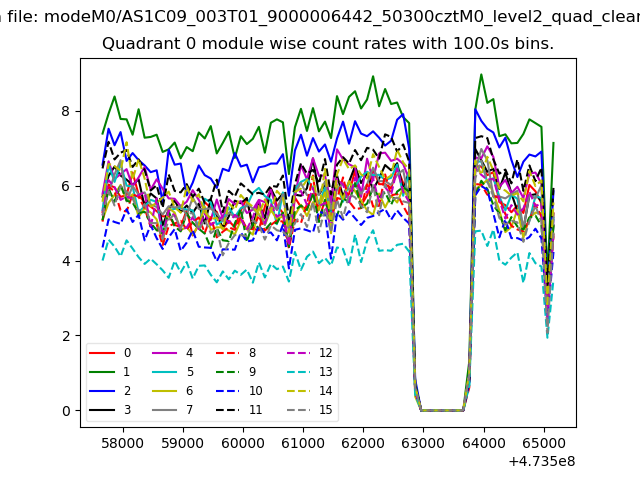 |
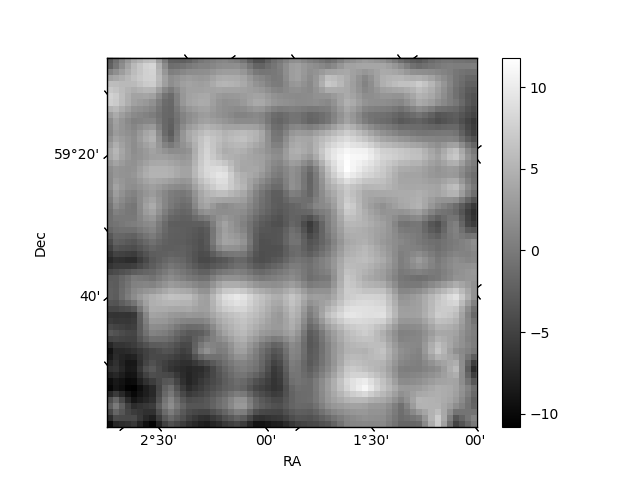 |
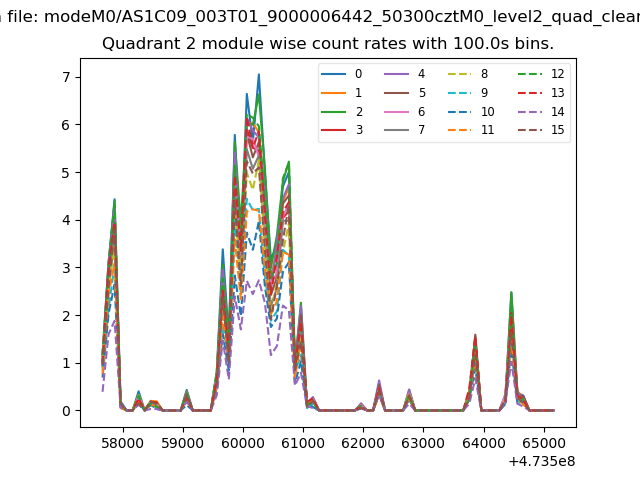
| Module-wise count rates for Quadrant B Data is divided into 100 sec bins |
 |
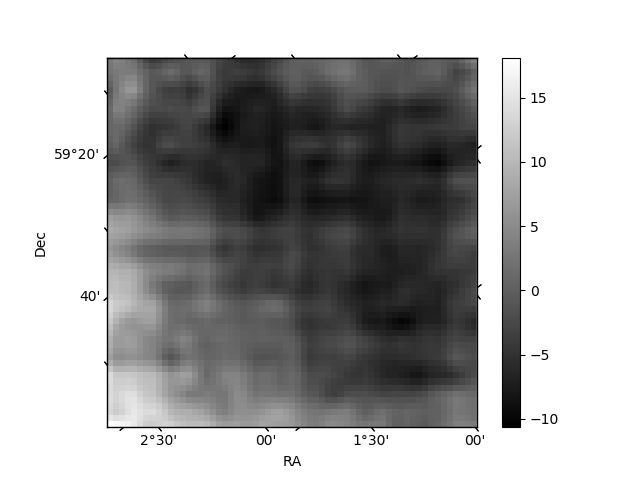 |
| Module-wise count rates for Quadrant C Data is divided into 100 sec bins |
 |
 |
| Module-wise count rates for Quadrant D Data is divided into 100 sec bins |
 |
 |
| Parameter | Plot |
|---|---|
| CZT HV Monitor | 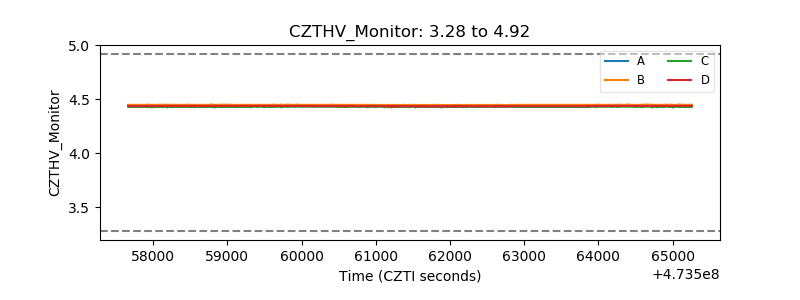 |
| D_VDD | 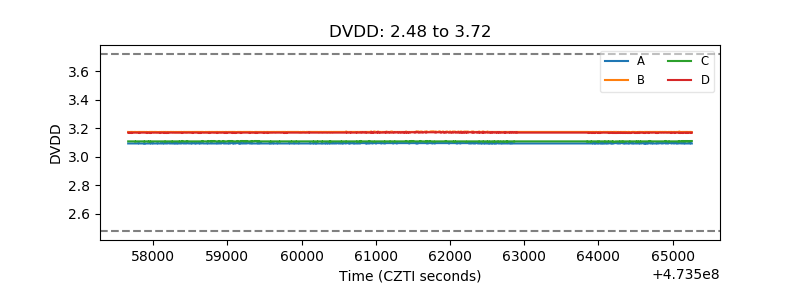 |
| Temperature 1 | 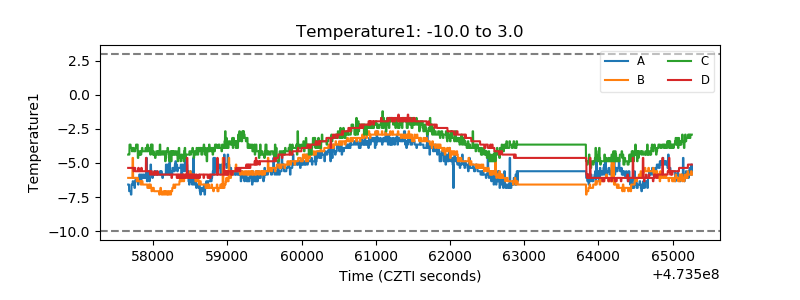 |
| Veto HV Monitor | 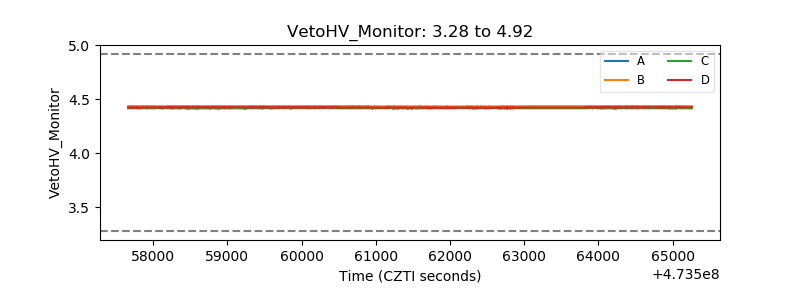 |
| Veto LLD | 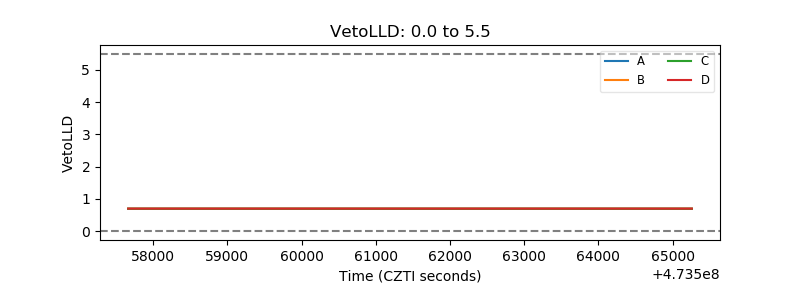 |
| Alpha Counter | 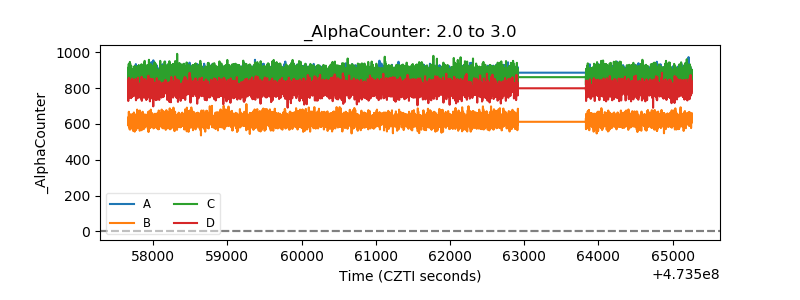 |
| _CPM_Rate | 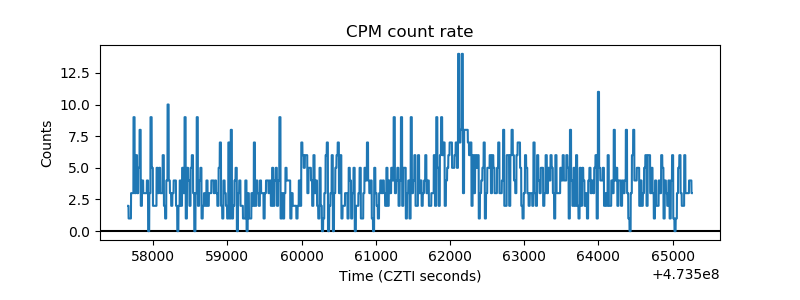 |
| CZT Counter | 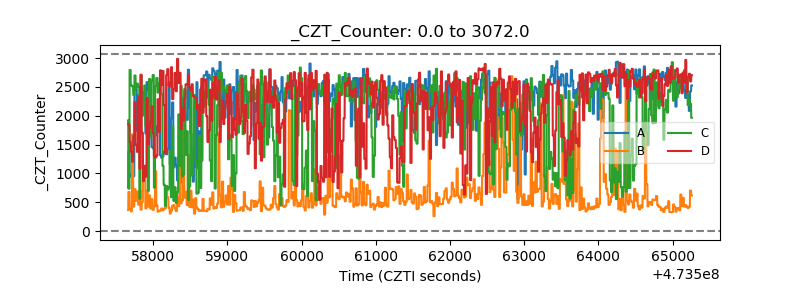 |
| +2.5 Volts monitor |  |
| +5 Volts monitor | 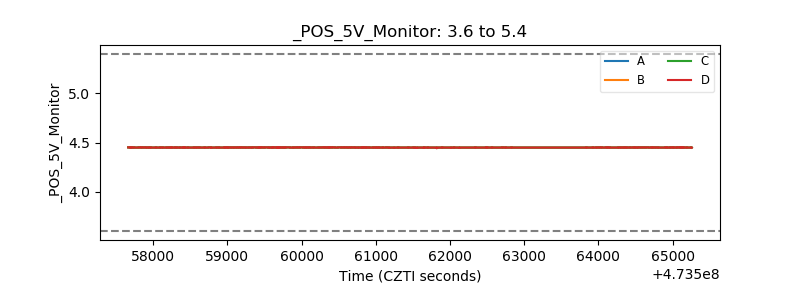 |
| _ROLL_ROT | 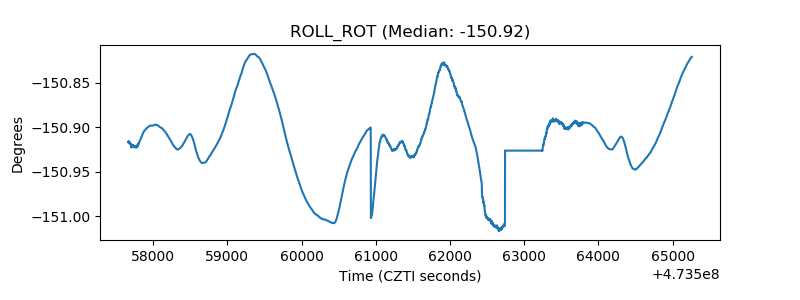 |
| _Roll_DEC | 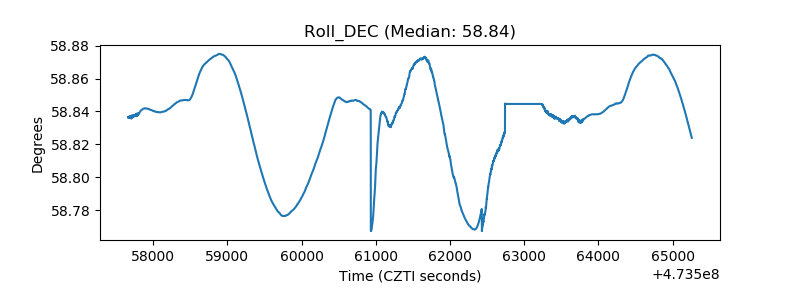 |
| _Roll_RA | 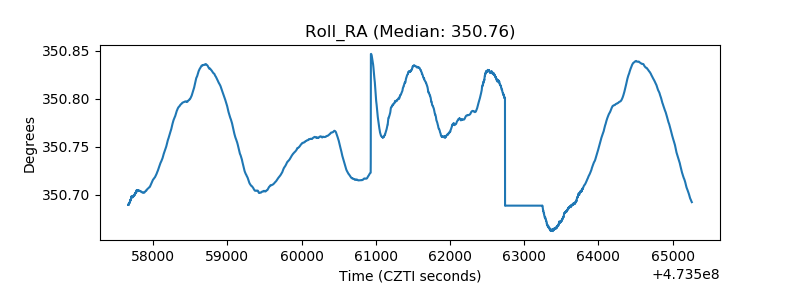 |
| Veto Counter | 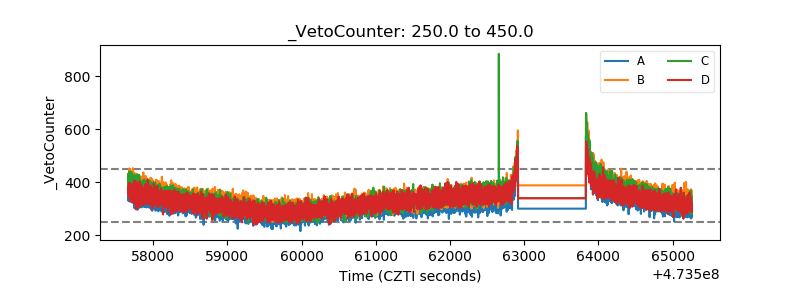 |