| Param | Original file | Final file |
|---|---|---|
| Filename | modeM0/AS1C09_003T01_9000006442_50304cztM0_level2.fits | modeM0/AS1C09_003T01_9000006442_50304cztM0_level2_quad_clean.evt |
| Size (bytes) | 1,060,597,440 | 63,069,120 |
| Size | 1011.5 MB | 60.1 MB |
| Events in quadrant A | 5,832,129 | 571,046 |
| Events in quadrant B | 7,003,786 | 567,278 |
| Events in quadrant C | 13,808,843 | 63,942 |
| Events in quadrant D | 12,125,909 | 264,777 |
| Mode M9 | |||
|---|---|---|---|
| Quadrant | BADHDUFLAG | Total packets | Discarded packets |
| A | 0 | 11 | 0 |
| B | 0 | 11 | 0 |
| C | 0 | 11 | 0 |
| D | 0 | 11 | 0 |
| Mode M0 | |||
|---|---|---|---|
| Quadrant | BADHDUFLAG | Total packets | Discarded packets |
| A | 0 | 21666 | 1 |
| B | 0 | 25132 | 1 |
| C | 0 | 45379 | 1 |
| D | 0 | 40434 | 2 |
| Mode SS | |||
|---|---|---|---|
| Quadrant | BADHDUFLAG | Total packets | Discarded packets |
| A | 0 | 130 | 0 |
| B | 0 | 130 | 0 |
| C | 0 | 130 | 0 |
| D | 0 | 130 | 0 |
| Quadrant | Total seconds | Saturated seconds | Saturation percentage |
|---|---|---|---|
| A | 6332 | 752 | 11.876184% |
| B | 6333 | 1412 | 22.295910% |
| C | 6333 | 5801 | 91.599558% |
| D | 6332 | 3629 | 57.312066% |
Noise dominated data is calculated using 1-second bins in cleaned event files. If a bin has >2000 counts, and if more than 50% of those come from <1% of pixels, then it is considered to be noise-dominated and hence unusable.
| Quadrant | # 1 sec bins | Bins with >0 counts | Bins with >2000 counts | High rate bins dominated by noise | Noise dominated (total time) | Noise dominated (detector-on time) | Marked lightcurve |
|---|---|---|---|---|---|---|---|
| A | 7462 | 6333 | 534 | 534 | 7.16% | 8.43% | 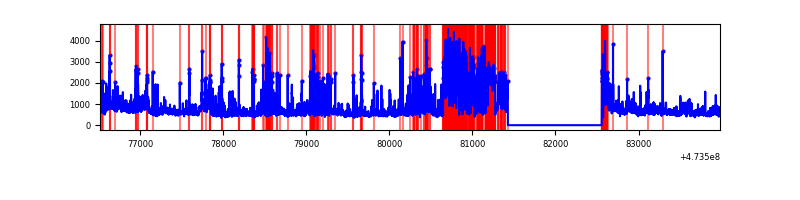 |
| B | 7463 | 6334 | 980 | 980 | 13.13% | 15.47% | 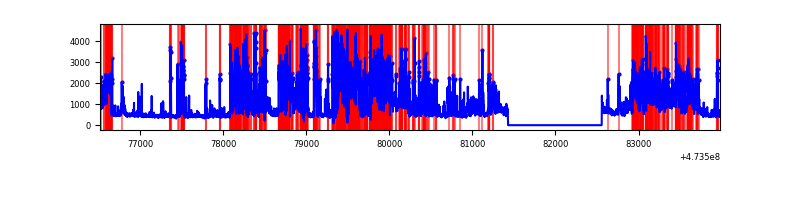 |
| C | 7463 | 6333 | 4081 | 4081 | 54.68% | 64.44% | 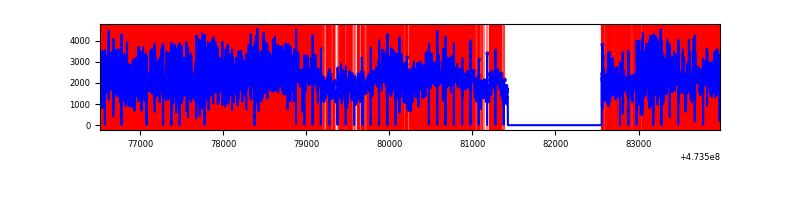 |
| D | 7462 | 6332 | 3486 | 3486 | 46.72% | 55.05% | 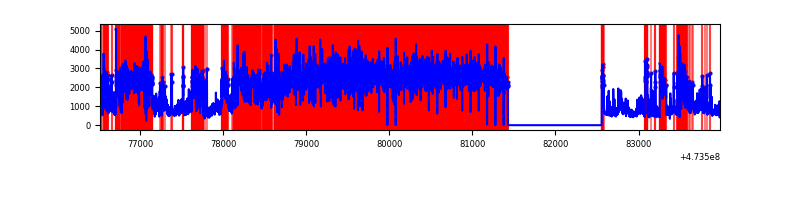 |
Top three noisy pixels from each quadrant. If the there are fewer than three noisy pixels in the level2.evt file, extra rows are filled as -1
| Pixel properties | Quadrant properties | ||||||
|---|---|---|---|---|---|---|---|
| Quadrant | DetID | PixID | Counts | Sigma | Mean | Median | Sigma |
| A | 3 | 114 | 954499 | 5692.83 | 668 | 650 | 167.6 |
| A | 6 | 250 | 422743 | 2519.16 | 668 | 650 | 167.6 |
| A | 0 | 98 | 324046 | 1930.11 | 668 | 650 | 167.6 |
| B | 4 | 206 | 4038187 | 29807.97 | 637 | 617 | 135.5 |
| B | 6 | 203 | 57949 | 423.26 | 637 | 617 | 135.5 |
| B | 5 | 172 | 47818 | 348.47 | 637 | 617 | 135.5 |
| C | 4 | 111 | 8198546 | 137740.07 | 196 | 194 | 59.5 |
| C | 15 | 197 | 3258614 | 54744.54 | 196 | 194 | 59.5 |
| C | 15 | 127 | 290006 | 4869.12 | 196 | 194 | 59.5 |
| D | 7 | 61 | 5821653 | 46981.05 | 441 | 427 | 123.9 |
| D | 12 | 6 | 2464754 | 19888.71 | 441 | 427 | 123.9 |
| D | 15 | 108 | 354116 | 2854.5 | 441 | 427 | 123.9 |
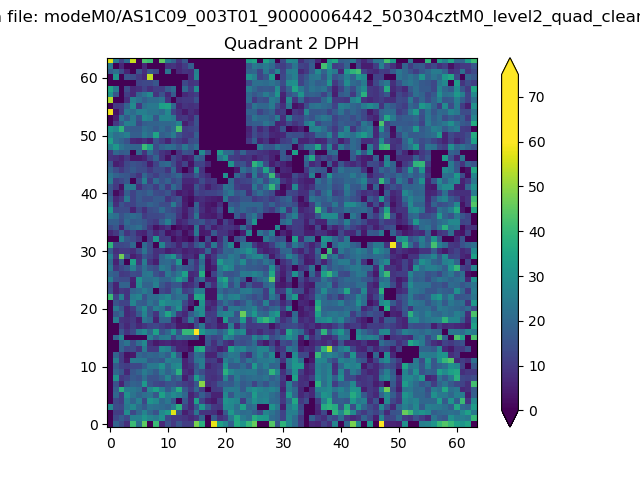
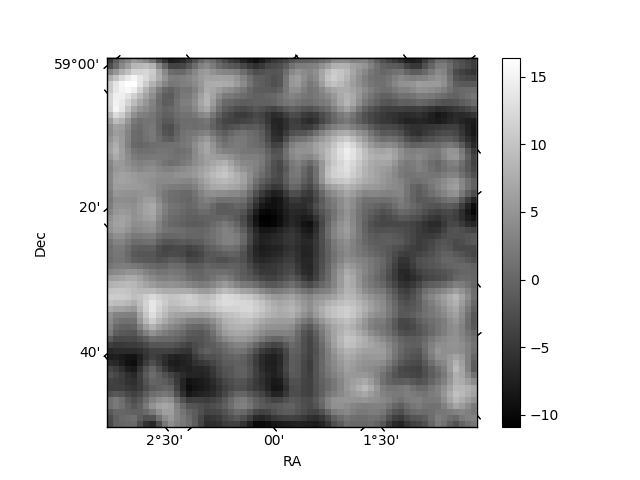
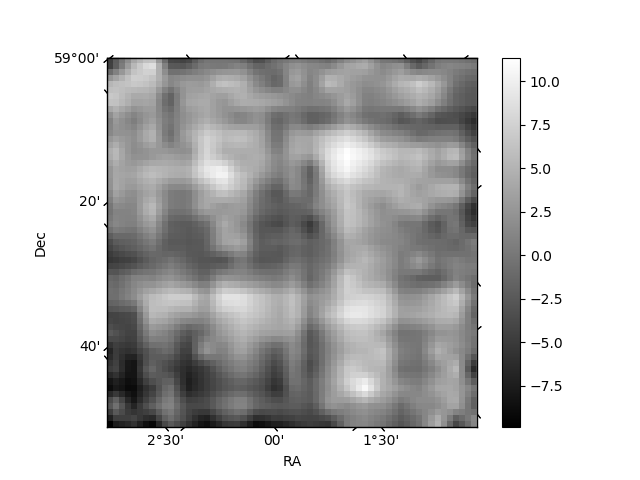
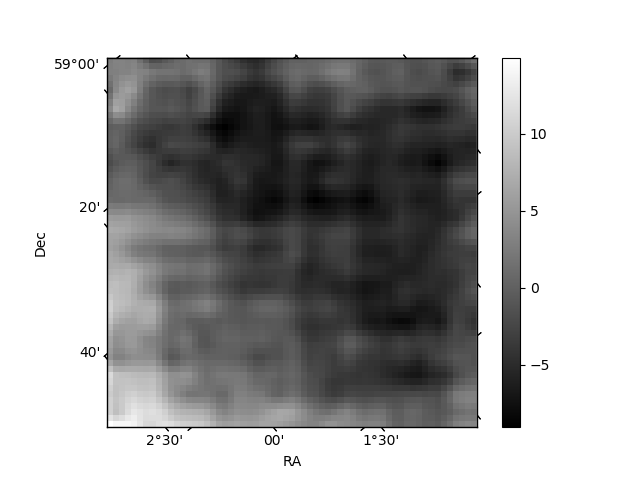
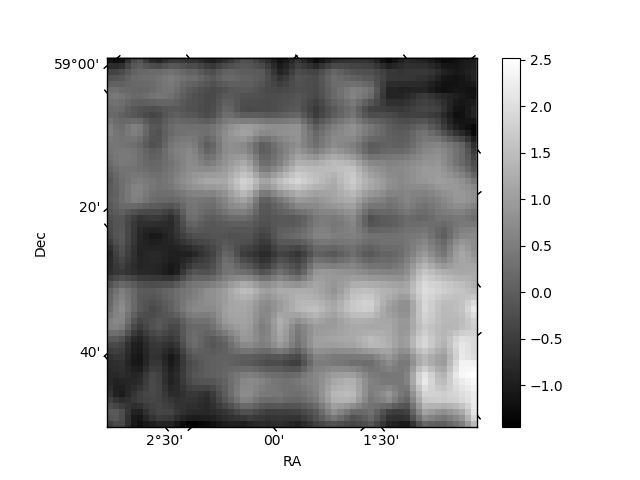
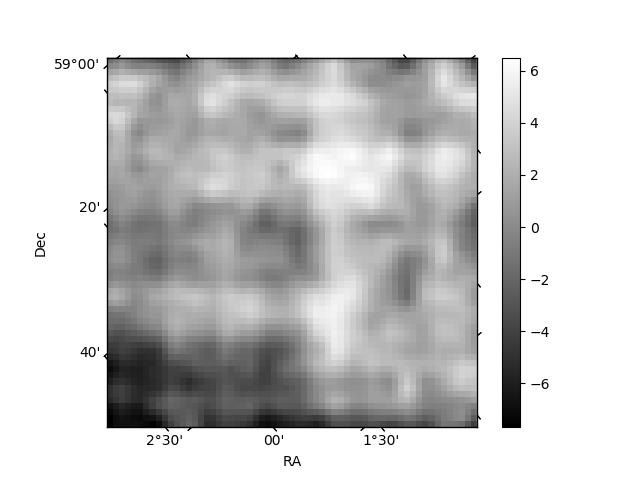
Histogram calculated using DETX and DETY for each event in the final _common_clean file
| Quadrant A | 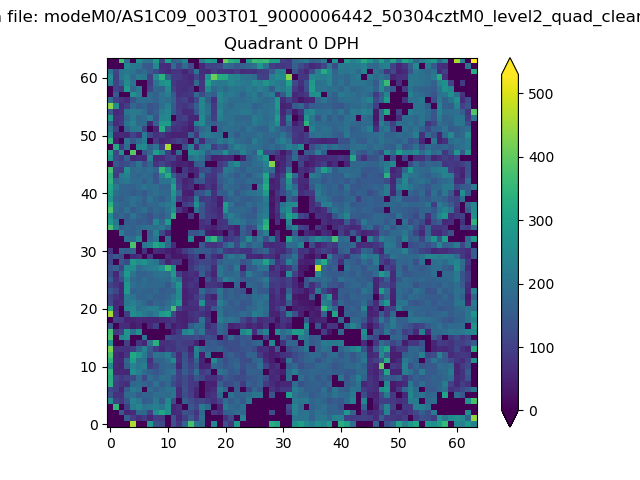 |
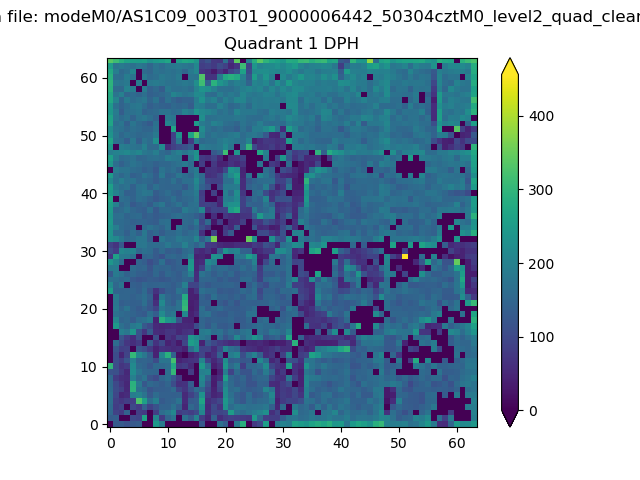 |
Quadrant B |
|---|---|---|---|
| Quadrant D | 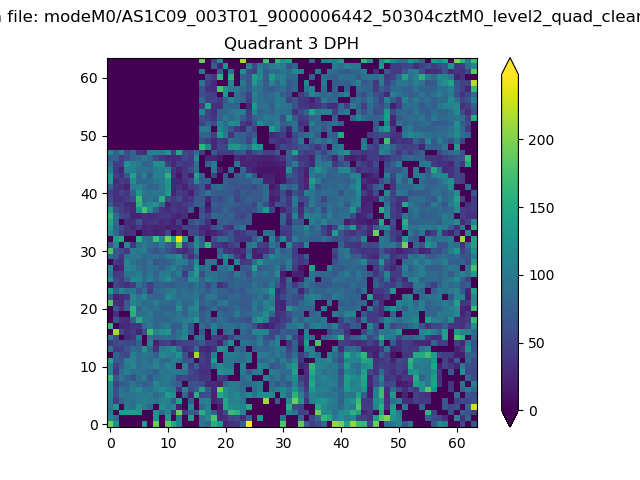 |
 |
Quadrant C |
| Plot type | Count rate plots | Images |
|---|---|---|
| Comparison with Poisson distribution Blue bars denote a histogram of data divided into 1 sec bins. Red curve is a Poisson curve with rate = median count rate of data. |
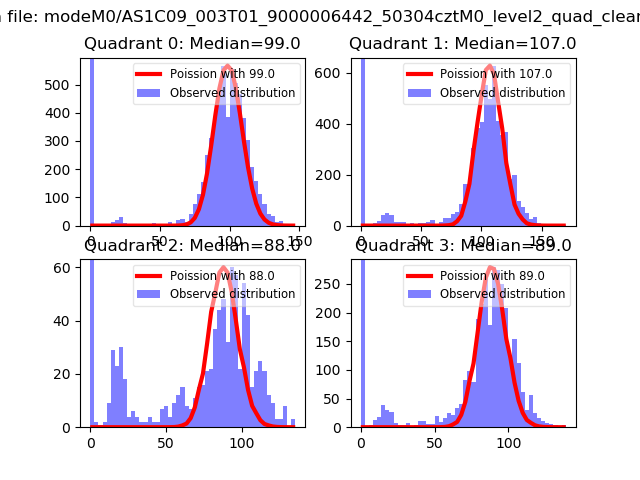 |
 |
| Quadrant-wise count rates Data is divided into 100 sec bins |
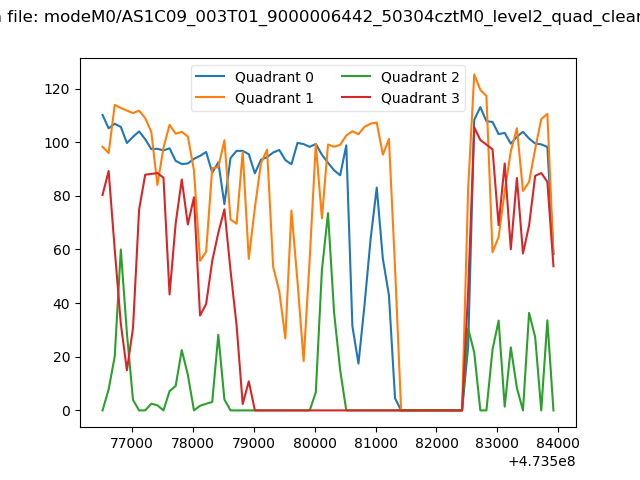 |
|
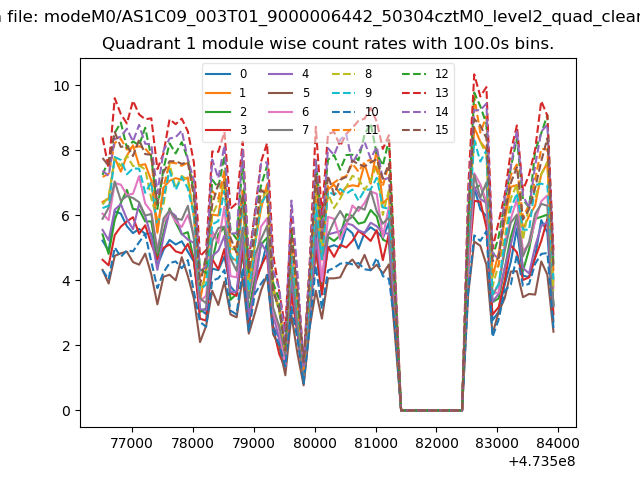
| Module-wise count rates for Quadrant A Data is divided into 100 sec bins |
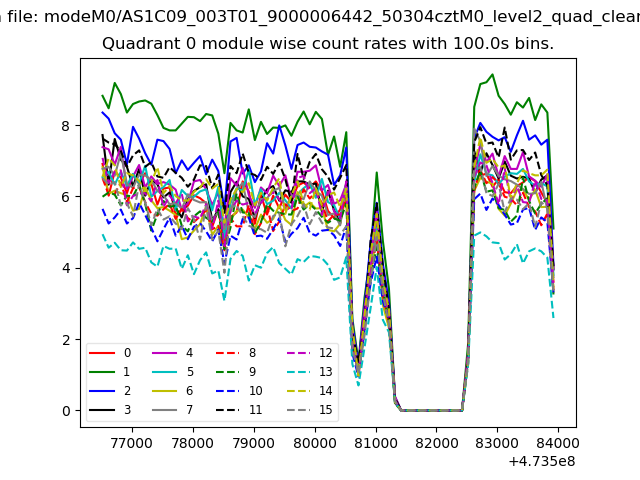 |
 |
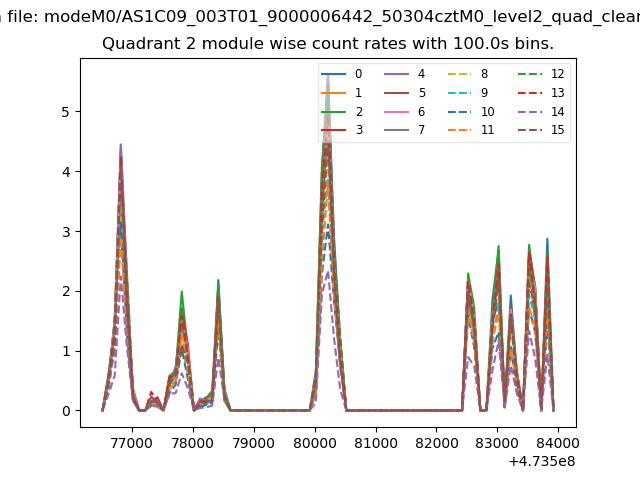
| Module-wise count rates for Quadrant B Data is divided into 100 sec bins |
 |
 |
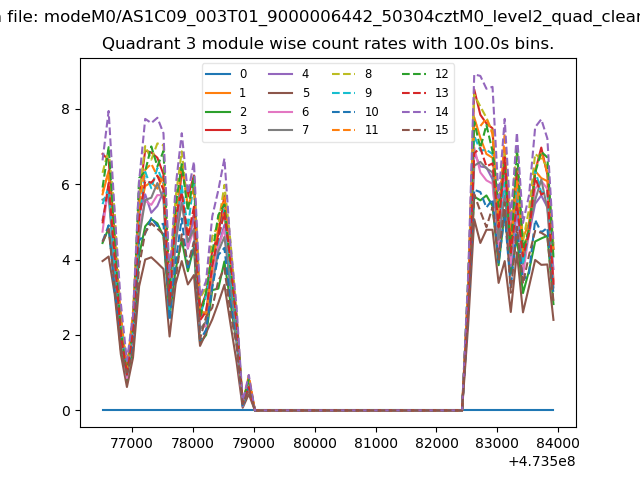
| Module-wise count rates for Quadrant C Data is divided into 100 sec bins |
 |
 |
| Module-wise count rates for Quadrant D Data is divided into 100 sec bins |
 |
 |
| Parameter | Plot |
|---|---|
| CZT HV Monitor | 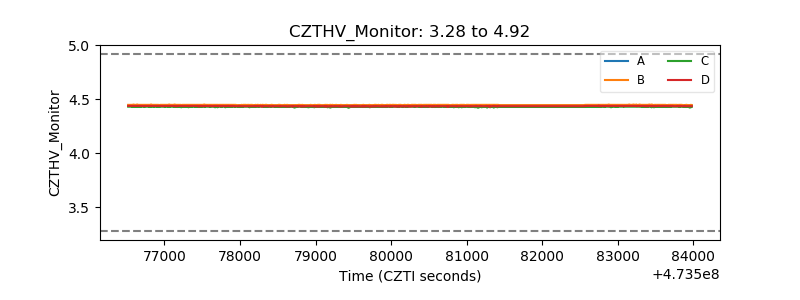 |
| D_VDD | 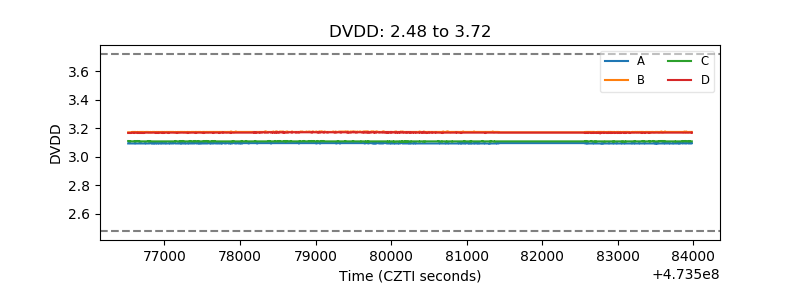 |
| Temperature 1 | 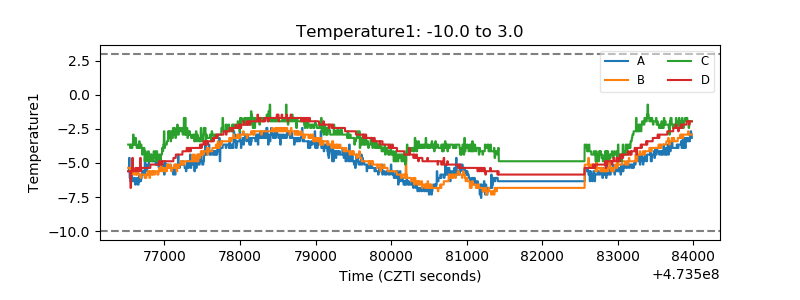 |
| Veto HV Monitor |  |
| Veto LLD | 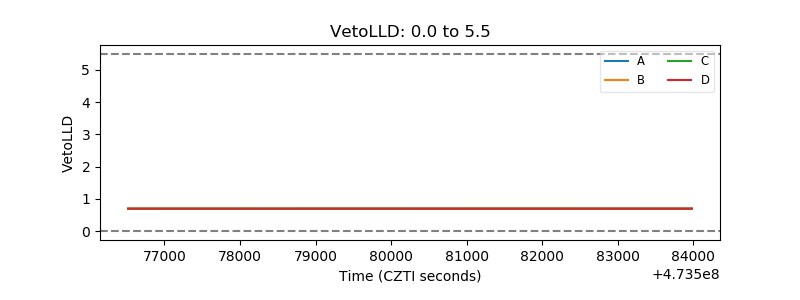 |
| Alpha Counter | 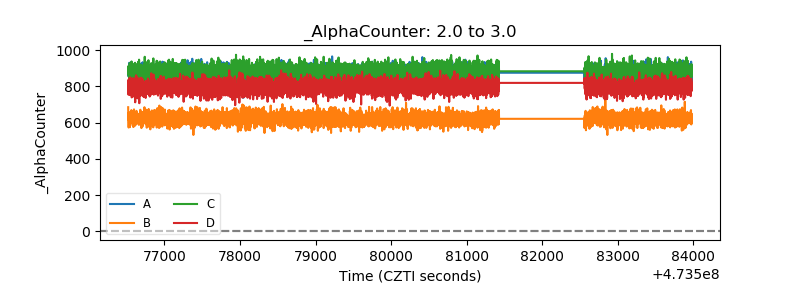 |
| _CPM_Rate | 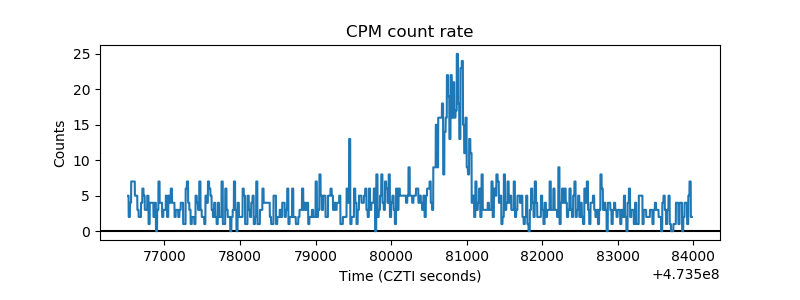 |
| CZT Counter | 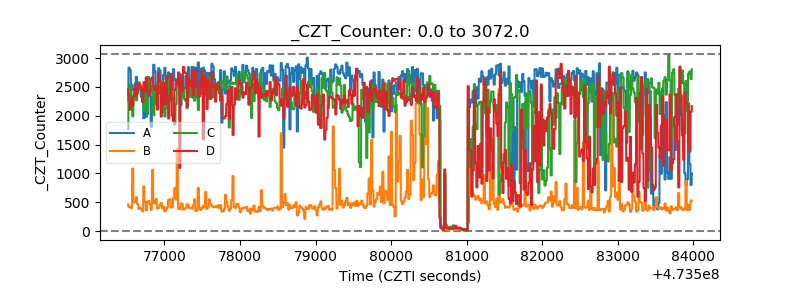 |
| +2.5 Volts monitor | 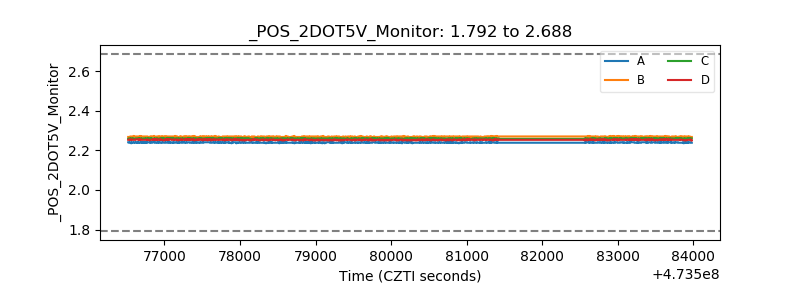 |
| +5 Volts monitor |  |
| _ROLL_ROT | 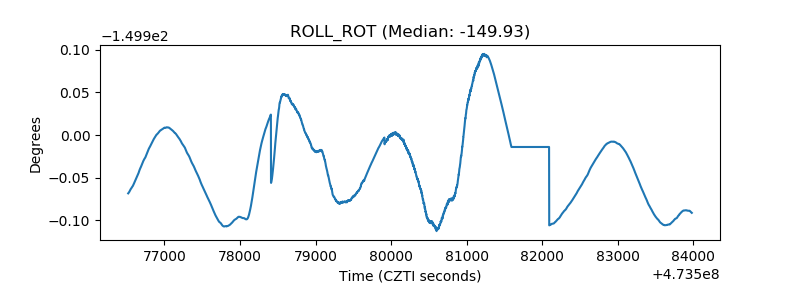 |
| _Roll_DEC | 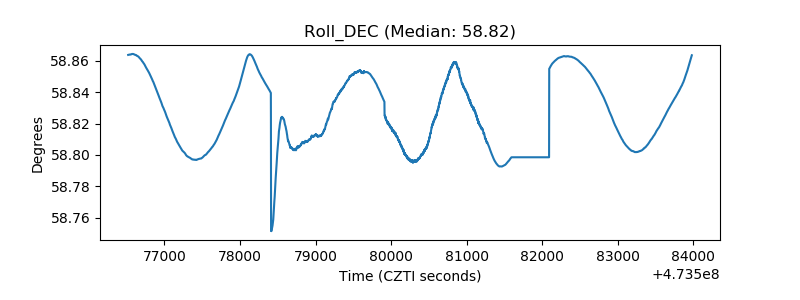 |
| _Roll_RA | 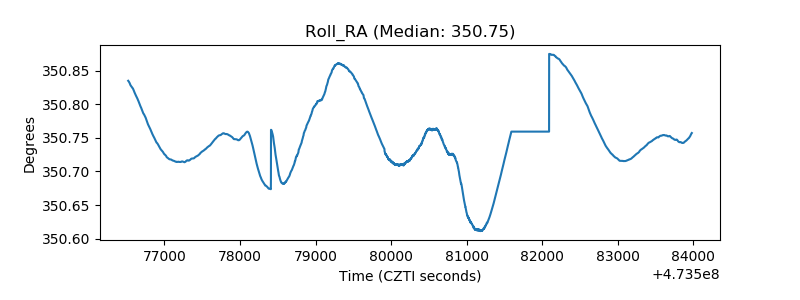 |
| Veto Counter | 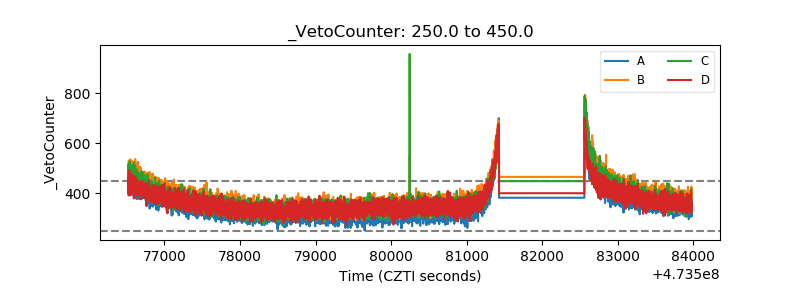 |