| Param | Original file | Final file |
|---|---|---|
| Filename | modeM0/AS1C09_003T01_9000006442_50305cztM0_level2.fits | modeM0/AS1C09_003T01_9000006442_50305cztM0_level2_quad_clean.evt |
| Size (bytes) | 1,087,176,960 | 62,614,080 |
| Size | 1.0 GB | 59.7 MB |
| Events in quadrant A | 4,764,865 | 616,131 |
| Events in quadrant B | 9,209,873 | 447,732 |
| Events in quadrant C | 14,327,519 | 86,101 |
| Events in quadrant D | 11,450,889 | 301,694 |
| Mode M9 | |||
|---|---|---|---|
| Quadrant | BADHDUFLAG | Total packets | Discarded packets |
| A | 0 | 11 | 0 |
| B | 0 | 11 | 0 |
| C | 0 | 11 | 0 |
| D | 0 | 11 | 0 |
| Mode M0 | |||
|---|---|---|---|
| Quadrant | BADHDUFLAG | Total packets | Discarded packets |
| A | 0 | 18533 | 1 |
| B | 0 | 31699 | 1 |
| C | 0 | 46920 | 1 |
| D | 0 | 38431 | 1 |
| Mode SS | |||
|---|---|---|---|
| Quadrant | BADHDUFLAG | Total packets | Discarded packets |
| A | 0 | 130 | 0 |
| B | 0 | 130 | 0 |
| C | 0 | 130 | 0 |
| D | 0 | 130 | 0 |
| Quadrant | Total seconds | Saturated seconds | Saturation percentage |
|---|---|---|---|
| A | 6359 | 306 | 4.812077% |
| B | 6359 | 2497 | 39.267180% |
| C | 6359 | 5595 | 87.985532% |
| D | 6359 | 3182 | 50.039314% |
Noise dominated data is calculated using 1-second bins in cleaned event files. If a bin has >2000 counts, and if more than 50% of those come from <1% of pixels, then it is considered to be noise-dominated and hence unusable.
| Quadrant | # 1 sec bins | Bins with >0 counts | Bins with >2000 counts | High rate bins dominated by noise | Noise dominated (total time) | Noise dominated (detector-on time) | Marked lightcurve |
|---|---|---|---|---|---|---|---|
| A | 7449 | 6360 | 135 | 135 | 1.81% | 2.12% | 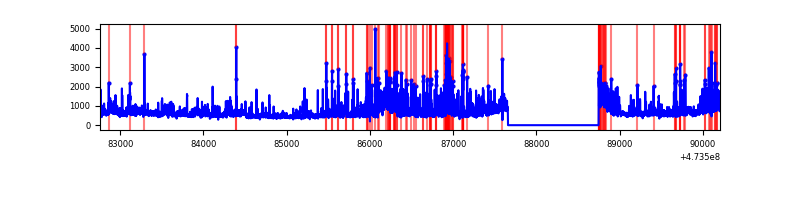 |
| B | 7449 | 6360 | 1875 | 1875 | 25.17% | 29.48% | 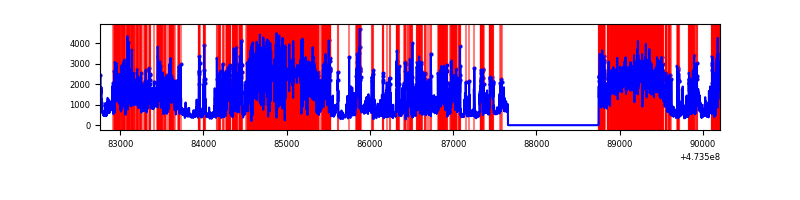 |
| C | 7449 | 6359 | 4569 | 4569 | 61.34% | 71.85% | 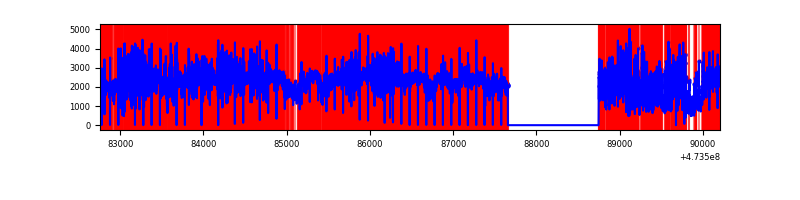 |
| D | 7449 | 6359 | 2990 | 2990 | 40.14% | 47.02% | 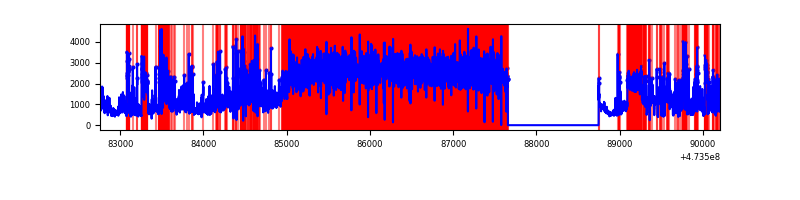 |
Top three noisy pixels from each quadrant. If the there are fewer than three noisy pixels in the level2.evt file, extra rows are filled as -1
| Pixel properties | Quadrant properties | ||||||
|---|---|---|---|---|---|---|---|
| Quadrant | DetID | PixID | Counts | Sigma | Mean | Median | Sigma |
| A | 3 | 14 | 475544 | 2775.69 | 694 | 678 | 171.1 |
| A | 3 | 231 | 334551 | 1951.56 | 694 | 678 | 171.1 |
| A | 3 | 114 | 176342 | 1026.79 | 694 | 678 | 171.1 |
| B | 4 | 206 | 5511032 | 44804.07 | 578 | 559 | 123.0 |
| B | 5 | 32 | 1039732 | 8449.22 | 578 | 559 | 123.0 |
| B | 6 | 203 | 74180 | 598.59 | 578 | 559 | 123.0 |
| C | 15 | 197 | 5675477 | 85886.49 | 226 | 223 | 66.1 |
| C | 4 | 111 | 5284192 | 79964.97 | 226 | 223 | 66.1 |
| C | 6 | 143 | 663467 | 10037.21 | 226 | 223 | 66.1 |
| D | 7 | 61 | 5166617 | 37222.91 | 490 | 473 | 138.8 |
| D | 12 | 6 | 1755309 | 12643.88 | 490 | 473 | 138.8 |
| D | 15 | 108 | 565856 | 4073.68 | 490 | 473 | 138.8 |
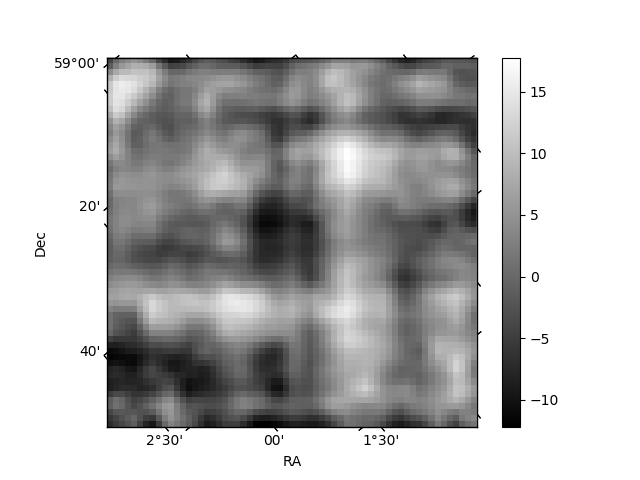
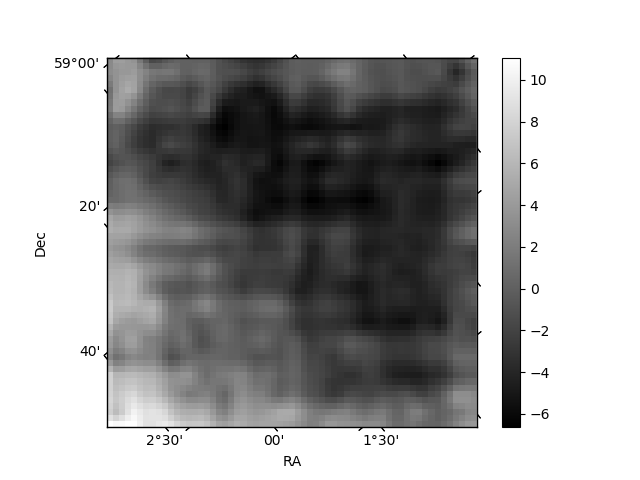
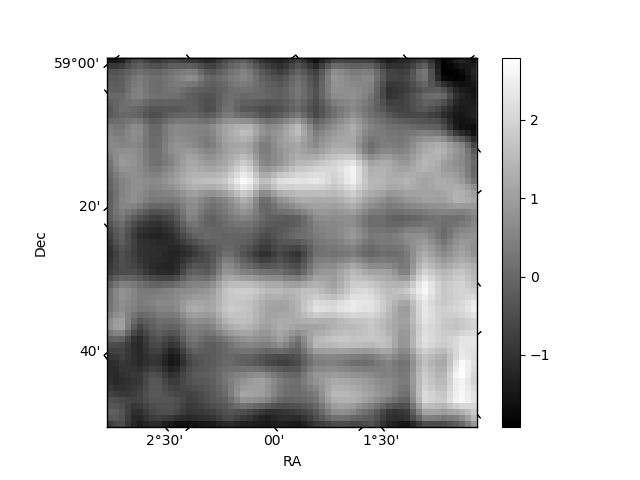
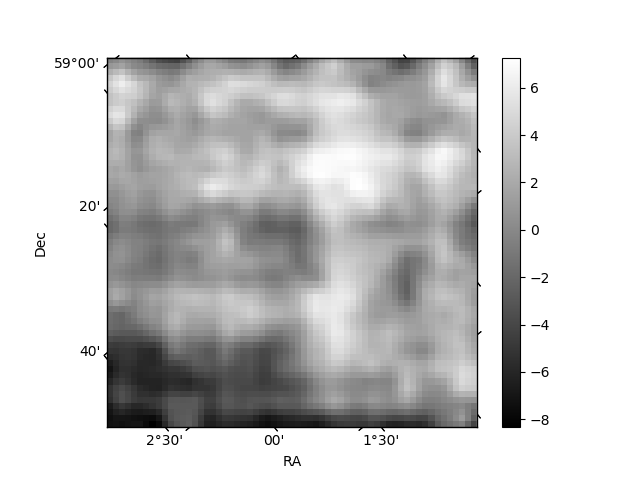
Histogram calculated using DETX and DETY for each event in the final _common_clean file
| Quadrant A | 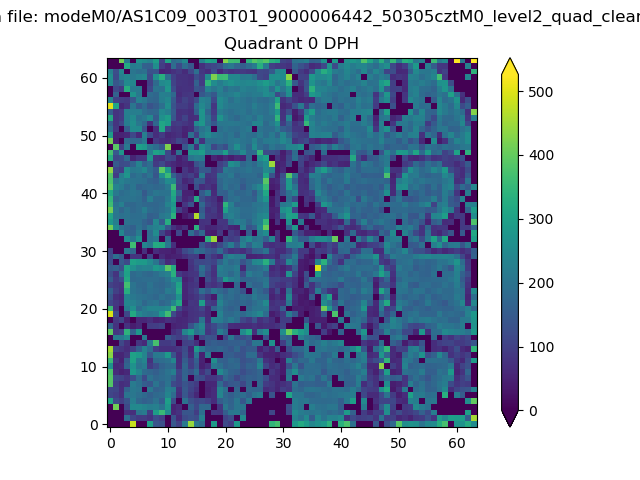 |
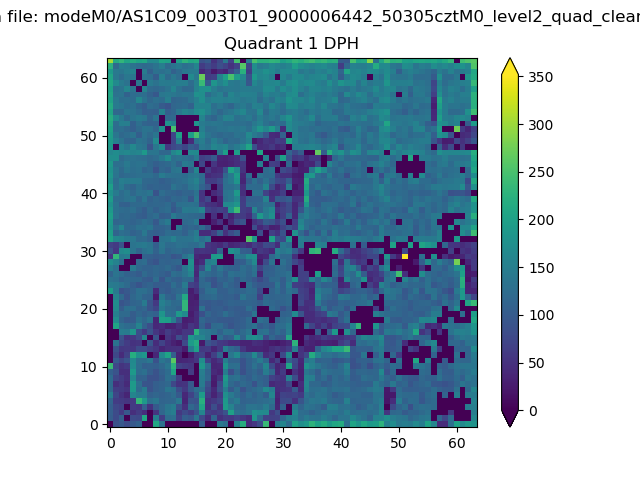 |
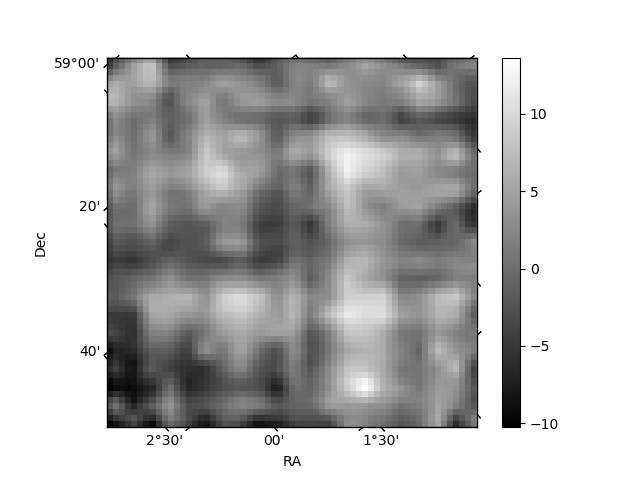
Quadrant B |
|---|---|---|---|
| Quadrant D | 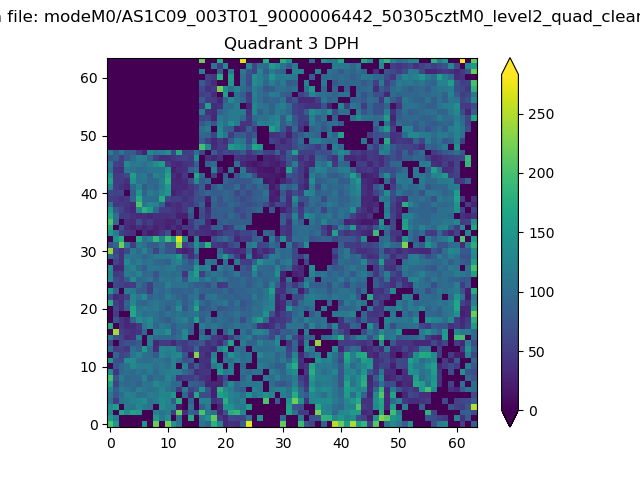 |
 |
Quadrant C |
| Plot type | Count rate plots | Images |
|---|---|---|
| Comparison with Poisson distribution Blue bars denote a histogram of data divided into 1 sec bins. Red curve is a Poisson curve with rate = median count rate of data. |
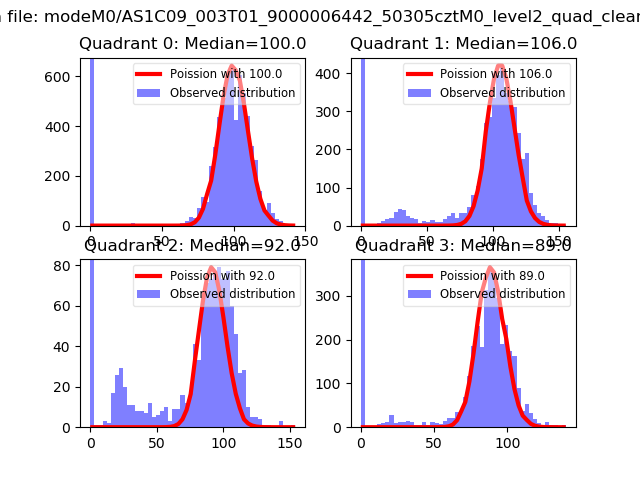 |
 |
| Quadrant-wise count rates Data is divided into 100 sec bins |
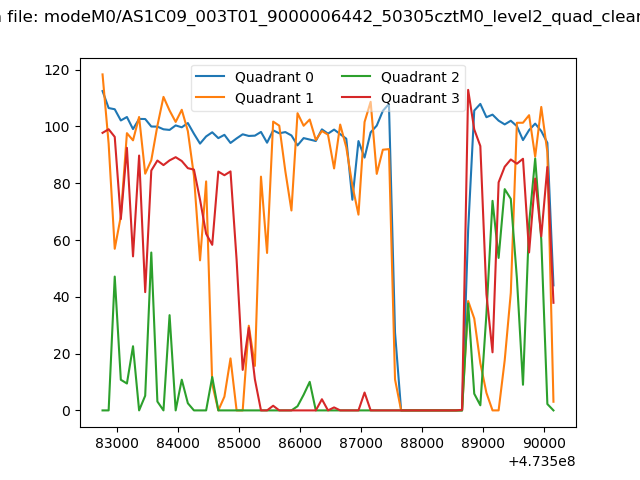 |
|
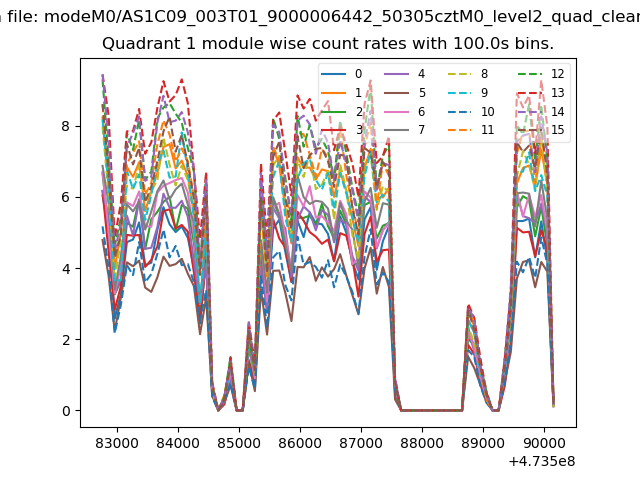
| Module-wise count rates for Quadrant A Data is divided into 100 sec bins |
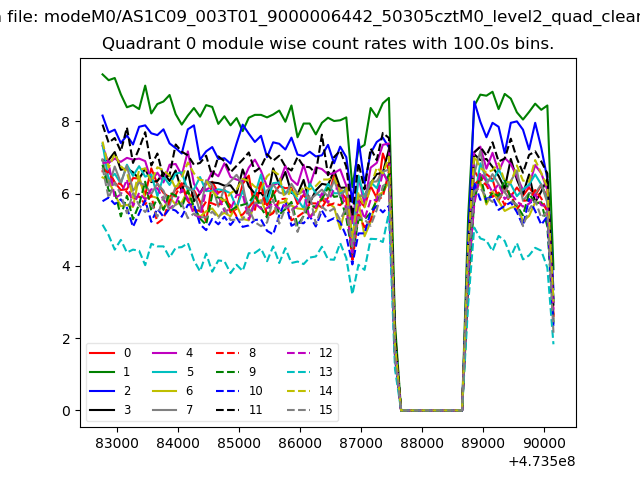 |
 |
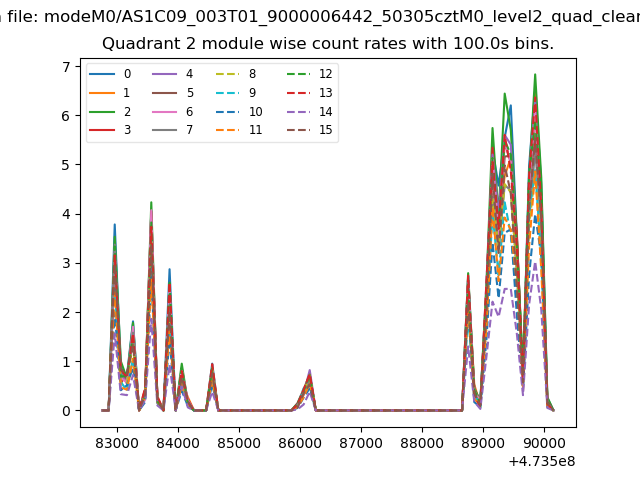
| Module-wise count rates for Quadrant B Data is divided into 100 sec bins |
 |
 |
| Module-wise count rates for Quadrant C Data is divided into 100 sec bins |
 |
 |
| Module-wise count rates for Quadrant D Data is divided into 100 sec bins |
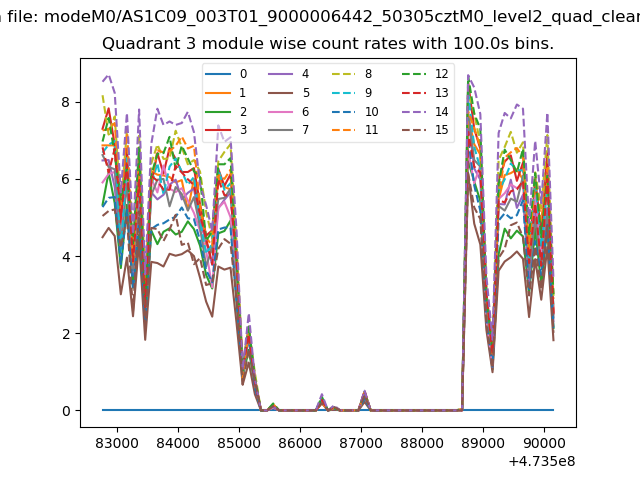 |
 |
| Parameter | Plot |
|---|---|
| CZT HV Monitor | 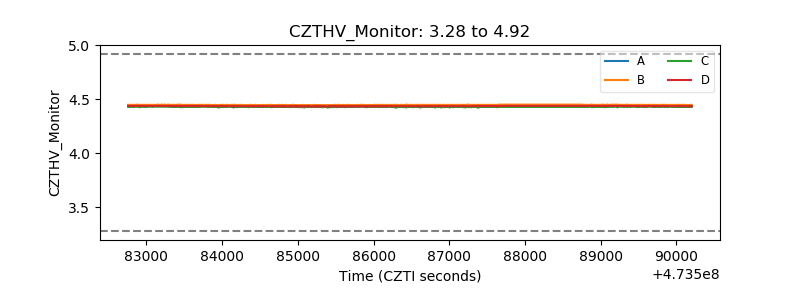 |
| D_VDD | 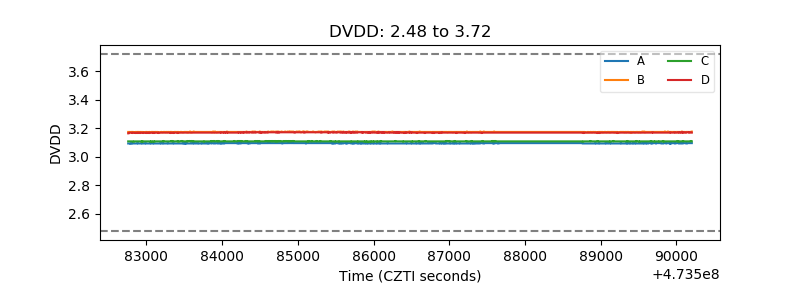 |
| Temperature 1 | 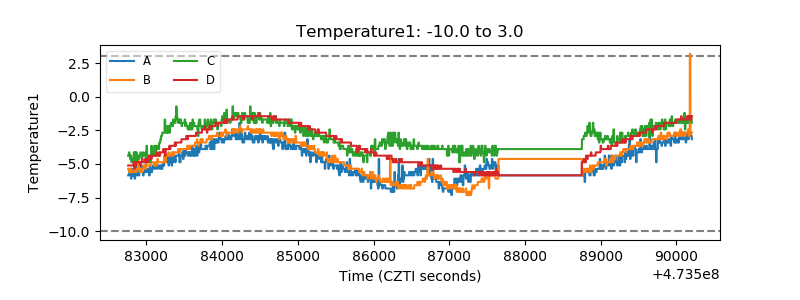 |
| Veto HV Monitor | 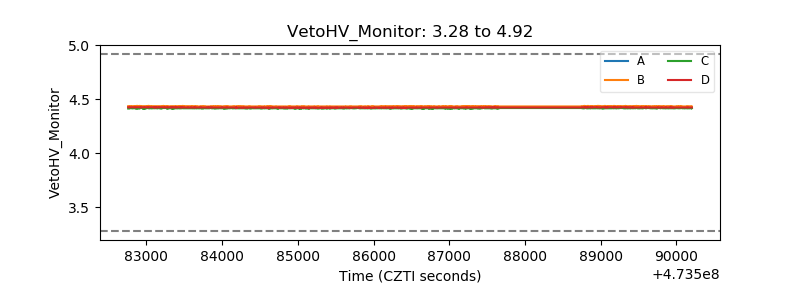 |
| Veto LLD | 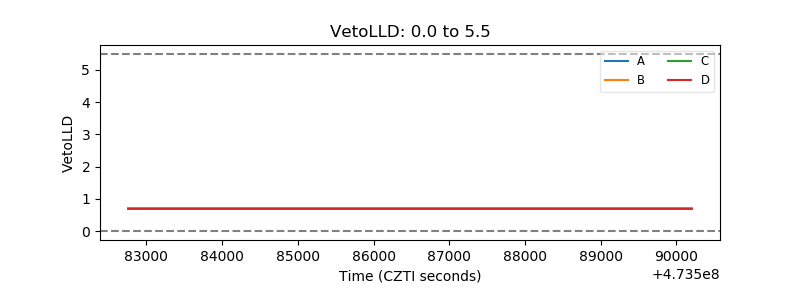 |
| Alpha Counter | 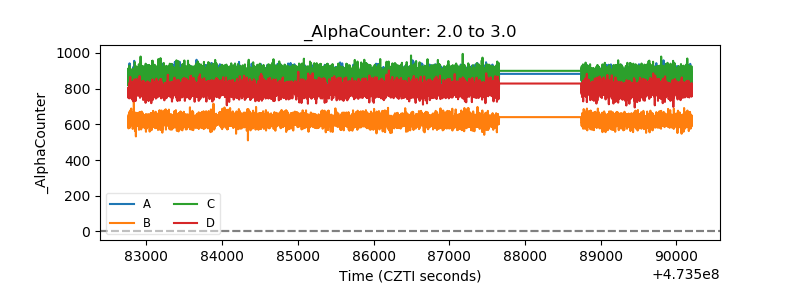 |
| _CPM_Rate | 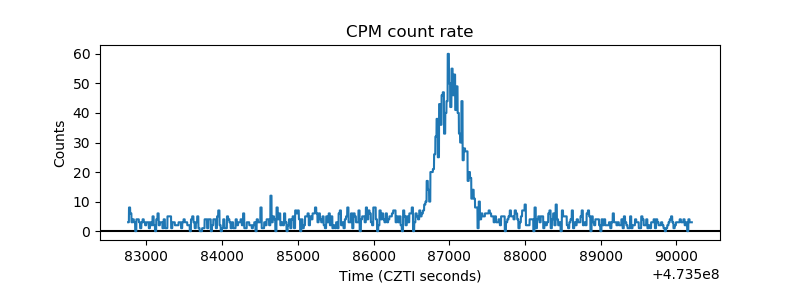 |
| CZT Counter | 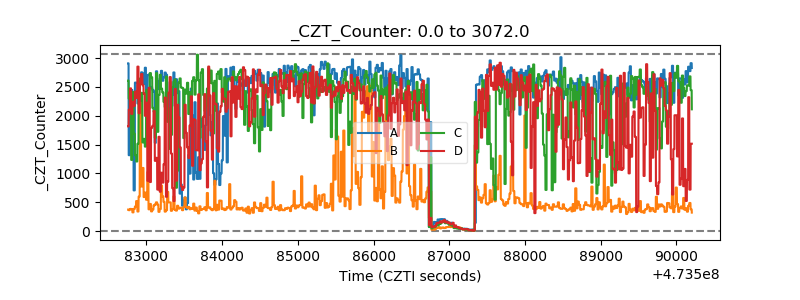 |
| +2.5 Volts monitor | 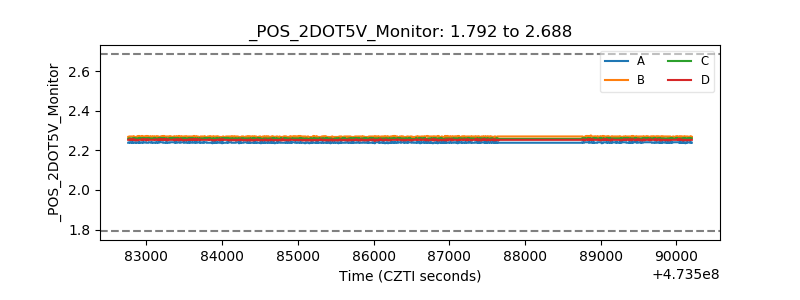 |
| +5 Volts monitor |  |
| _ROLL_ROT | 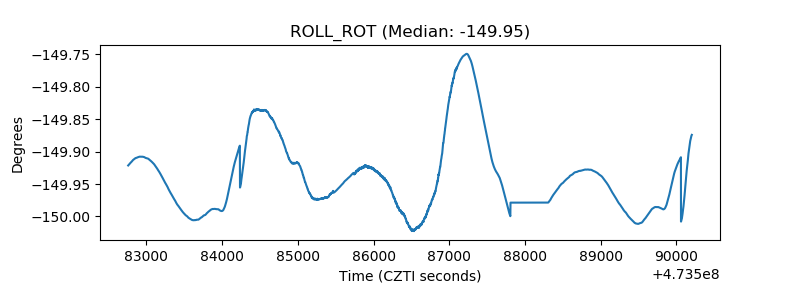 |
| _Roll_DEC | 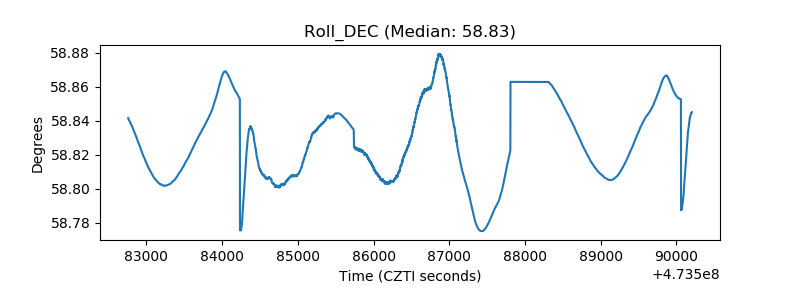 |
| _Roll_RA | 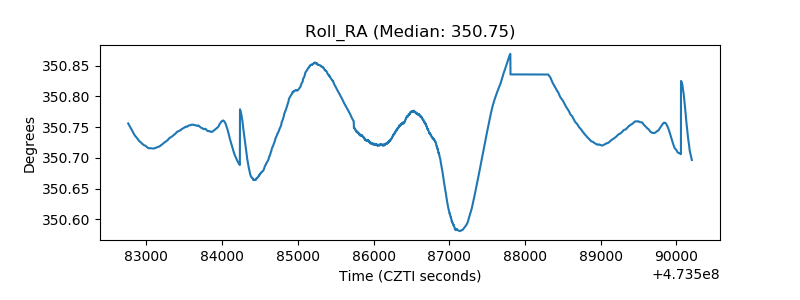 |
| Veto Counter | 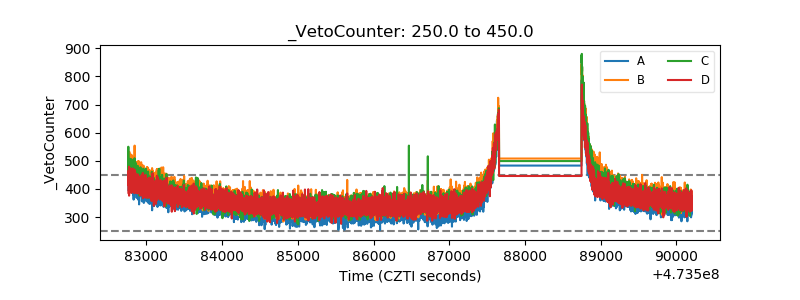 |