| Param | Original file | Final file |
|---|---|---|
| Filename | modeM0/AS1C09_003T01_9000006442_50306cztM0_level2.fits | modeM0/AS1C09_003T01_9000006442_50306cztM0_level2_quad_clean.evt |
| Size (bytes) | 1,137,378,240 | 61,139,520 |
| Size | 1.1 GB | 58.3 MB |
| Events in quadrant A | 7,089,702 | 537,328 |
| Events in quadrant B | 7,660,022 | 512,938 |
| Events in quadrant C | 14,362,928 | 99,619 |
| Events in quadrant D | 12,490,615 | 249,743 |
| Mode M9 | |||
|---|---|---|---|
| Quadrant | BADHDUFLAG | Total packets | Discarded packets |
| A | 0 | 10 | 0 |
| B | 0 | 10 | 0 |
| C | 0 | 10 | 0 |
| D | 0 | 10 | 0 |
| Mode M0 | |||
|---|---|---|---|
| Quadrant | BADHDUFLAG | Total packets | Discarded packets |
| A | 0 | 25557 | 1 |
| B | 0 | 27174 | 1 |
| C | 0 | 47131 | 1 |
| D | 0 | 41626 | 1 |
| Mode SS | |||
|---|---|---|---|
| Quadrant | BADHDUFLAG | Total packets | Discarded packets |
| A | 0 | 130 | 0 |
| B | 0 | 130 | 0 |
| C | 0 | 130 | 0 |
| D | 0 | 130 | 0 |
| Quadrant | Total seconds | Saturated seconds | Saturation percentage |
|---|---|---|---|
| A | 6473 | 1133 | 17.503476% |
| B | 6473 | 1821 | 28.132242% |
| C | 6473 | 5572 | 86.080643% |
| D | 6473 | 3818 | 58.983470% |
Noise dominated data is calculated using 1-second bins in cleaned event files. If a bin has >2000 counts, and if more than 50% of those come from <1% of pixels, then it is considered to be noise-dominated and hence unusable.
| Quadrant | # 1 sec bins | Bins with >0 counts | Bins with >2000 counts | High rate bins dominated by noise | Noise dominated (total time) | Noise dominated (detector-on time) | Marked lightcurve |
|---|---|---|---|---|---|---|---|
| A | 7448 | 6474 | 721 | 721 | 9.68% | 11.14% | 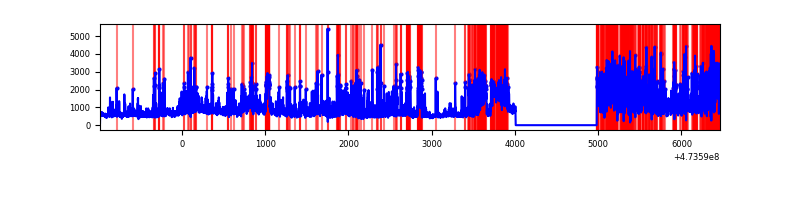 |
| B | 7448 | 6474 | 1402 | 1402 | 18.82% | 21.66% | 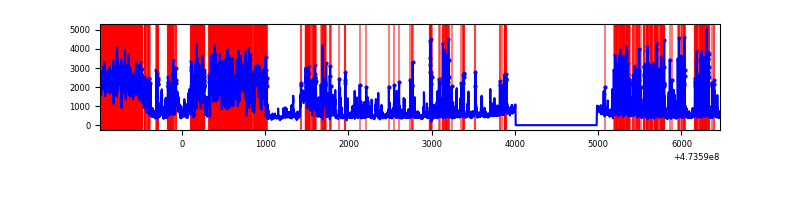 |
| C | 7448 | 6472 | 4442 | 4442 | 59.64% | 68.63% | 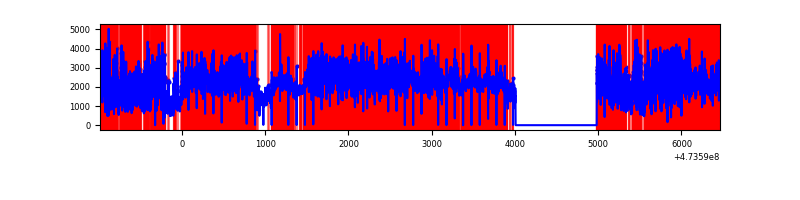 |
| D | 7448 | 6472 | 3568 | 3568 | 47.91% | 55.13% | 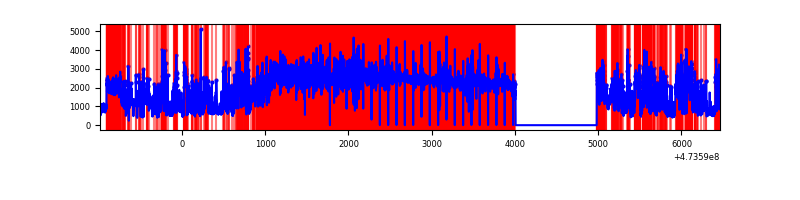 |
Top three noisy pixels from each quadrant. If the there are fewer than three noisy pixels in the level2.evt file, extra rows are filled as -1
| Pixel properties | Quadrant properties | ||||||
|---|---|---|---|---|---|---|---|
| Quadrant | DetID | PixID | Counts | Sigma | Mean | Median | Sigma |
| A | 3 | 63 | 1142253 | 7084.95 | 657 | 642 | 161.1 |
| A | 0 | 98 | 646938 | 4010.98 | 657 | 642 | 161.1 |
| A | 10 | 253 | 535223 | 3317.66 | 657 | 642 | 161.1 |
| B | 4 | 206 | 2859045 | 21767.26 | 613 | 591 | 131.3 |
| B | 1 | 238 | 1056449 | 8040.41 | 613 | 591 | 131.3 |
| B | 5 | 32 | 783565 | 5962.38 | 613 | 591 | 131.3 |
| C | 15 | 197 | 6547820 | 83574.45 | 275 | 274 | 78.3 |
| C | 4 | 111 | 3171246 | 40475.05 | 275 | 274 | 78.3 |
| C | 6 | 143 | 1372735 | 17518.42 | 275 | 274 | 78.3 |
| D | 7 | 61 | 6701659 | 57260.49 | 417 | 403 | 117.0 |
| D | 2 | 37 | 1756739 | 15007.43 | 417 | 403 | 117.0 |
| D | 12 | 6 | 1090794 | 9317.11 | 417 | 403 | 117.0 |
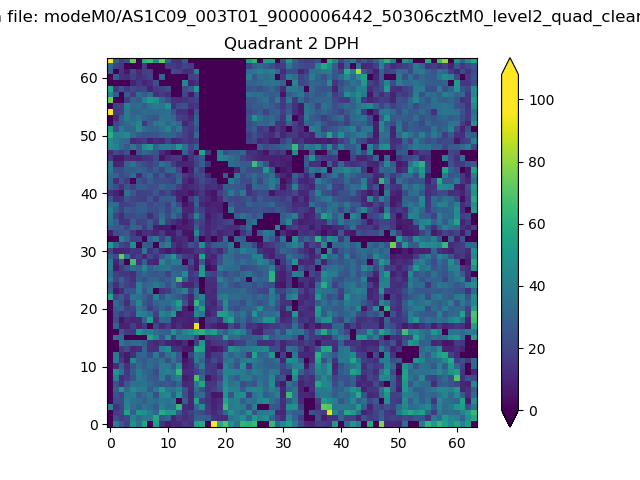
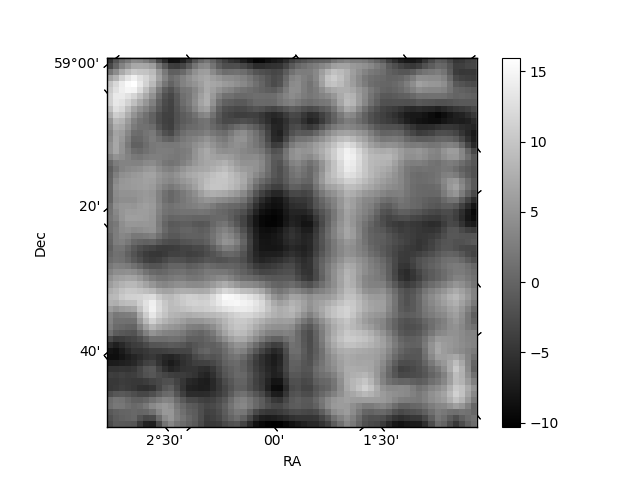
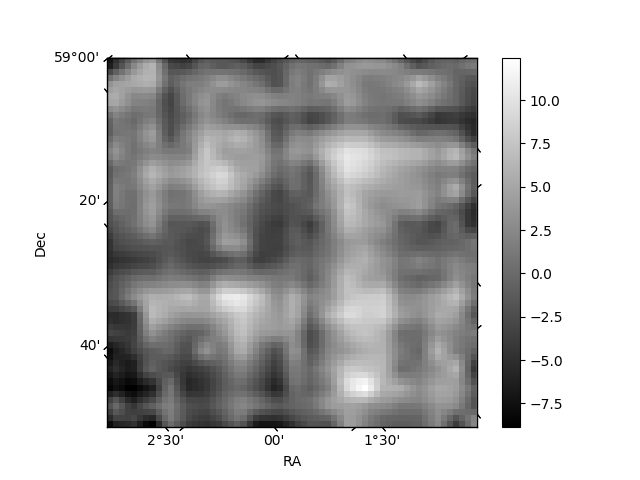
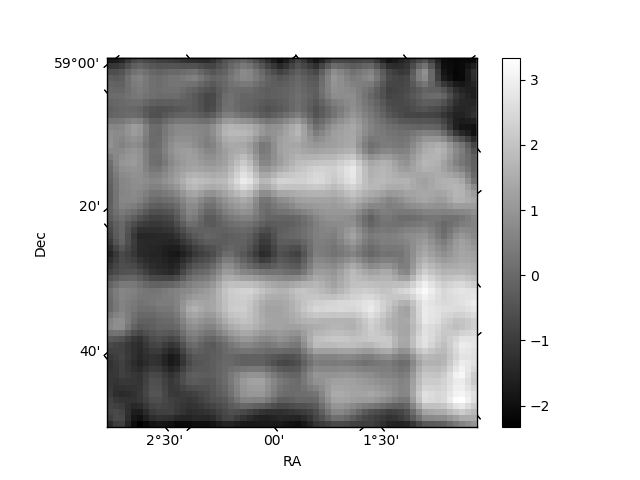
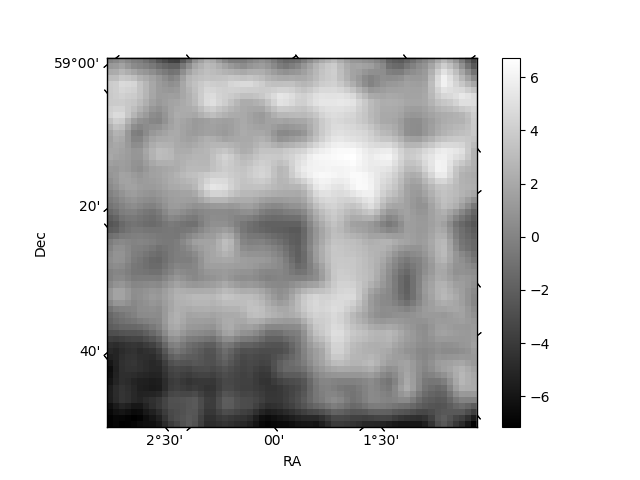
Histogram calculated using DETX and DETY for each event in the final _common_clean file
| Quadrant A | 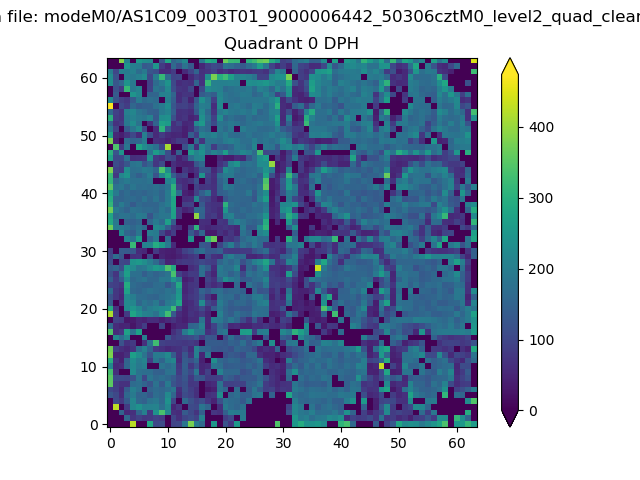 |
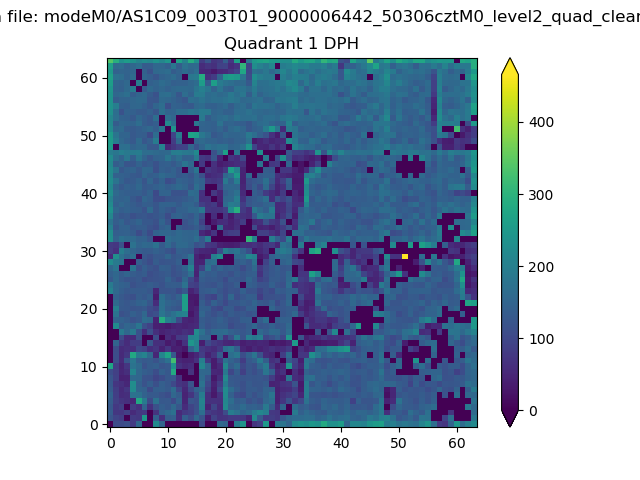 |
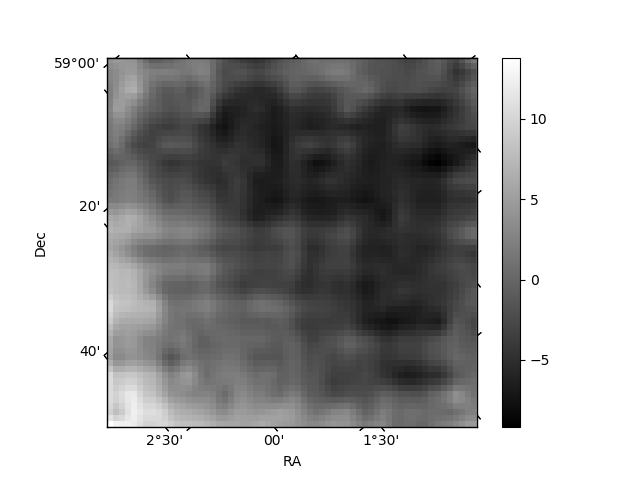
Quadrant B |
|---|---|---|---|
| Quadrant D | 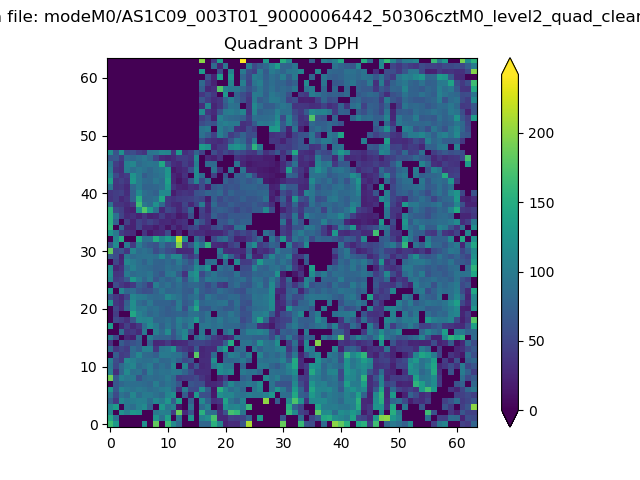 |
 |
Quadrant C |
| Plot type | Count rate plots | Images |
|---|---|---|
| Comparison with Poisson distribution Blue bars denote a histogram of data divided into 1 sec bins. Red curve is a Poisson curve with rate = median count rate of data. |
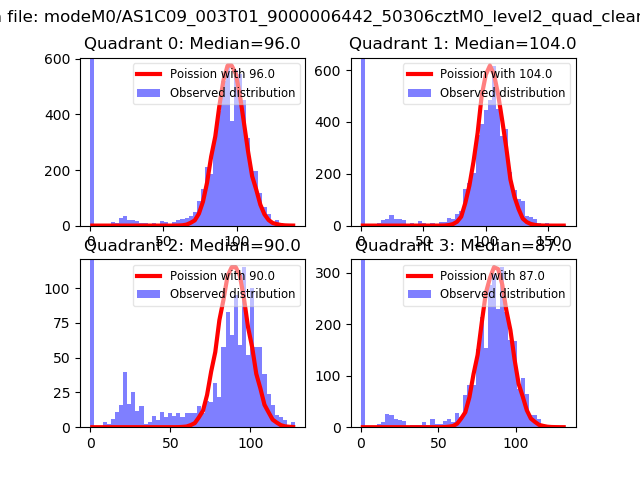 |
 |
| Quadrant-wise count rates Data is divided into 100 sec bins |
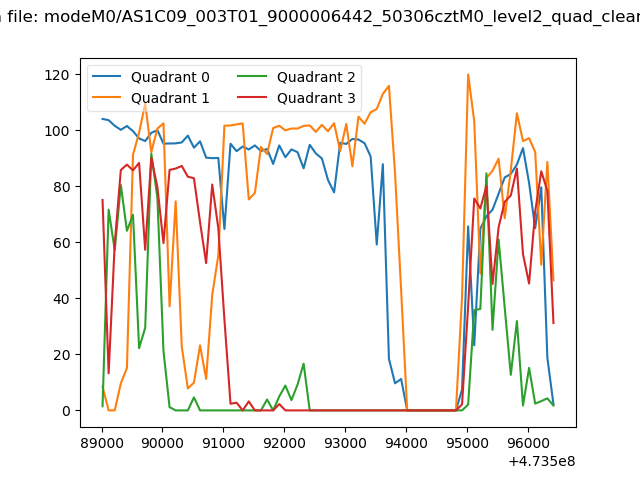 |
|
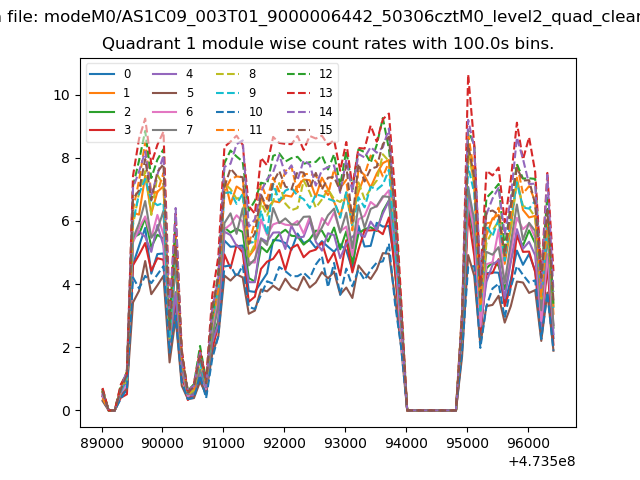
| Module-wise count rates for Quadrant A Data is divided into 100 sec bins |
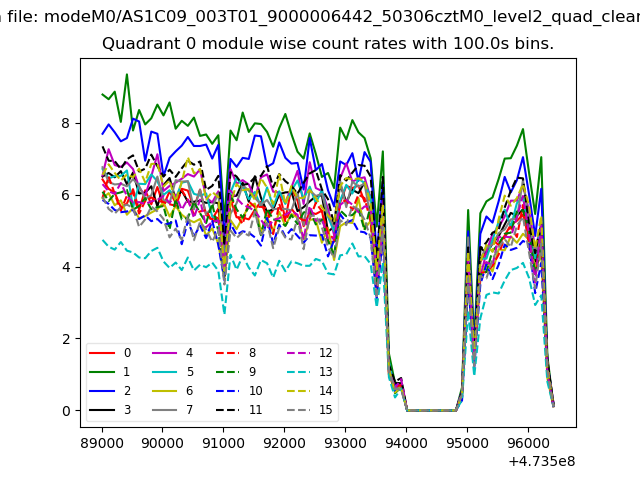 |
 |
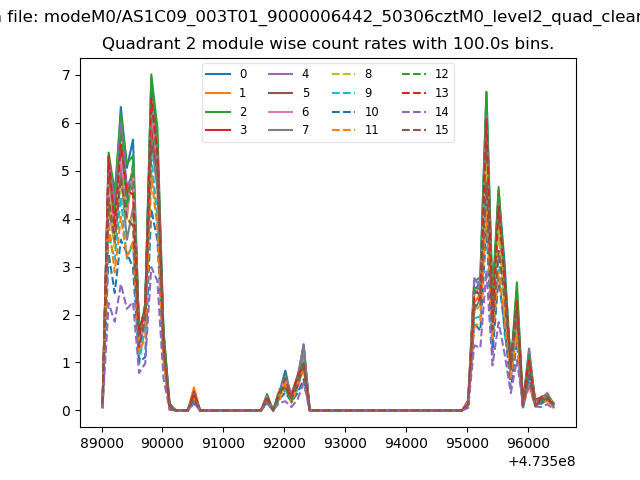
| Module-wise count rates for Quadrant B Data is divided into 100 sec bins |
 |
 |
| Module-wise count rates for Quadrant C Data is divided into 100 sec bins |
 |
 |
| Module-wise count rates for Quadrant D Data is divided into 100 sec bins |
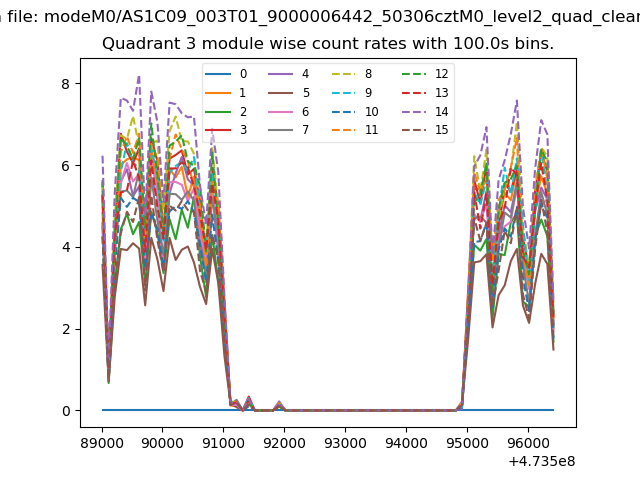 |
 |
| Parameter | Plot |
|---|---|
| CZT HV Monitor | 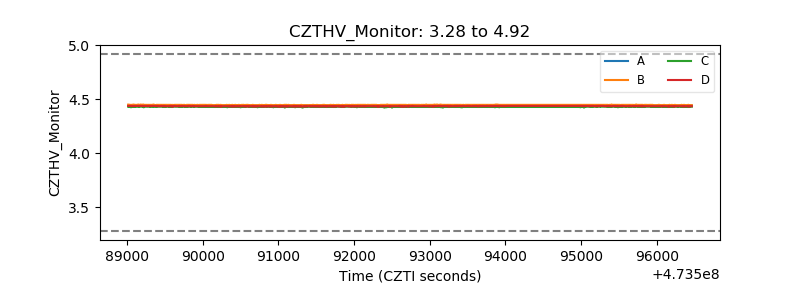 |
| D_VDD | 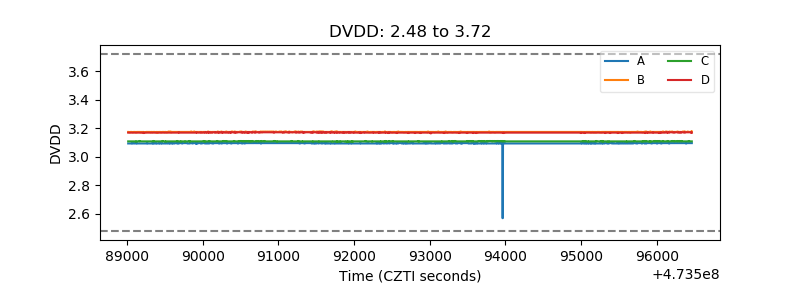 |
| Temperature 1 | 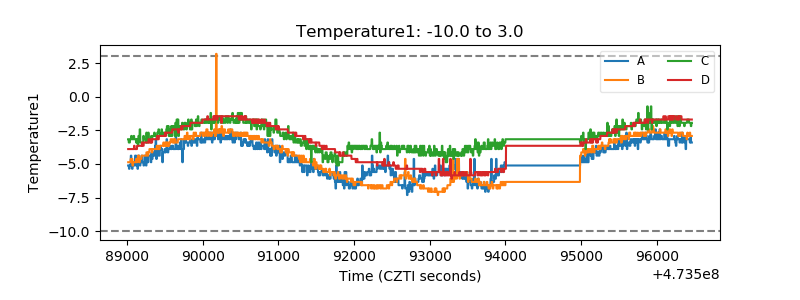 |
| Veto HV Monitor | 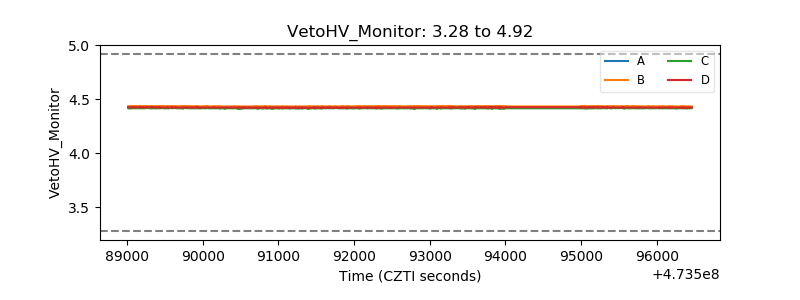 |
| Veto LLD | 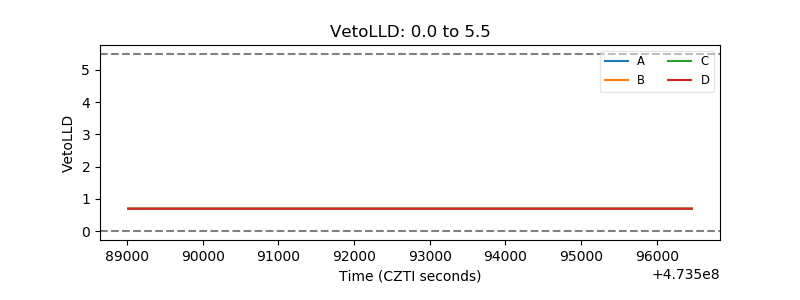 |
| Alpha Counter | 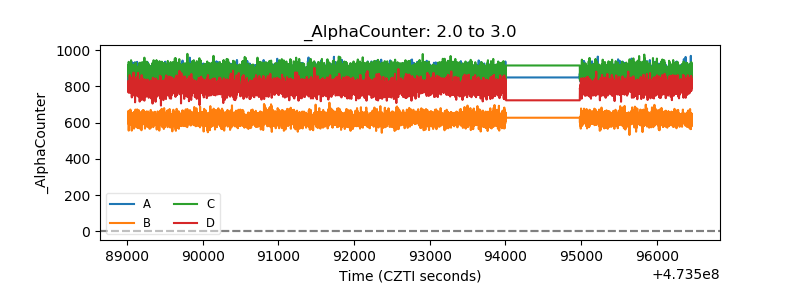 |
| _CPM_Rate | 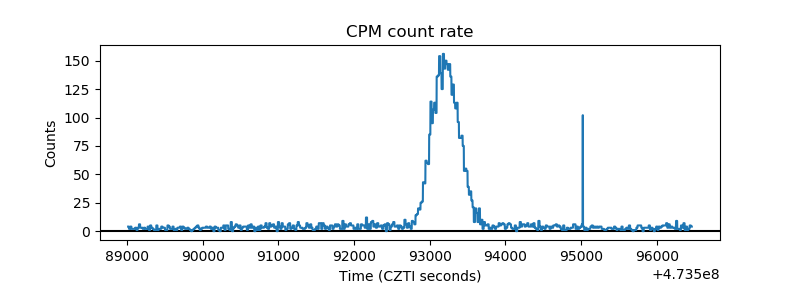 |
| CZT Counter | 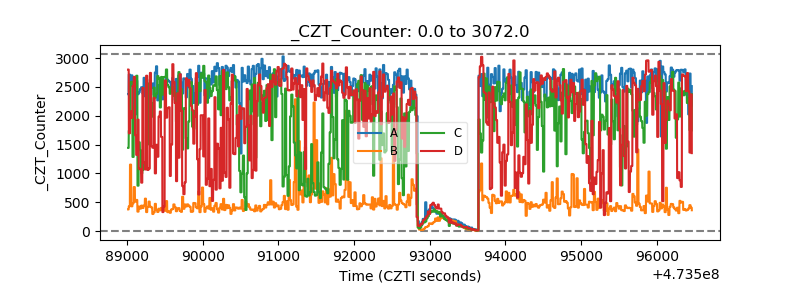 |
| +2.5 Volts monitor | 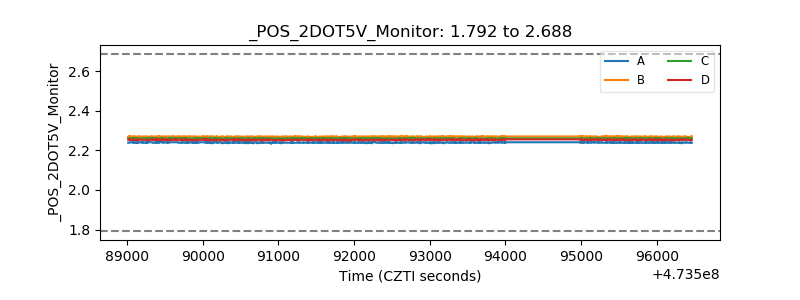 |
| +5 Volts monitor |  |
| _ROLL_ROT | 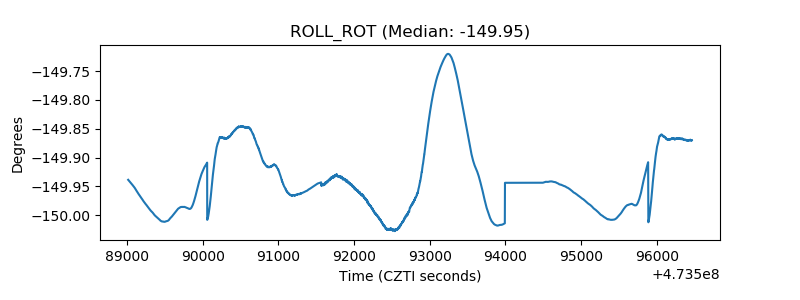 |
| _Roll_DEC | 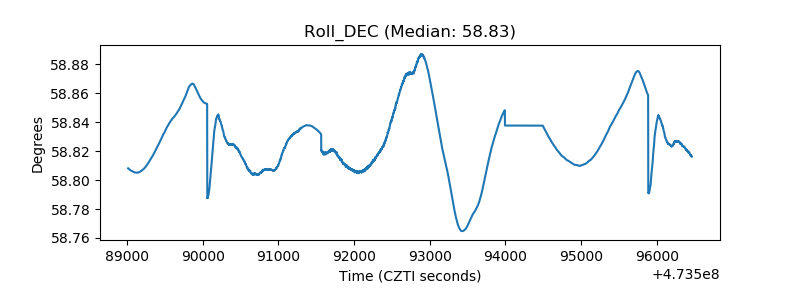 |
| _Roll_RA | 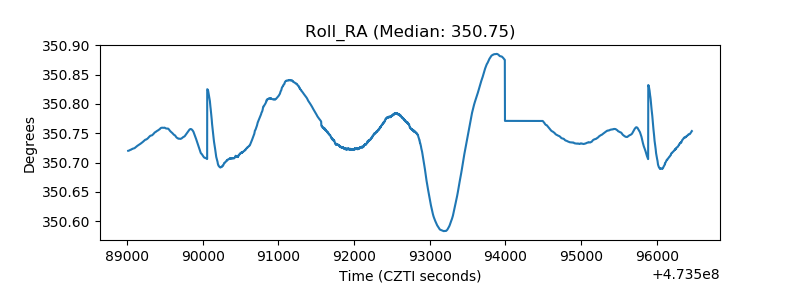 |
| Veto Counter | 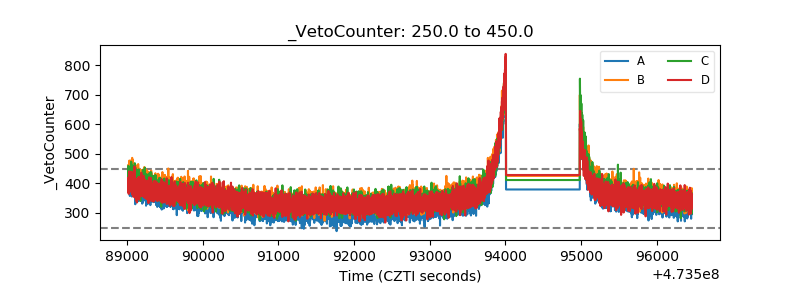 |