| Param | Original file | Final file |
|---|---|---|
| Filename | modeM0/AS1C09_003T01_9000006442_50308cztM0_level2.fits | modeM0/AS1C09_003T01_9000006442_50308cztM0_level2_quad_clean.evt |
| Size (bytes) | 1,213,531,200 | 58,507,200 |
| Size | 1.1 GB | 55.8 MB |
| Events in quadrant A | 7,688,852 | 511,341 |
| Events in quadrant B | 6,358,915 | 630,721 |
| Events in quadrant C | 14,224,499 | 32,321 |
| Events in quadrant D | 16,113,070 | 113,615 |
| Mode M9 | |||
|---|---|---|---|
| Quadrant | BADHDUFLAG | Total packets | Discarded packets |
| A | 0 | 1 | 0 |
| B | 0 | 1 | 0 |
| C | 0 | 1 | 0 |
| D | 0 | 1 | 0 |
| Mode M0 | |||
|---|---|---|---|
| Quadrant | BADHDUFLAG | Total packets | Discarded packets |
| A | 0 | 27509 | 1 |
| B | 0 | 23668 | 1 |
| C | 0 | 47014 | 1 |
| D | 0 | 52703 | 1 |
| Mode SS | |||
|---|---|---|---|
| Quadrant | BADHDUFLAG | Total packets | Discarded packets |
| A | 0 | 140 | 0 |
| B | 0 | 140 | 0 |
| C | 0 | 140 | 0 |
| D | 0 | 140 | 0 |
| Quadrant | Total seconds | Saturated seconds | Saturation percentage |
|---|---|---|---|
| A | 6935 | 1686 | 24.311464% |
| B | 6936 | 1023 | 14.749135% |
| C | 6936 | 6619 | 95.429642% |
| D | 6936 | 5741 | 82.771050% |
Noise dominated data is calculated using 1-second bins in cleaned event files. If a bin has >2000 counts, and if more than 50% of those come from <1% of pixels, then it is considered to be noise-dominated and hence unusable.
| Quadrant | # 1 sec bins | Bins with >0 counts | Bins with >2000 counts | High rate bins dominated by noise | Noise dominated (total time) | Noise dominated (detector-on time) | Marked lightcurve |
|---|---|---|---|---|---|---|---|
| A | 7050 | 6937 | 1242 | 1242 | 17.62% | 17.90% | 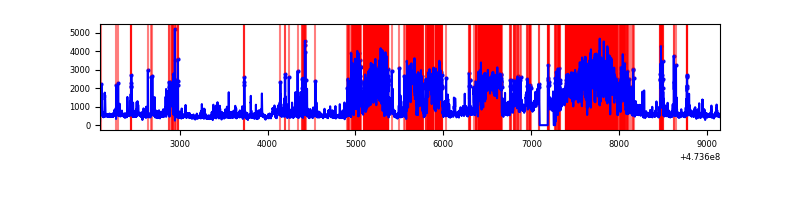 |
| B | 7051 | 6938 | 600 | 600 | 8.51% | 8.65% | 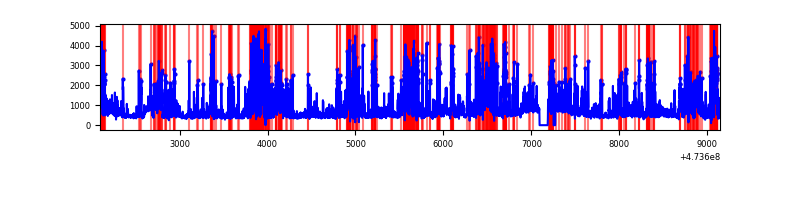 |
| C | 7051 | 6937 | 3910 | 3910 | 55.45% | 56.36% | 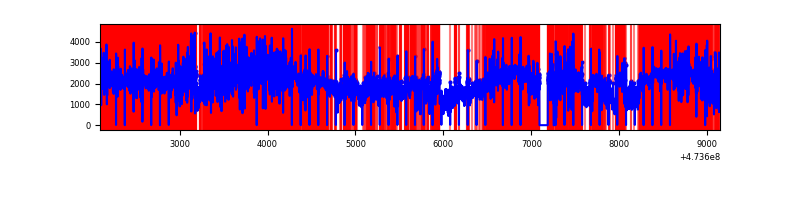 |
| D | 7051 | 6936 | 5418 | 5418 | 76.84% | 78.11% | 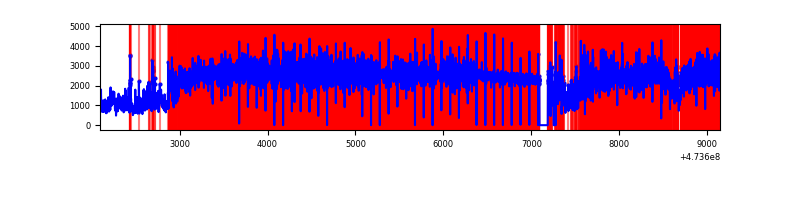 |
Top three noisy pixels from each quadrant. If the there are fewer than three noisy pixels in the level2.evt file, extra rows are filled as -1
| Pixel properties | Quadrant properties | ||||||
|---|---|---|---|---|---|---|---|
| Quadrant | DetID | PixID | Counts | Sigma | Mean | Median | Sigma |
| A | 0 | 98 | 1561697 | 9344.07 | 675 | 659 | 167.1 |
| A | 3 | 231 | 1485622 | 8888.7 | 675 | 659 | 167.1 |
| A | 4 | 249 | 655486 | 3919.67 | 675 | 659 | 167.1 |
| B | 1 | 238 | 1620289 | 10714.15 | 707 | 682 | 151.2 |
| B | 4 | 206 | 1451225 | 9595.74 | 707 | 682 | 151.2 |
| B | 5 | 185 | 101628 | 667.79 | 707 | 682 | 151.2 |
| C | 15 | 197 | 6123036 | 116785.32 | 177 | 175 | 52.4 |
| C | 4 | 111 | 4599166 | 87719.56 | 177 | 175 | 52.4 |
| C | 6 | 143 | 1562447 | 29798.23 | 177 | 175 | 52.4 |
| D | 7 | 61 | 10946176 | 103570.44 | 371 | 359 | 105.7 |
| D | 2 | 37 | 1639082 | 15505.76 | 371 | 359 | 105.7 |
| D | 15 | 108 | 470940 | 4452.69 | 371 | 359 | 105.7 |
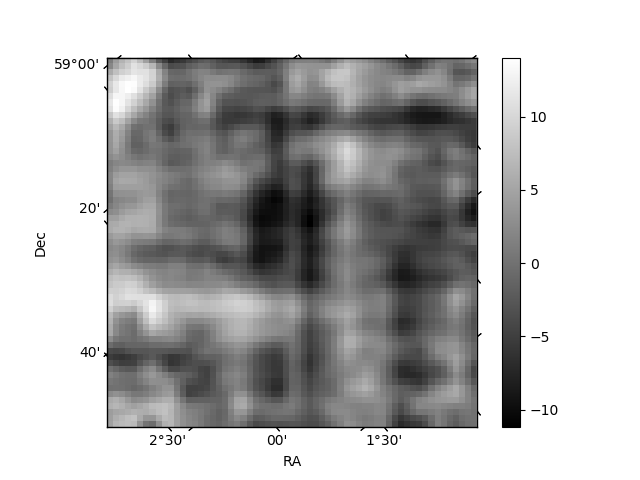
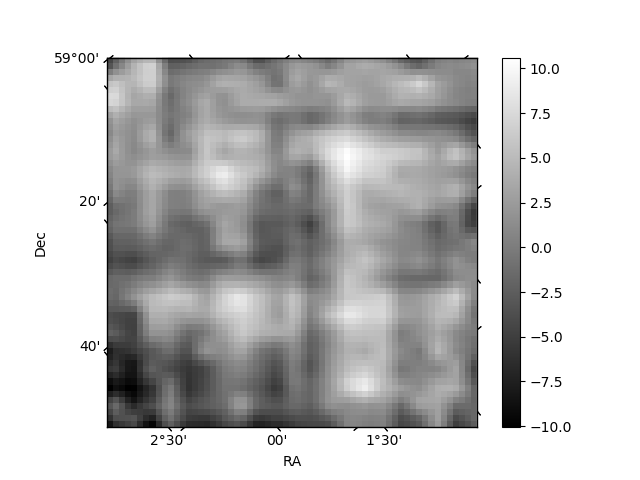
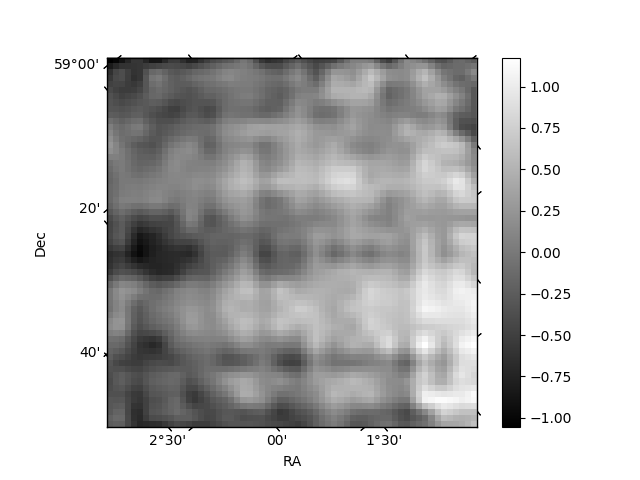
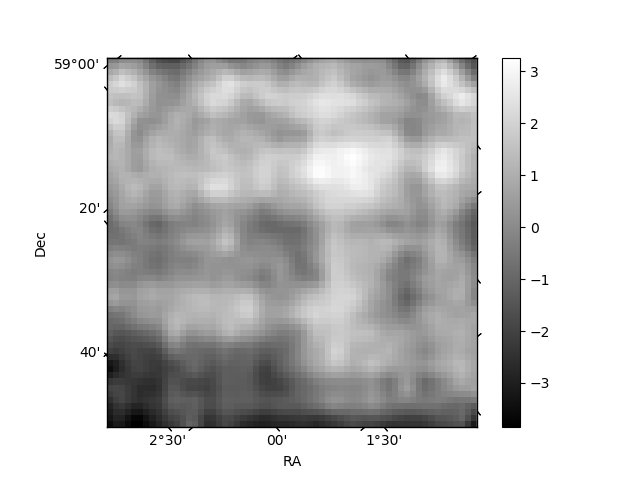
Histogram calculated using DETX and DETY for each event in the final _common_clean file
| Quadrant A | 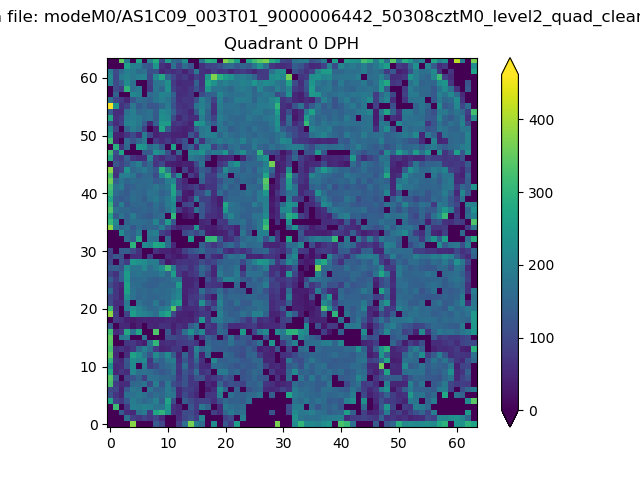 |
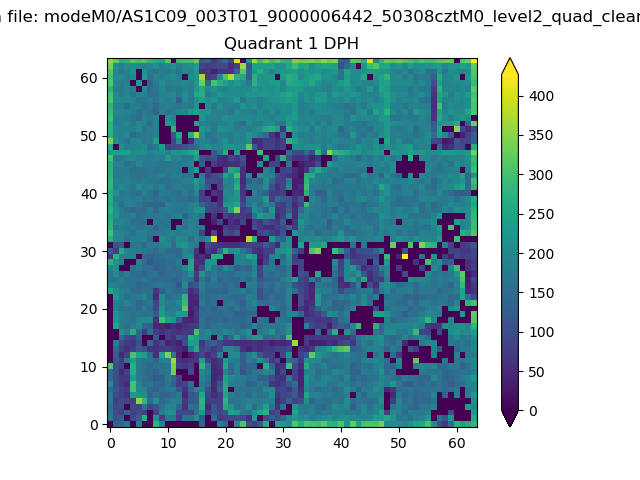 |
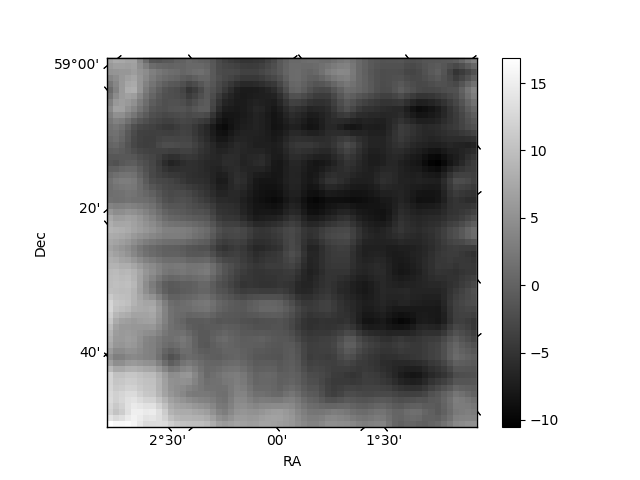
Quadrant B |
|---|---|---|---|
| Quadrant D | 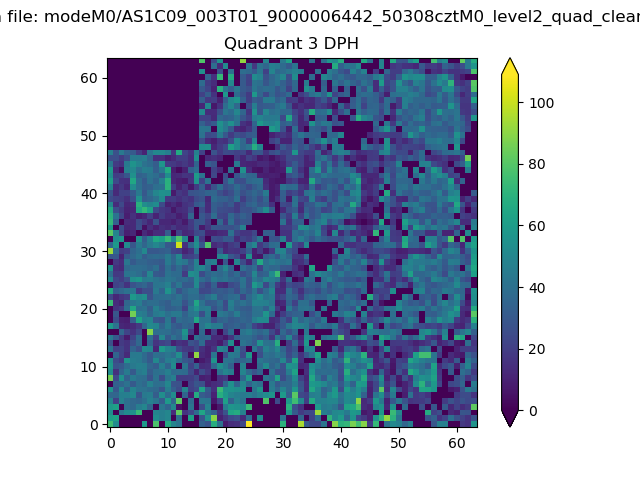 |
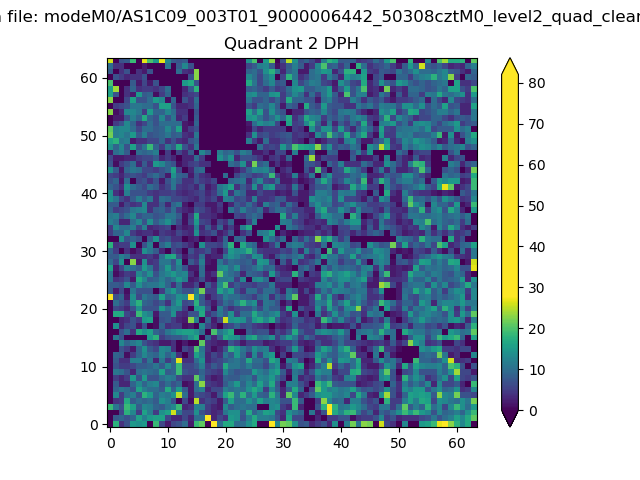 |
Quadrant C |
| Plot type | Count rate plots | Images |
|---|---|---|
| Comparison with Poisson distribution Blue bars denote a histogram of data divided into 1 sec bins. Red curve is a Poisson curve with rate = median count rate of data. |
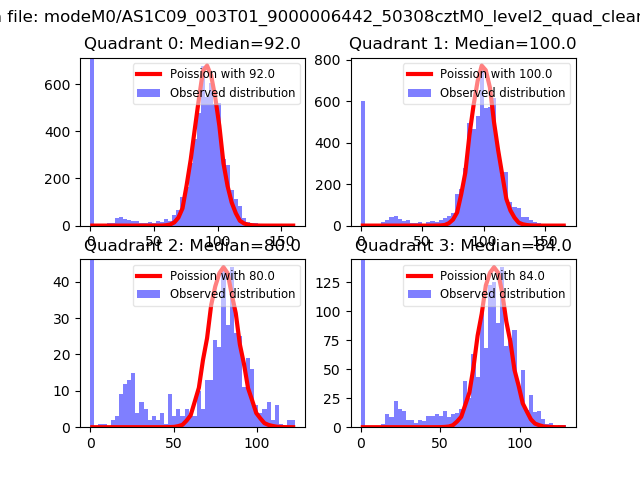 |
 |
| Quadrant-wise count rates Data is divided into 100 sec bins |
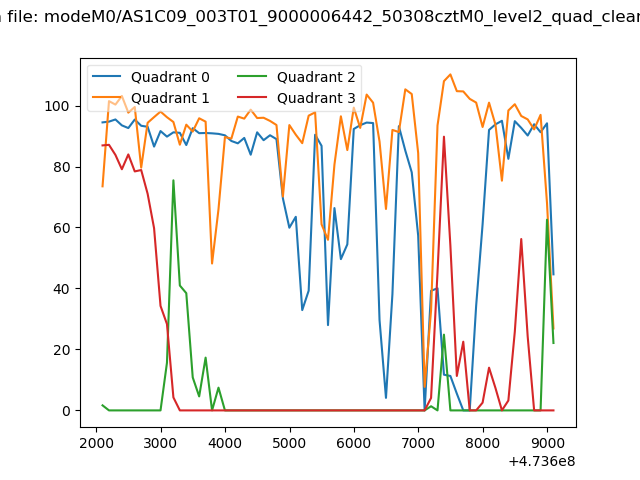 |
|
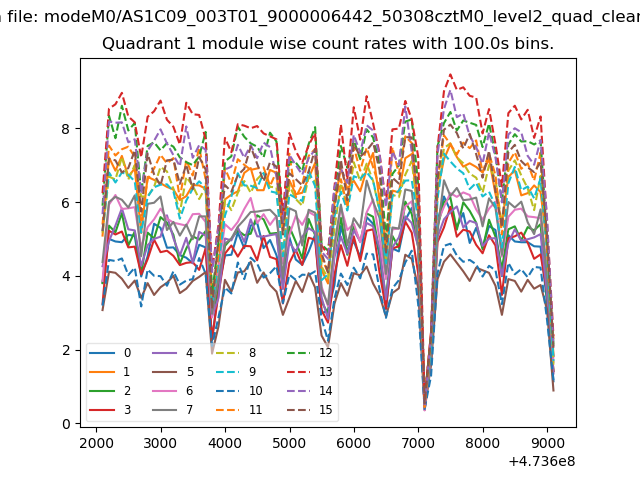
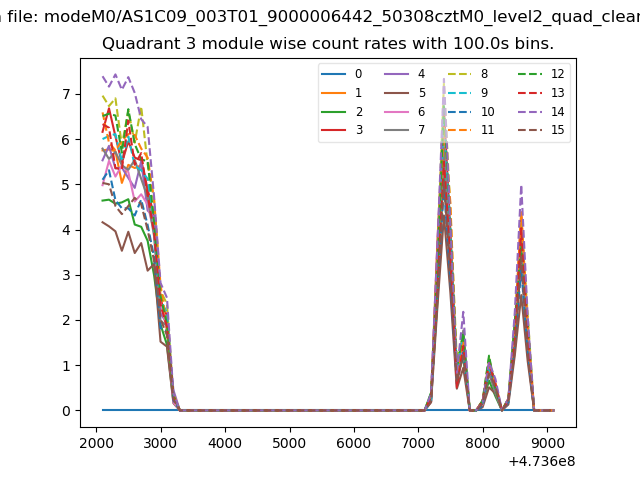
| Module-wise count rates for Quadrant A Data is divided into 100 sec bins |
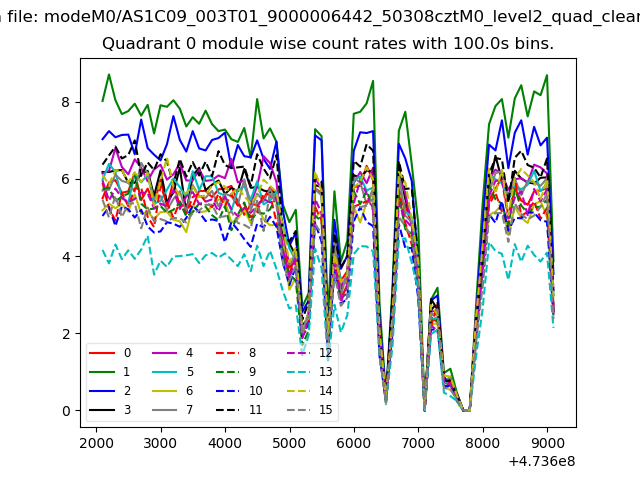 |
 |
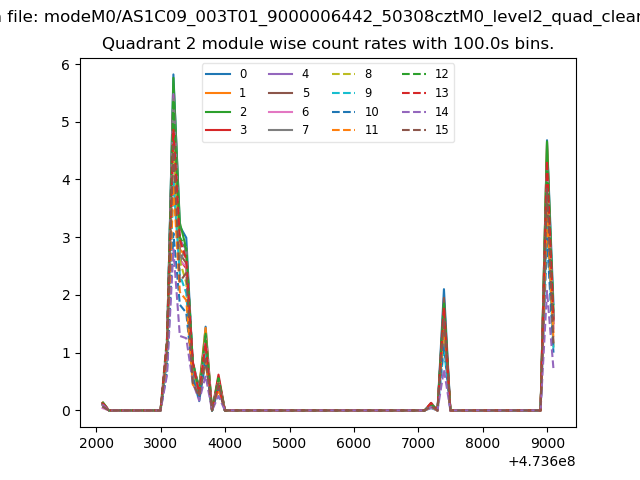
| Module-wise count rates for Quadrant B Data is divided into 100 sec bins |
 |
 |
| Module-wise count rates for Quadrant C Data is divided into 100 sec bins |
 |
 |
| Module-wise count rates for Quadrant D Data is divided into 100 sec bins |
 |
 |
| Parameter | Plot |
|---|---|
| CZT HV Monitor |  |
| D_VDD | 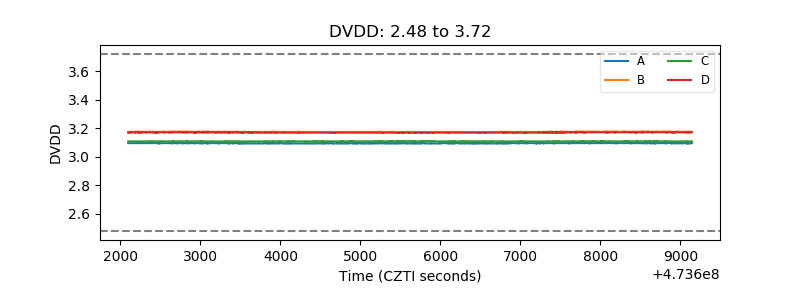 |
| Temperature 1 | 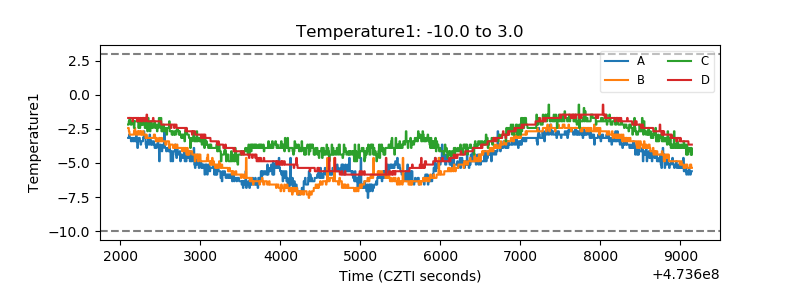 |
| Veto HV Monitor | 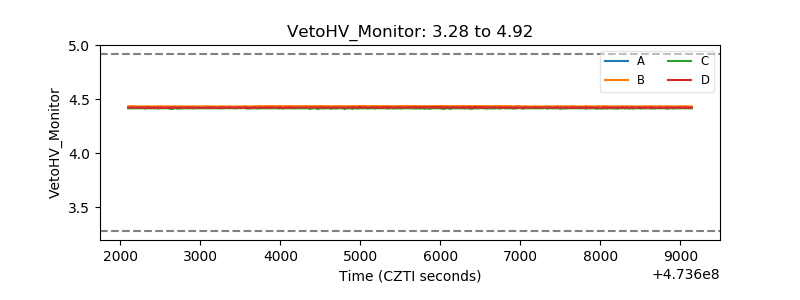 |
| Veto LLD | 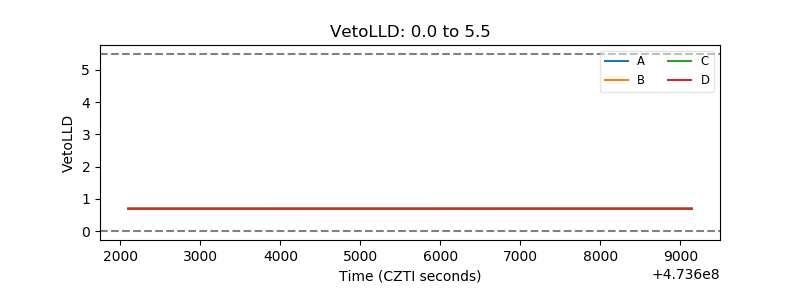 |
| Alpha Counter | 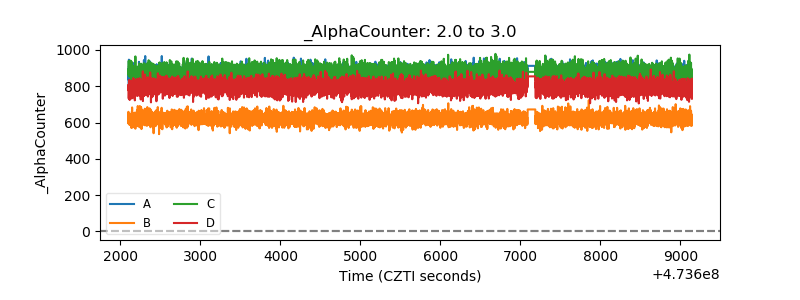 |
| _CPM_Rate | 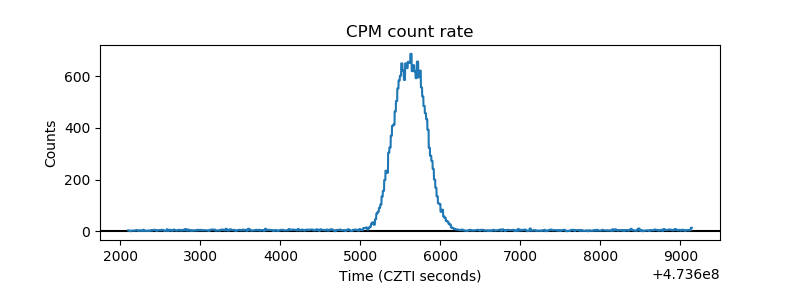 |
| CZT Counter | 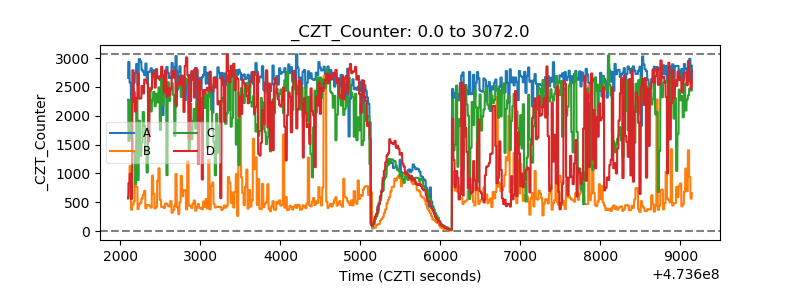 |
| +2.5 Volts monitor | 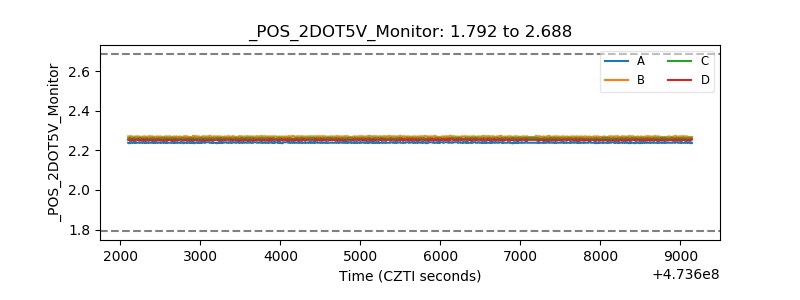 |
| +5 Volts monitor |  |
| _ROLL_ROT | 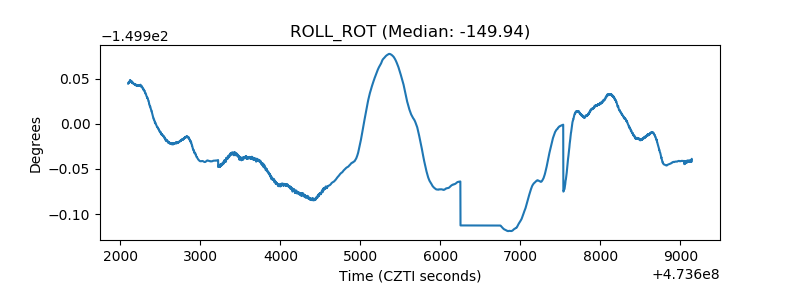 |
| _Roll_DEC | 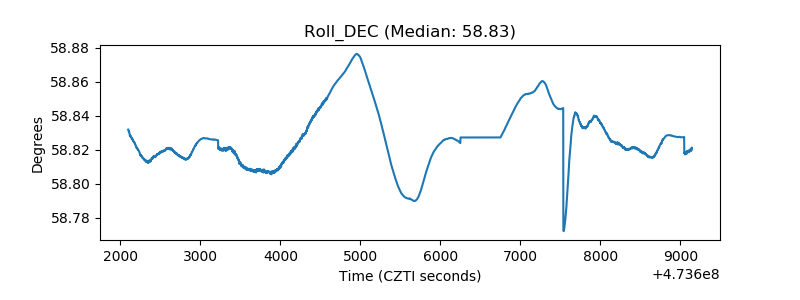 |
| _Roll_RA | 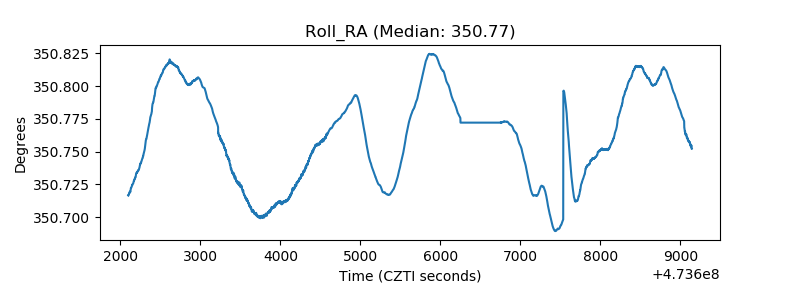 |
| Veto Counter |  |