| Param | Original file | Final file |
|---|---|---|
| Filename | modeM0/AS1C09_003T01_9000006442_50309cztM0_level2.fits | modeM0/AS1C09_003T01_9000006442_50309cztM0_level2_quad_clean.evt |
| Size (bytes) | 1,321,073,280 | 56,952,000 |
| Size | 1.2 GB | 54.3 MB |
| Events in quadrant A | 10,017,840 | 451,921 |
| Events in quadrant B | 5,818,341 | 691,270 |
| Events in quadrant C | 15,320,498 | 63,274 |
| Events in quadrant D | 17,186,309 | 13,354 |
| Mode M0 | |||
|---|---|---|---|
| Quadrant | BADHDUFLAG | Total packets | Discarded packets |
| A | 0 | 34735 | 0 |
| B | 0 | 22280 | 0 |
| C | 0 | 50500 | 0 |
| D | 0 | 56004 | 3 |
| Mode SS | |||
|---|---|---|---|
| Quadrant | BADHDUFLAG | Total packets | Discarded packets |
| A | 0 | 144 | 0 |
| B | 0 | 144 | 0 |
| C | 0 | 144 | 0 |
| D | 0 | 144 | 0 |
| Quadrant | Total seconds | Saturated seconds | Saturation percentage |
|---|---|---|---|
| A | 7243 | 2577 | 35.579180% |
| B | 7243 | 595 | 8.214828% |
| C | 7243 | 6582 | 90.873947% |
| D | 7242 | 7114 | 98.232532% |
Noise dominated data is calculated using 1-second bins in cleaned event files. If a bin has >2000 counts, and if more than 50% of those come from <1% of pixels, then it is considered to be noise-dominated and hence unusable.
| Quadrant | # 1 sec bins | Bins with >0 counts | Bins with >2000 counts | High rate bins dominated by noise | Noise dominated (total time) | Noise dominated (detector-on time) | Marked lightcurve |
|---|---|---|---|---|---|---|---|
| A | 7243 | 7243 | 2130 | 2130 | 29.41% | 29.41% | 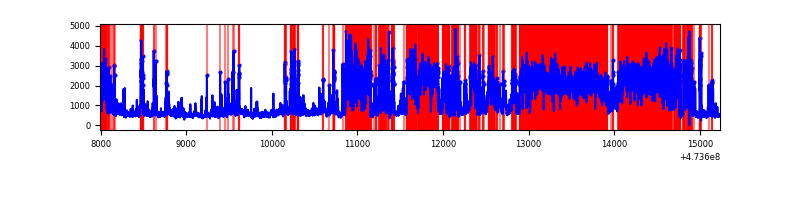 |
| B | 7243 | 7243 | 386 | 386 | 5.33% | 5.33% | 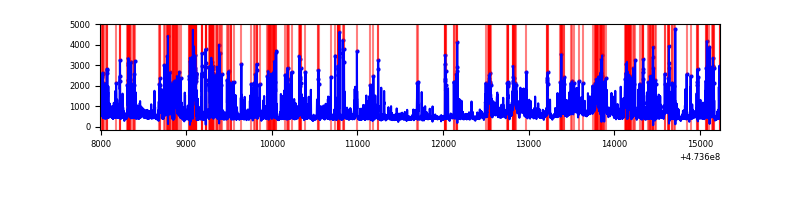 |
| C | 7242 | 7242 | 4700 | 4700 | 64.90% | 64.90% | 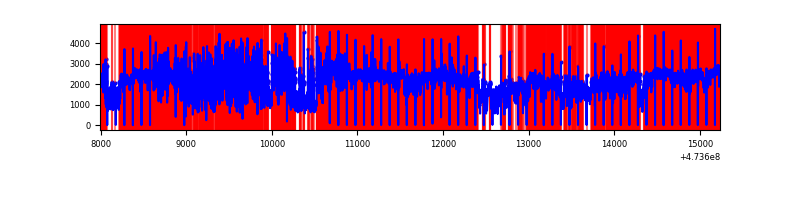 |
| D | 7241 | 7238 | 6137 | 6137 | 84.75% | 84.79% | 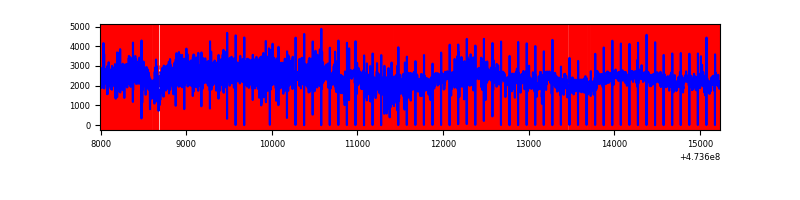 |
Top three noisy pixels from each quadrant. If the there are fewer than three noisy pixels in the level2.evt file, extra rows are filled as -1
| Pixel properties | Quadrant properties | ||||||
|---|---|---|---|---|---|---|---|
| Quadrant | DetID | PixID | Counts | Sigma | Mean | Median | Sigma |
| A | 0 | 98 | 4714205 | 28618.49 | 660 | 643 | 164.7 |
| A | 3 | 231 | 556169 | 3372.89 | 660 | 643 | 164.7 |
| A | 6 | 250 | 514286 | 3118.59 | 660 | 643 | 164.7 |
| B | 4 | 206 | 1603320 | 10101.43 | 741 | 717 | 158.7 |
| B | 1 | 238 | 373299 | 2348.44 | 741 | 717 | 158.7 |
| B | 10 | 254 | 299102 | 1880.76 | 741 | 717 | 158.7 |
| C | 15 | 197 | 6192904 | 103927.87 | 187 | 184 | 59.6 |
| C | 4 | 111 | 3332841 | 55929.53 | 187 | 184 | 59.6 |
| C | 15 | 230 | 1382151 | 23192.53 | 187 | 184 | 59.6 |
| D | 7 | 61 | 13662373 | 233226.18 | 189 | 181 | 58.6 |
| D | 2 | 37 | 1361581 | 23240.35 | 189 | 181 | 58.6 |
| D | 15 | 108 | 475849 | 8120.09 | 189 | 181 | 58.6 |
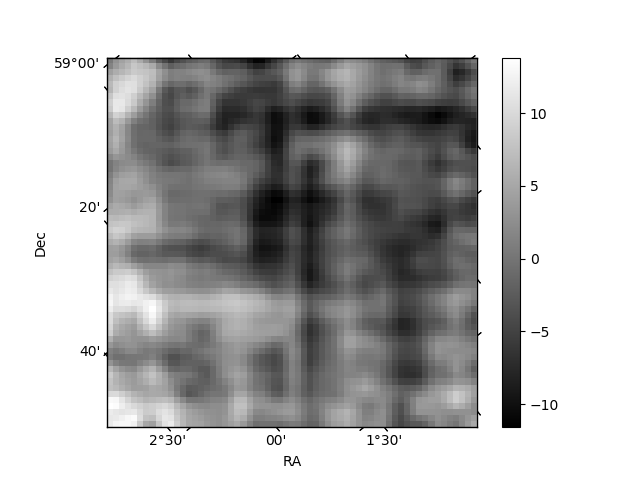
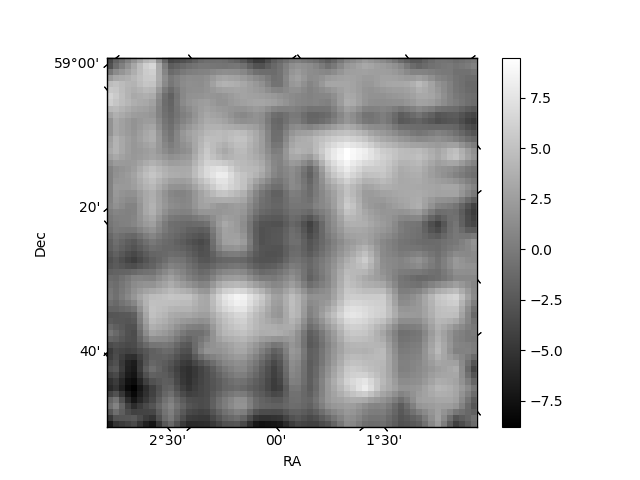
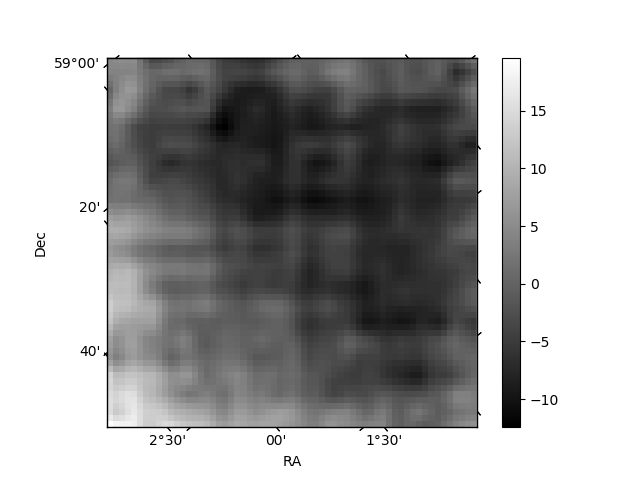
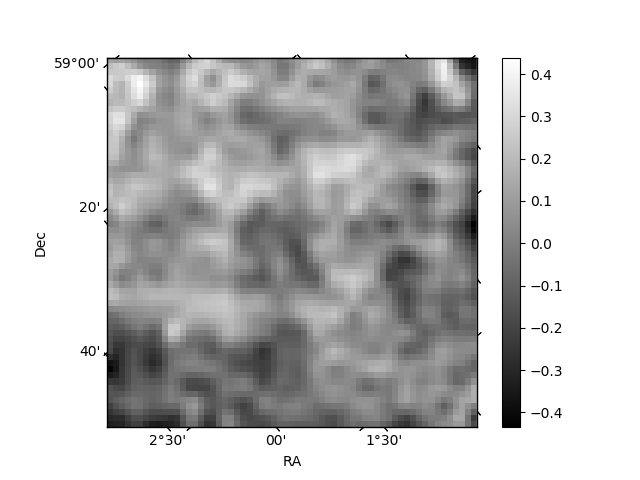
Histogram calculated using DETX and DETY for each event in the final _common_clean file
| Quadrant A | 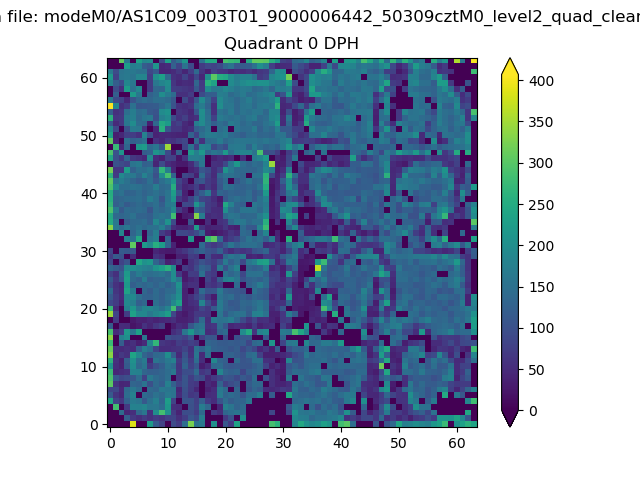 |
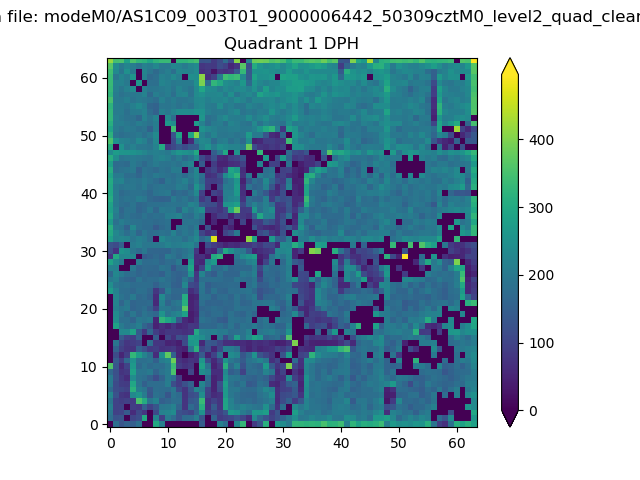 |
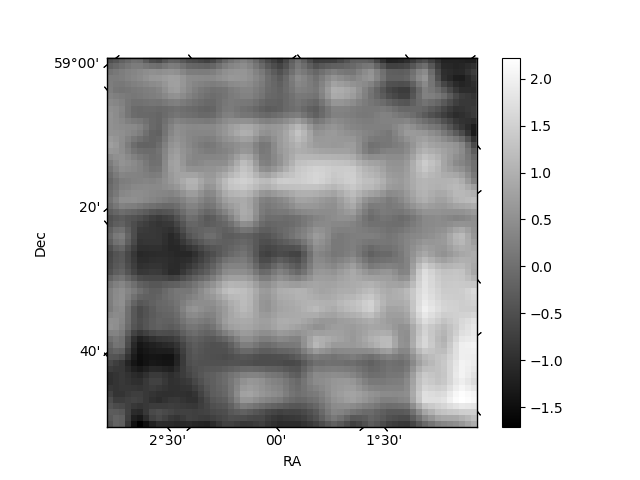
Quadrant B |
|---|---|---|---|
| Quadrant D |  |
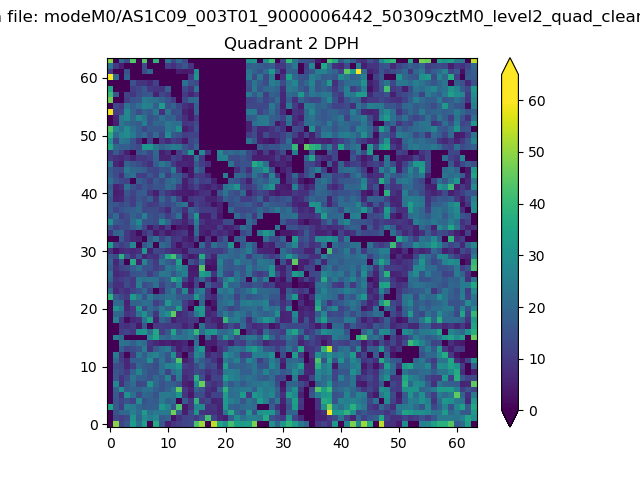 |
Quadrant C |
| Plot type | Count rate plots | Images |
|---|---|---|
| Comparison with Poisson distribution Blue bars denote a histogram of data divided into 1 sec bins. Red curve is a Poisson curve with rate = median count rate of data. |
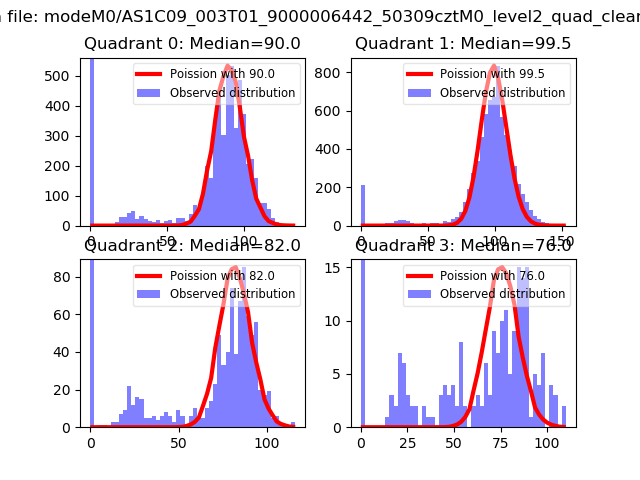 |
 |
| Quadrant-wise count rates Data is divided into 100 sec bins |
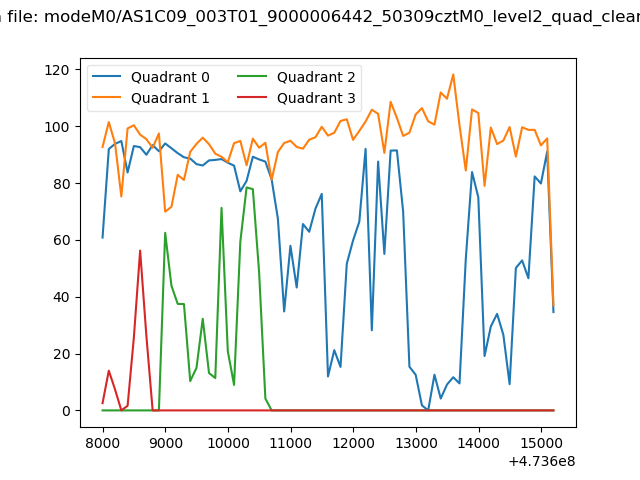 |
|
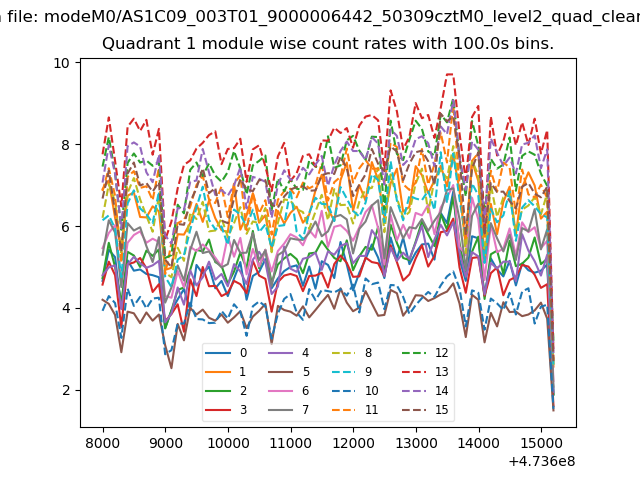
| Module-wise count rates for Quadrant A Data is divided into 100 sec bins |
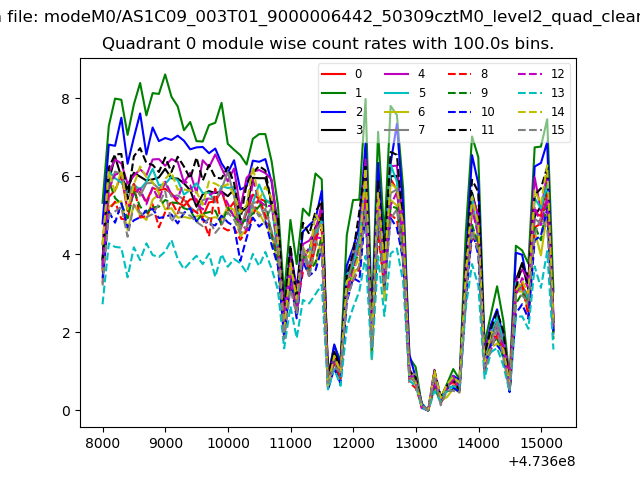 |
 |
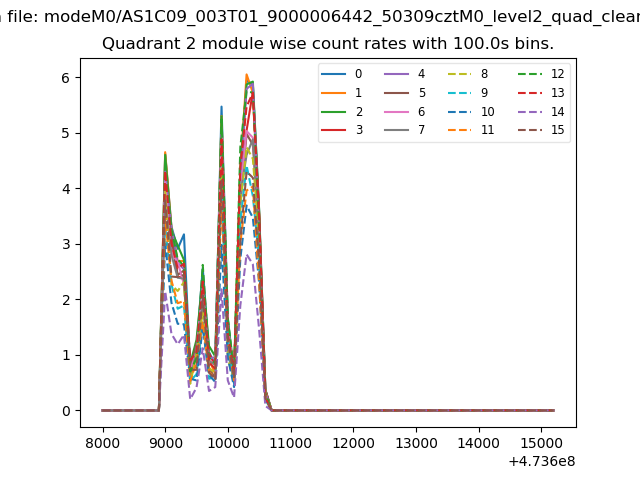
| Module-wise count rates for Quadrant B Data is divided into 100 sec bins |
 |
 |
| Module-wise count rates for Quadrant C Data is divided into 100 sec bins |
 |
 |
| Module-wise count rates for Quadrant D Data is divided into 100 sec bins |
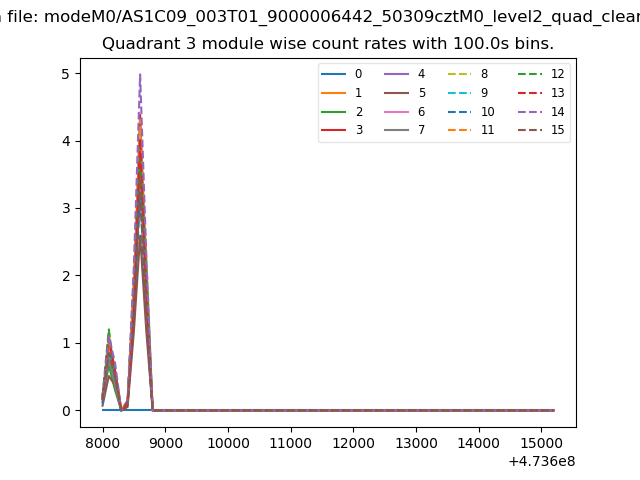 |
 |
| Parameter | Plot |
|---|---|
| CZT HV Monitor | 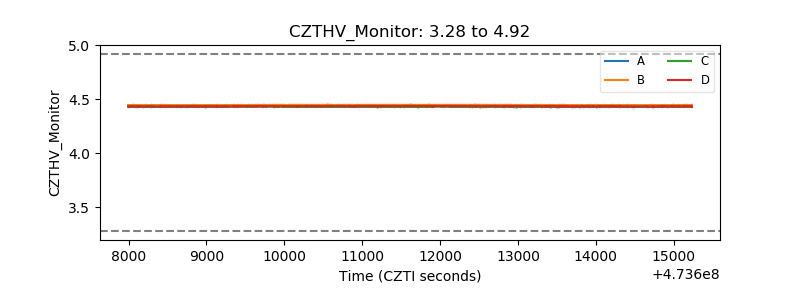 |
| D_VDD | 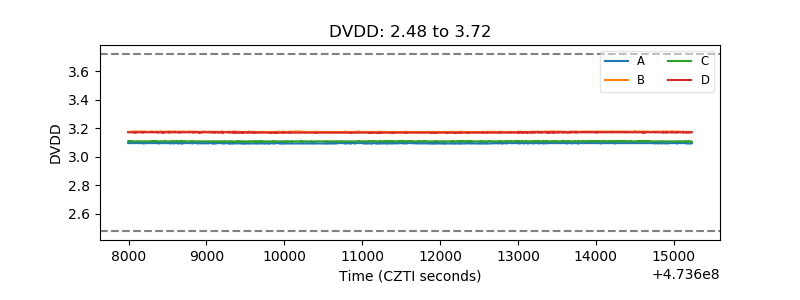 |
| Temperature 1 | 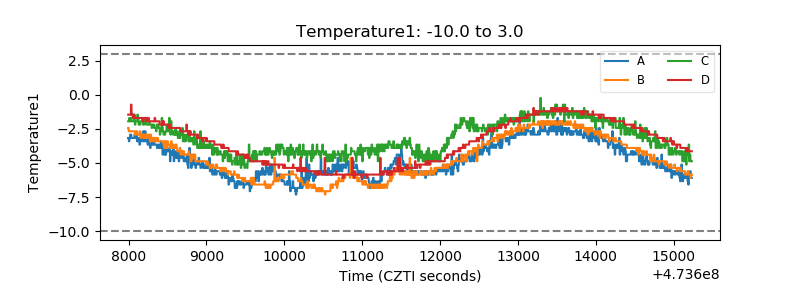 |
| Veto HV Monitor | 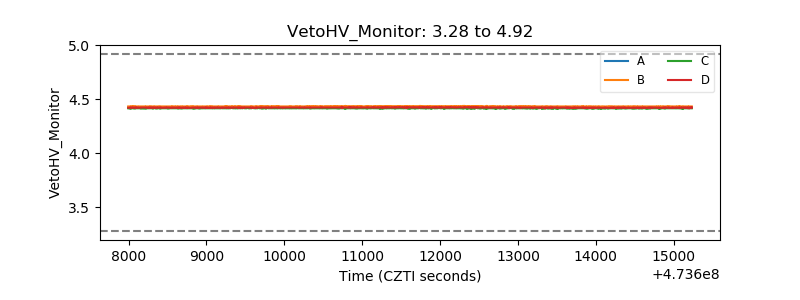 |
| Veto LLD | 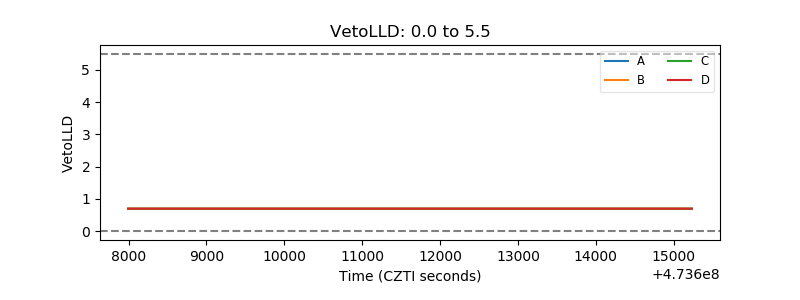 |
| Alpha Counter | 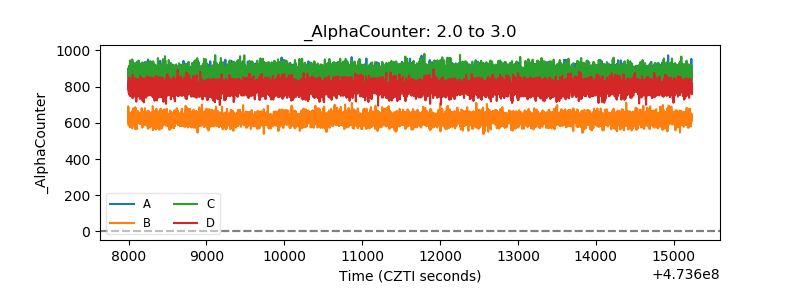 |
| _CPM_Rate | 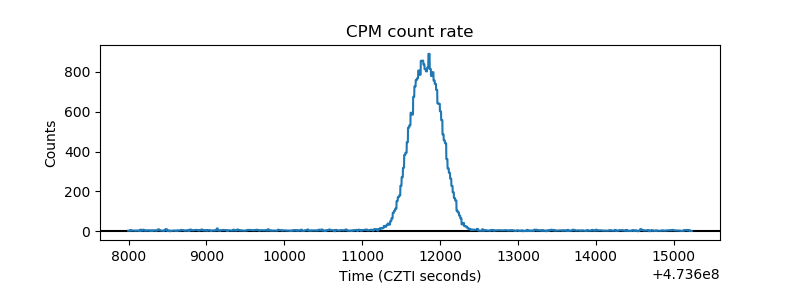 |
| CZT Counter | 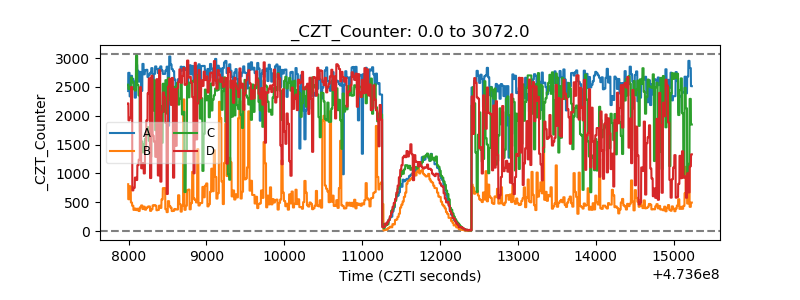 |
| +2.5 Volts monitor | 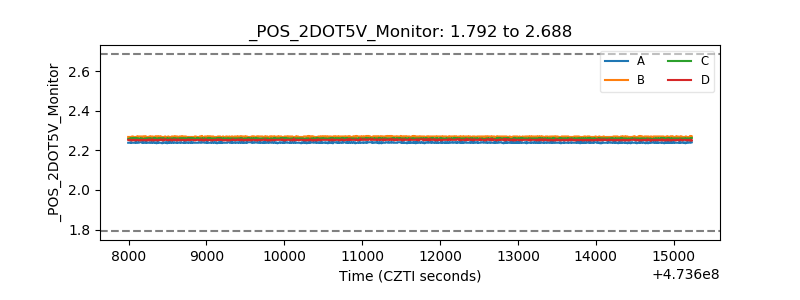 |
| +5 Volts monitor |  |
| _ROLL_ROT | 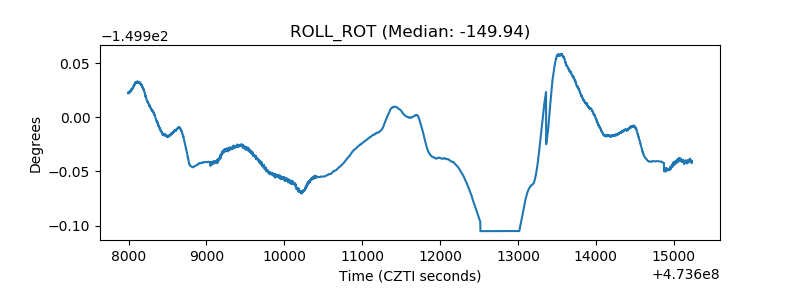 |
| _Roll_DEC | 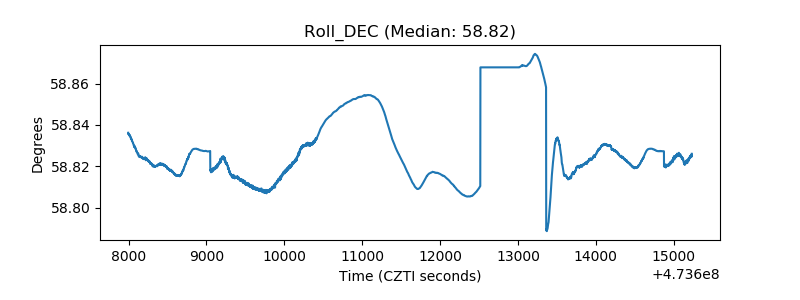 |
| _Roll_RA | 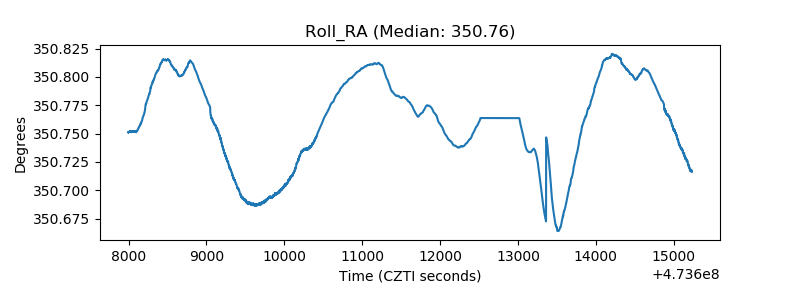 |
| Veto Counter | 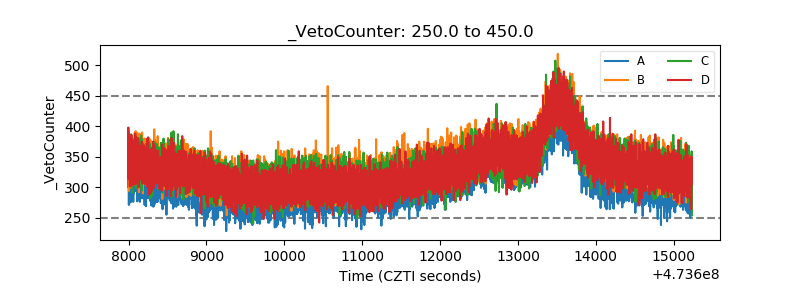 |