| Param | Original file | Final file |
|---|---|---|
| Filename | modeM0/AS1C09_003T01_9000006442_50313cztM0_level2.fits | modeM0/AS1C09_003T01_9000006442_50313cztM0_level2_quad_clean.evt |
| Size (bytes) | 3,445,257,600 | 136,215,360 |
| Size | 3.2 GB | 129.9 MB |
| Events in quadrant A | 32,898,417 | 921,224 |
| Events in quadrant B | 14,694,087 | 1,731,472 |
| Events in quadrant C | 39,771,934 | 28,499 |
| Events in quadrant D | 38,735,552 | 158,288 |
| Mode M9 | |||
|---|---|---|---|
| Quadrant | BADHDUFLAG | Total packets | Discarded packets |
| A | 0 | 13 | 0 |
| B | 0 | 13 | 0 |
| C | 0 | 13 | 0 |
| D | 0 | 13 | 0 |
| Mode M0 | |||
|---|---|---|---|
| Quadrant | BADHDUFLAG | Total packets | Discarded packets |
| A | 0 | 110672 | 3 |
| B | 0 | 56524 | 4 |
| C | 0 | 130847 | 3 |
| D | 0 | 127871 | 3 |
| Mode SS | |||
|---|---|---|---|
| Quadrant | BADHDUFLAG | Total packets | Discarded packets |
| A | 0 | 378 | 0 |
| B | 0 | 378 | 0 |
| C | 0 | 378 | 0 |
| D | 0 | 378 | 0 |
| Quadrant | Total seconds | Saturated seconds | Saturation percentage |
|---|---|---|---|
| A | 18631 | 9144 | 49.079491% |
| B | 18631 | 1546 | 8.297998% |
| C | 18631 | 18370 | 98.599109% |
| D | 18631 | 17003 | 91.261875% |
Noise dominated data is calculated using 1-second bins in cleaned event files. If a bin has >2000 counts, and if more than 50% of those come from <1% of pixels, then it is considered to be noise-dominated and hence unusable.
| Quadrant | # 1 sec bins | Bins with >0 counts | Bins with >2000 counts | High rate bins dominated by noise | Noise dominated (total time) | Noise dominated (detector-on time) | Marked lightcurve |
|---|---|---|---|---|---|---|---|
| A | 19836 | 18635 | 7729 | 7729 | 38.96% | 41.48% | 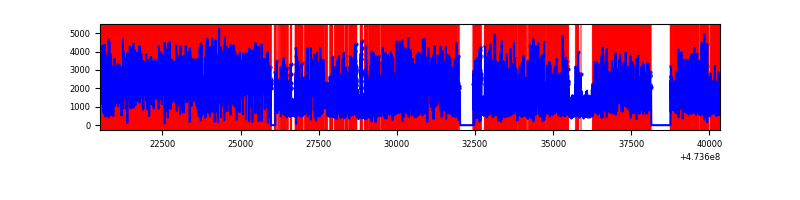 |
| B | 19836 | 18635 | 957 | 957 | 4.82% | 5.14% | 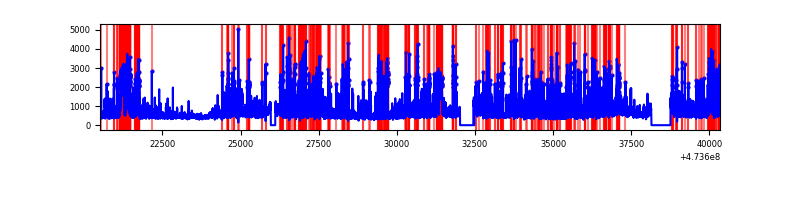 |
| C | 19835 | 18630 | 12462 | 12462 | 62.83% | 66.89% | 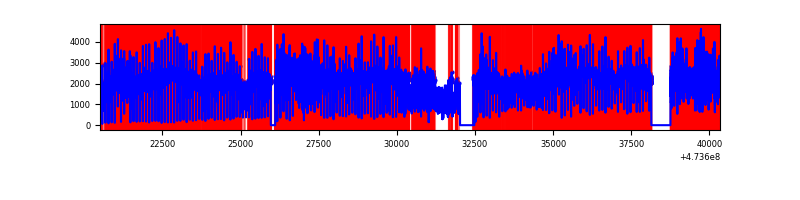 |
| D | 19836 | 18632 | 10704 | 10704 | 53.96% | 57.45% | 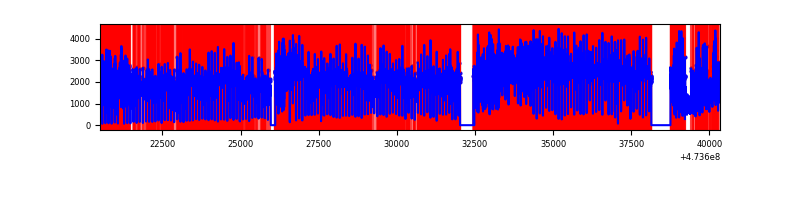 |
Top three noisy pixels from each quadrant. If the there are fewer than three noisy pixels in the level2.evt file, extra rows are filled as -1
| Pixel properties | Quadrant properties | ||||||
|---|---|---|---|---|---|---|---|
| Quadrant | DetID | PixID | Counts | Sigma | Mean | Median | Sigma |
| A | 0 | 98 | 10188347 | 26472.9 | 1537 | 1499 | 384.8 |
| A | 3 | 231 | 4691733 | 12188.67 | 1537 | 1499 | 384.8 |
| A | 4 | 249 | 4269377 | 11091.08 | 1537 | 1499 | 384.8 |
| B | 4 | 206 | 3131866 | 7580.71 | 1937 | 1870 | 412.9 |
| B | 10 | 254 | 1560028 | 3773.79 | 1937 | 1870 | 412.9 |
| B | 1 | 238 | 562362 | 1357.49 | 1937 | 1870 | 412.9 |
| C | 15 | 197 | 16465864 | 153444.74 | 316 | 309 | 107.3 |
| C | 4 | 111 | 9369892 | 87316.42 | 316 | 309 | 107.3 |
| C | 15 | 230 | 5346133 | 49818.46 | 316 | 309 | 107.3 |
| D | 7 | 61 | 23010601 | 126357.43 | 569 | 544 | 182.1 |
| D | 2 | 37 | 7132875 | 39166.48 | 569 | 544 | 182.1 |
| D | 12 | 6 | 1003145 | 5505.68 | 569 | 544 | 182.1 |
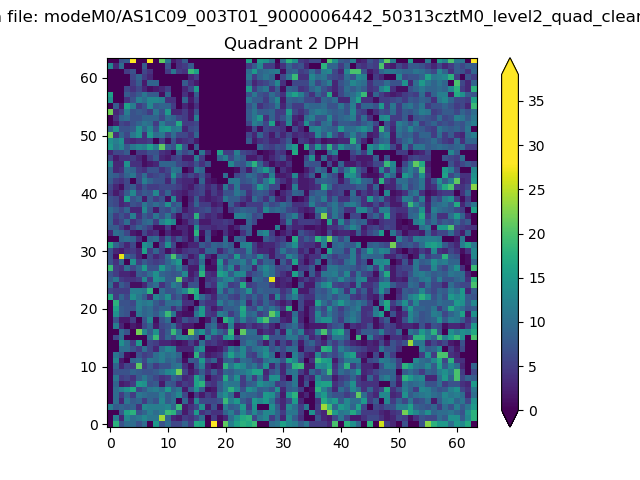
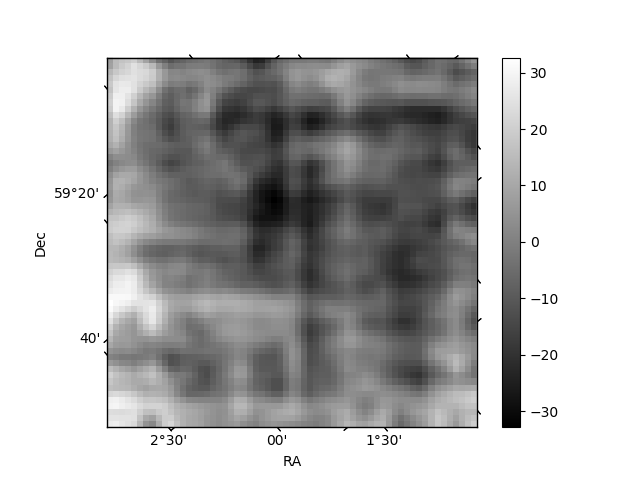
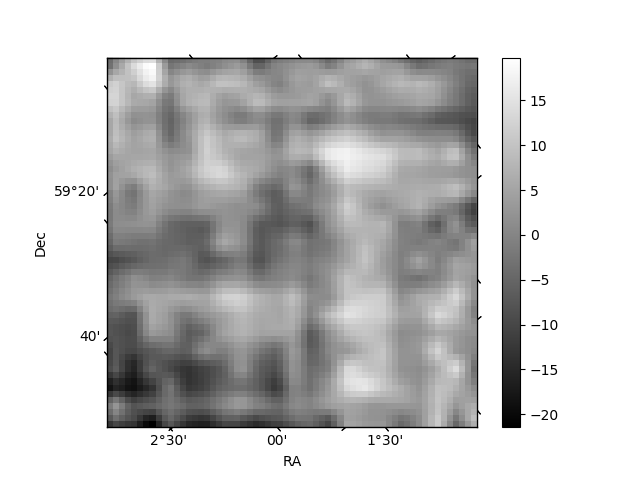
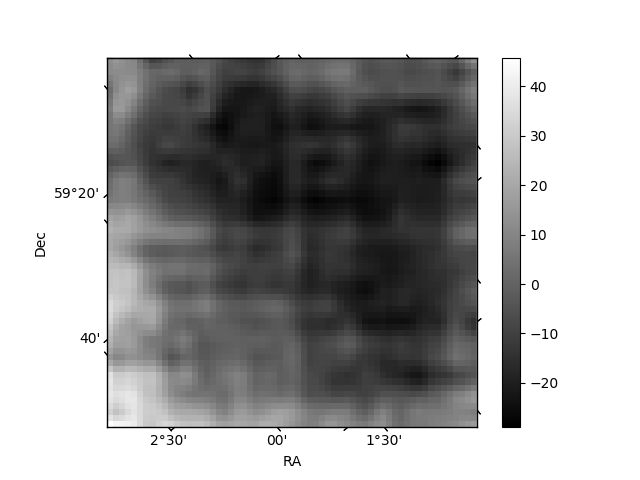
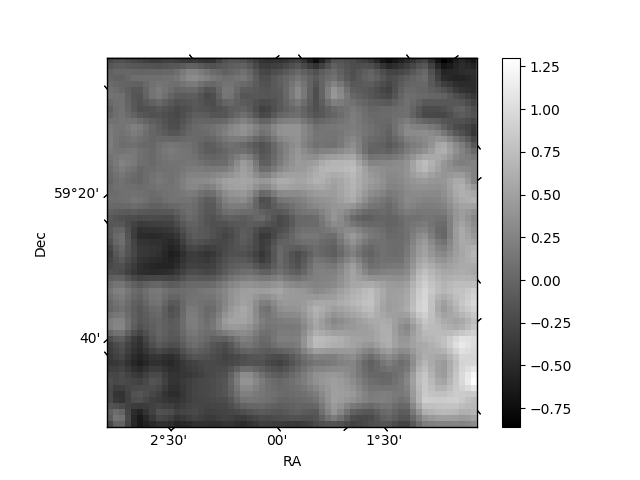
Histogram calculated using DETX and DETY for each event in the final _common_clean file
| Quadrant A | 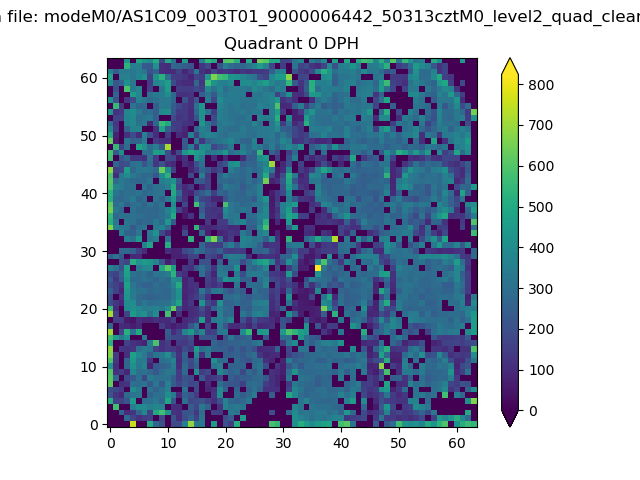 |
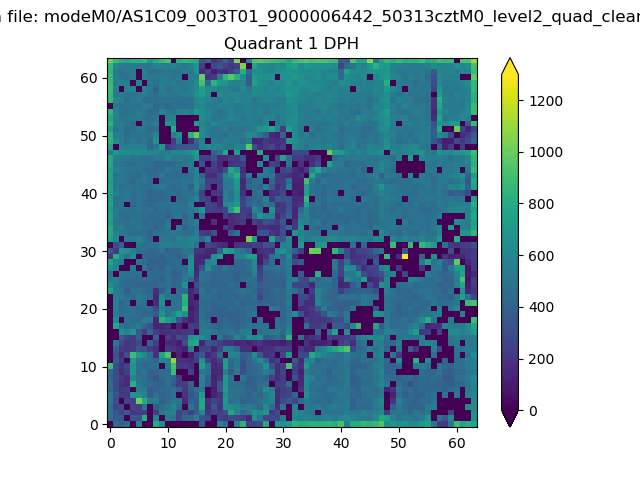 |
Quadrant B |
|---|---|---|---|
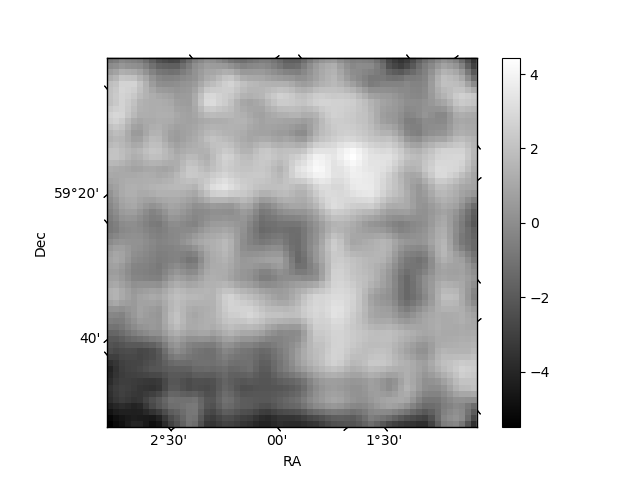
| Quadrant D | 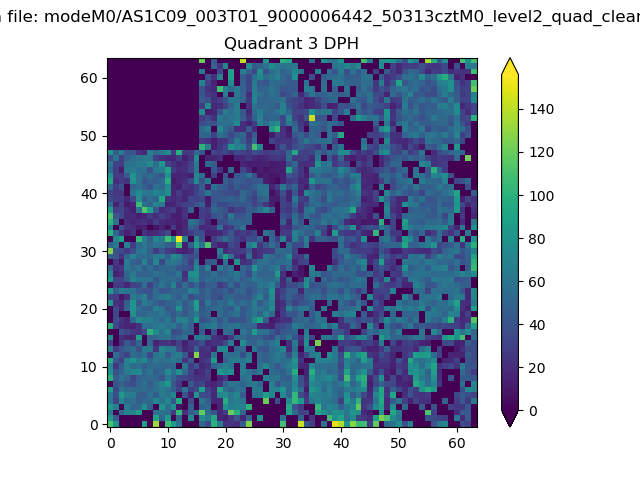 |
 |
Quadrant C |
| Plot type | Count rate plots | Images |
|---|---|---|
| Comparison with Poisson distribution Blue bars denote a histogram of data divided into 1 sec bins. Red curve is a Poisson curve with rate = median count rate of data. |
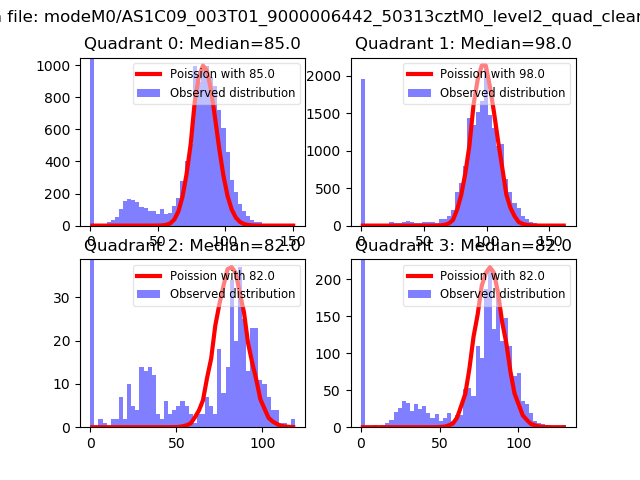 |
 |
| Quadrant-wise count rates Data is divided into 100 sec bins |
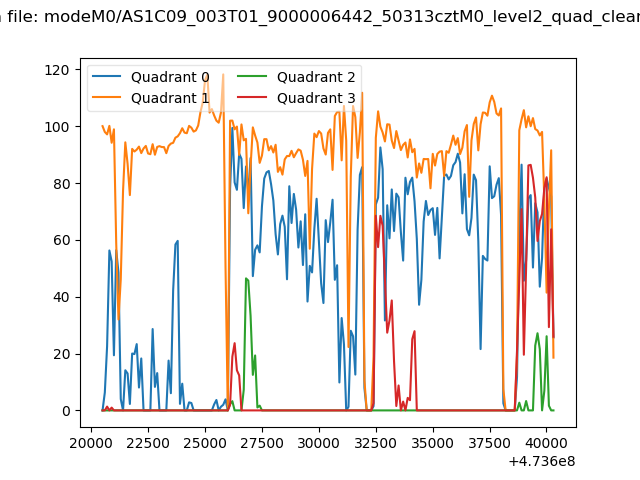 |
|
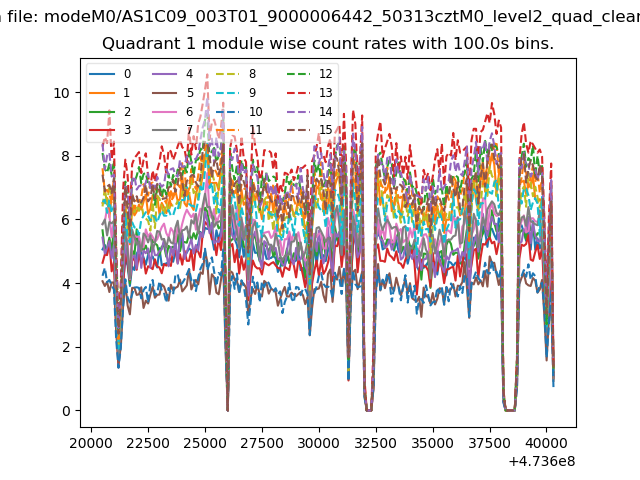
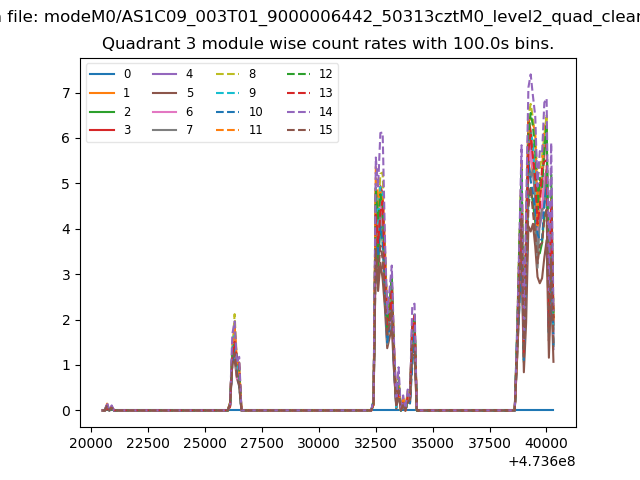
| Module-wise count rates for Quadrant A Data is divided into 100 sec bins |
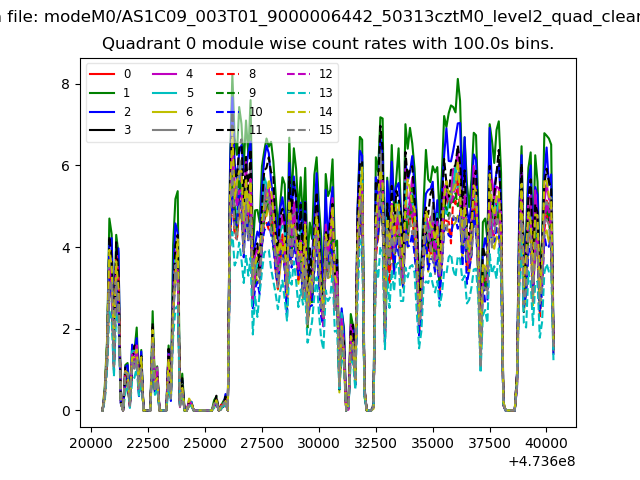 |
 |
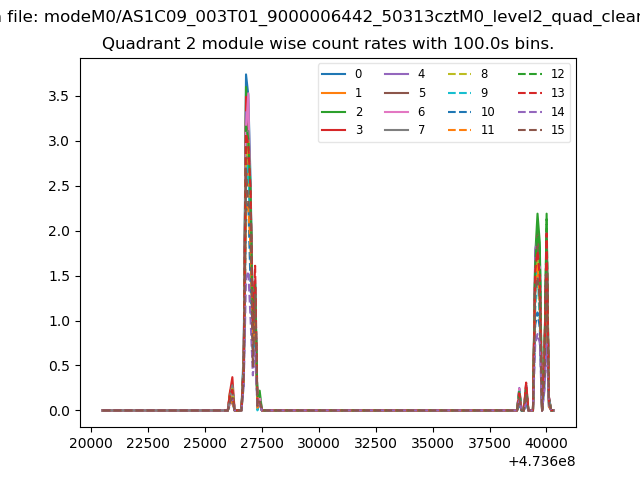
| Module-wise count rates for Quadrant B Data is divided into 100 sec bins |
 |
 |
| Module-wise count rates for Quadrant C Data is divided into 100 sec bins |
 |
 |
| Module-wise count rates for Quadrant D Data is divided into 100 sec bins |
 |
 |
| Parameter | Plot |
|---|---|
| CZT HV Monitor | 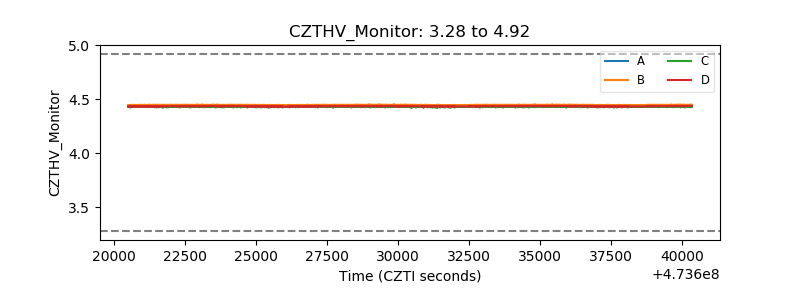 |
| D_VDD | 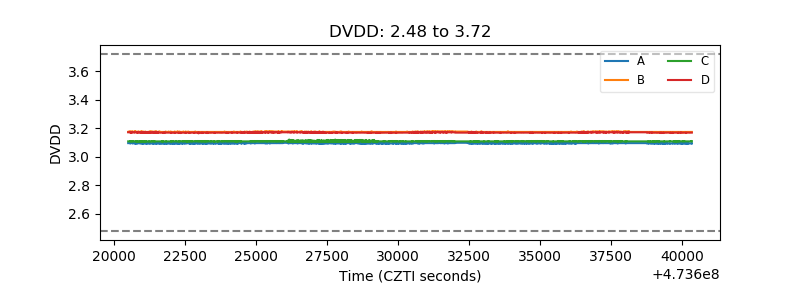 |
| Temperature 1 | 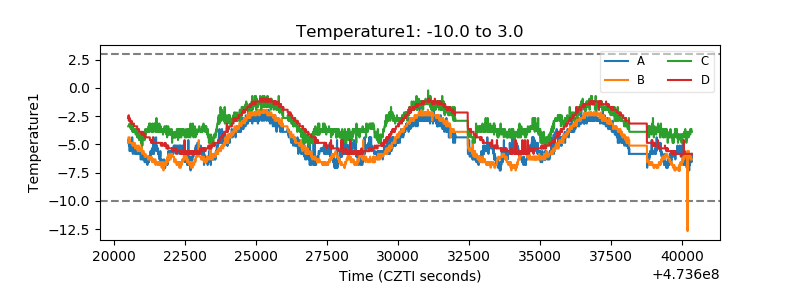 |
| Veto HV Monitor | 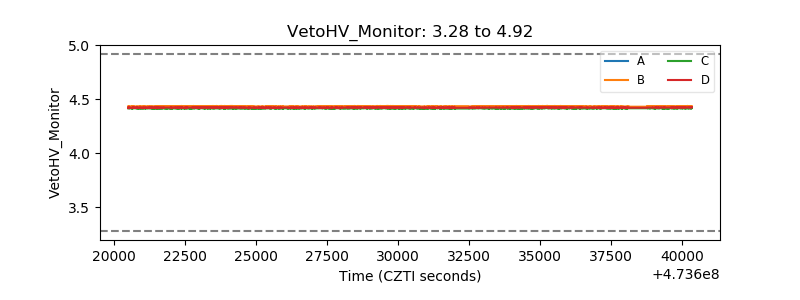 |
| Veto LLD | 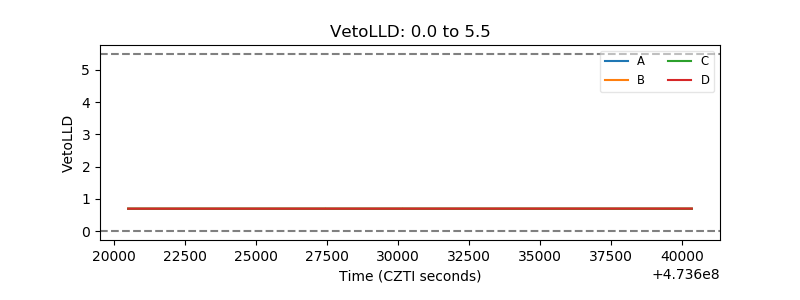 |
| Alpha Counter | 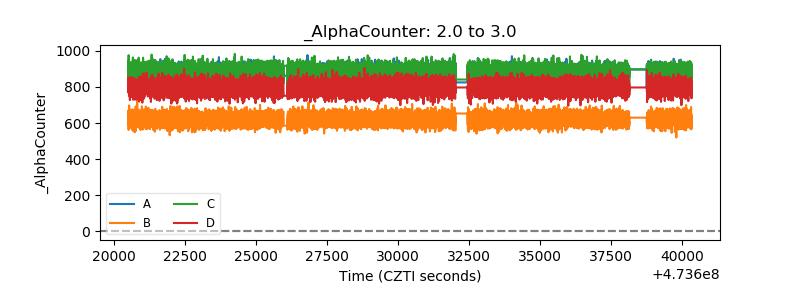 |
| _CPM_Rate | 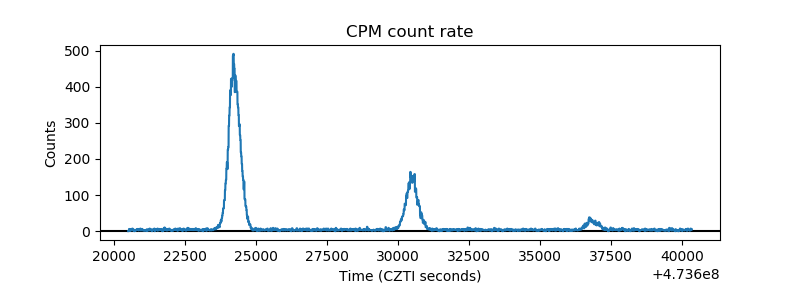 |
| CZT Counter | 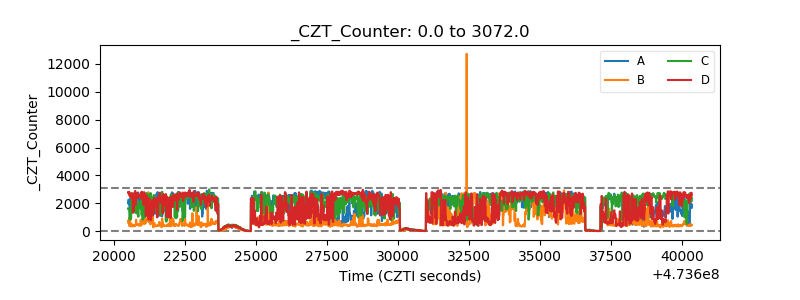 |
| +2.5 Volts monitor |  |
| +5 Volts monitor | 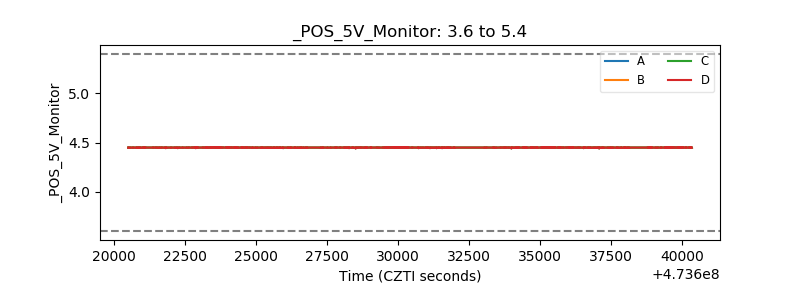 |
| _ROLL_ROT | 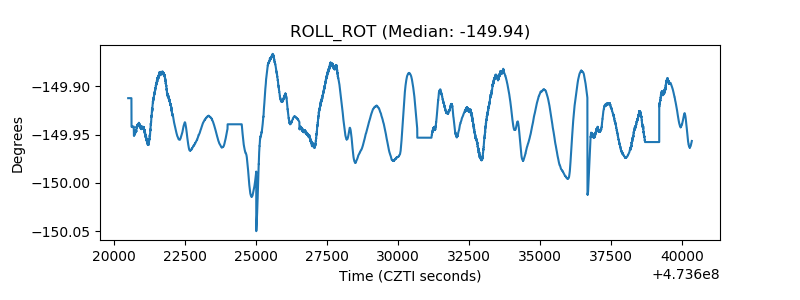 |
| _Roll_DEC | 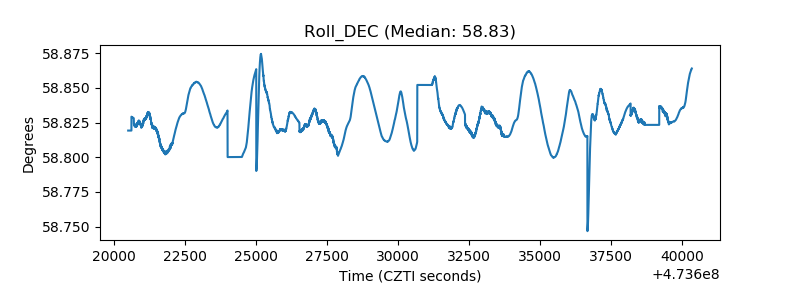 |
| _Roll_RA | 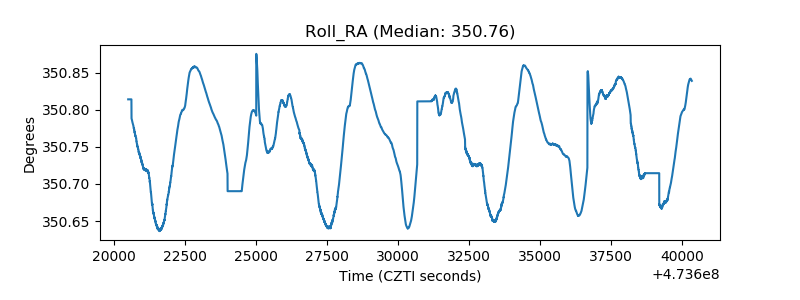 |
| Veto Counter | 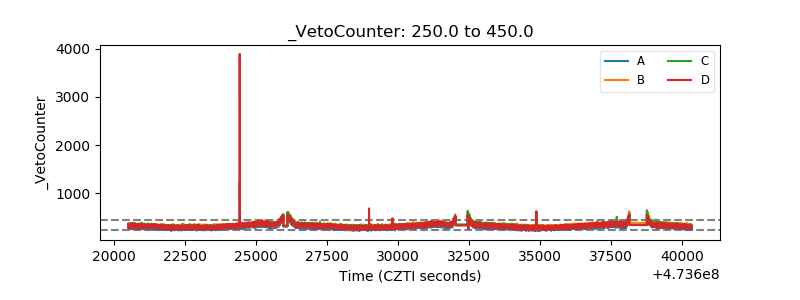 |