| Param | Original file | Final file |
|---|---|---|
| Filename | modeM0/AS1C09_003T01_9000006442_50317cztM0_level2.fits | modeM0/AS1C09_003T01_9000006442_50317cztM0_level2_quad_clean.evt |
| Size (bytes) | 1,151,677,440 | 64,359,360 |
| Size | 1.1 GB | 61.4 MB |
| Events in quadrant A | 10,055,423 | 463,136 |
| Events in quadrant B | 5,301,786 | 631,839 |
| Events in quadrant C | 14,542,299 | 105,902 |
| Events in quadrant D | 12,232,646 | 295,441 |
| Mode M9 | |||
|---|---|---|---|
| Quadrant | BADHDUFLAG | Total packets | Discarded packets |
| A | 0 | 11 | 0 |
| B | 0 | 11 | 0 |
| C | 0 | 11 | 0 |
| D | 0 | 11 | 0 |
| Mode M0 | |||
|---|---|---|---|
| Quadrant | BADHDUFLAG | Total packets | Discarded packets |
| A | 0 | 34359 | 1 |
| B | 0 | 20227 | 1 |
| C | 0 | 47599 | 7 |
| D | 0 | 40836 | 1 |
| Mode SS | |||
|---|---|---|---|
| Quadrant | BADHDUFLAG | Total packets | Discarded packets |
| A | 0 | 130 | 0 |
| B | 0 | 130 | 0 |
| C | 0 | 130 | 0 |
| D | 0 | 130 | 0 |
| Quadrant | Total seconds | Saturated seconds | Saturation percentage |
|---|---|---|---|
| A | 6485 | 2057 | 31.719352% |
| B | 6485 | 640 | 9.868928% |
| C | 6485 | 5525 | 85.196608% |
| D | 6485 | 3399 | 52.413261% |
Noise dominated data is calculated using 1-second bins in cleaned event files. If a bin has >2000 counts, and if more than 50% of those come from <1% of pixels, then it is considered to be noise-dominated and hence unusable.
| Quadrant | # 1 sec bins | Bins with >0 counts | Bins with >2000 counts | High rate bins dominated by noise | Noise dominated (total time) | Noise dominated (detector-on time) | Marked lightcurve |
|---|---|---|---|---|---|---|---|
| A | 7555 | 6486 | 1710 | 1710 | 22.63% | 26.36% | 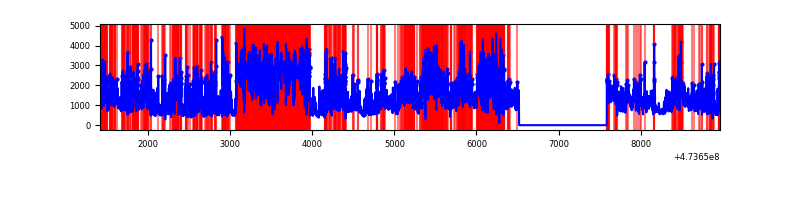 |
| B | 7555 | 6486 | 376 | 376 | 4.98% | 5.80% | 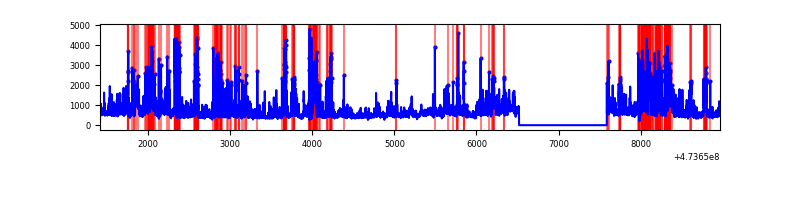 |
| C | 7554 | 6484 | 4639 | 4639 | 61.41% | 71.55% | 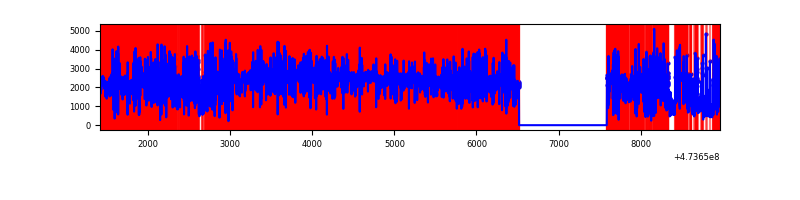 |
| D | 7555 | 6485 | 3079 | 3079 | 40.75% | 47.48% | 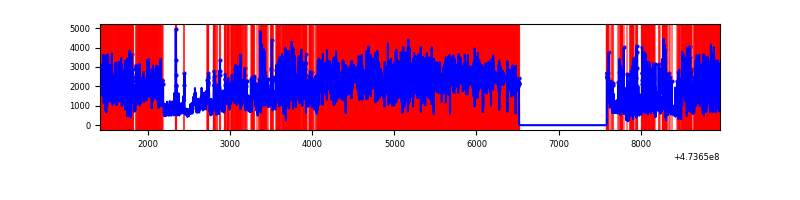 |
Top three noisy pixels from each quadrant. If the there are fewer than three noisy pixels in the level2.evt file, extra rows are filled as -1
| Pixel properties | Quadrant properties | ||||||
|---|---|---|---|---|---|---|---|
| Quadrant | DetID | PixID | Counts | Sigma | Mean | Median | Sigma |
| A | 3 | 231 | 4928756 | 32589.91 | 612 | 596 | 151.2 |
| A | 3 | 14 | 617776 | 4081.41 | 612 | 596 | 151.2 |
| A | 0 | 98 | 449985 | 2971.8 | 612 | 596 | 151.2 |
| B | 4 | 206 | 1106925 | 7637.32 | 678 | 657 | 144.9 |
| B | 1 | 238 | 757867 | 5227.53 | 678 | 657 | 144.9 |
| B | 12 | 0 | 394064 | 2715.95 | 678 | 657 | 144.9 |
| C | 4 | 111 | 8525230 | 99710.01 | 287 | 283 | 85.5 |
| C | 15 | 197 | 1502803 | 17573.86 | 287 | 283 | 85.5 |
| C | 15 | 232 | 909534 | 10634.83 | 287 | 283 | 85.5 |
| D | 7 | 61 | 3840699 | 25353.58 | 520 | 501 | 151.5 |
| D | 2 | 37 | 1555920 | 10269.12 | 520 | 501 | 151.5 |
| D | 7 | 96 | 1193513 | 7876.45 | 520 | 501 | 151.5 |
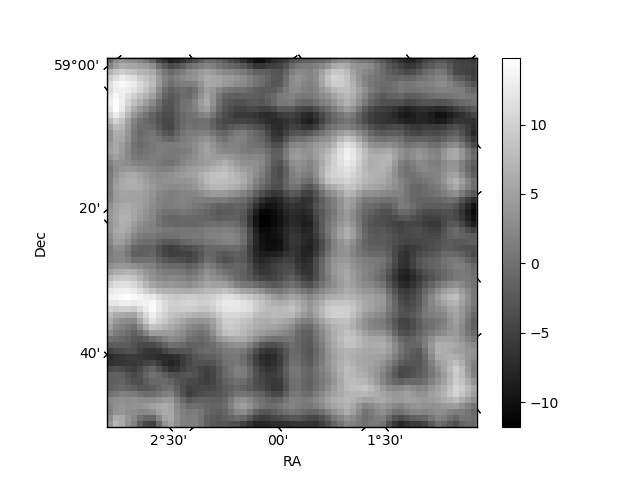
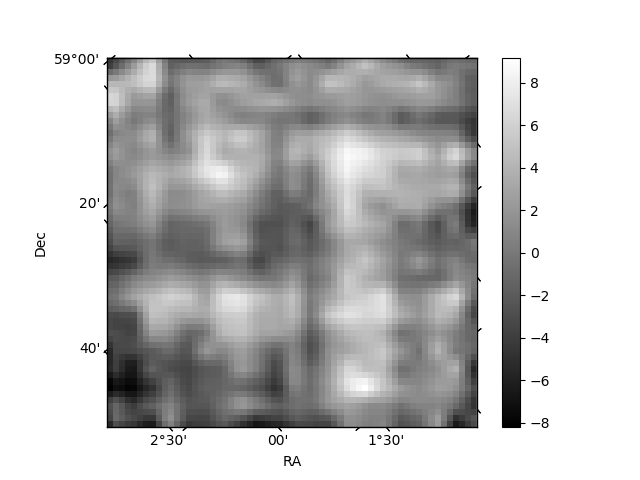
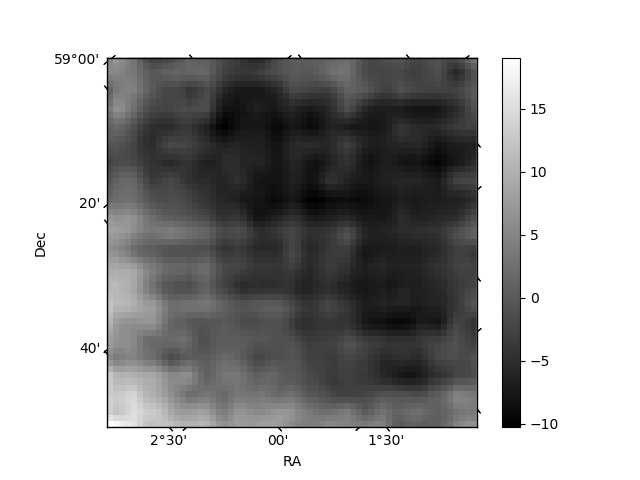
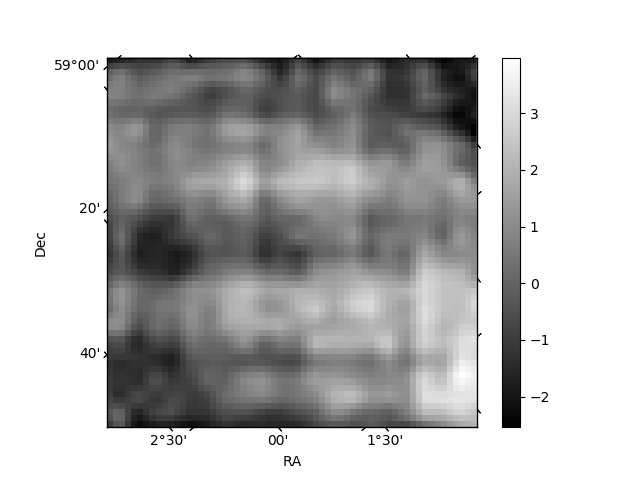
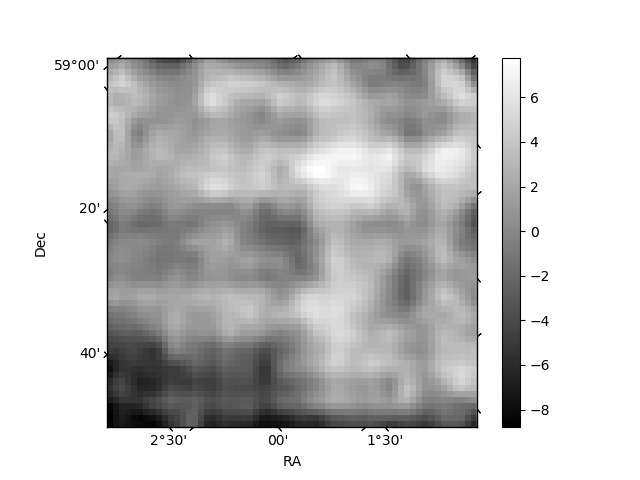
Histogram calculated using DETX and DETY for each event in the final _common_clean file
| Quadrant A | 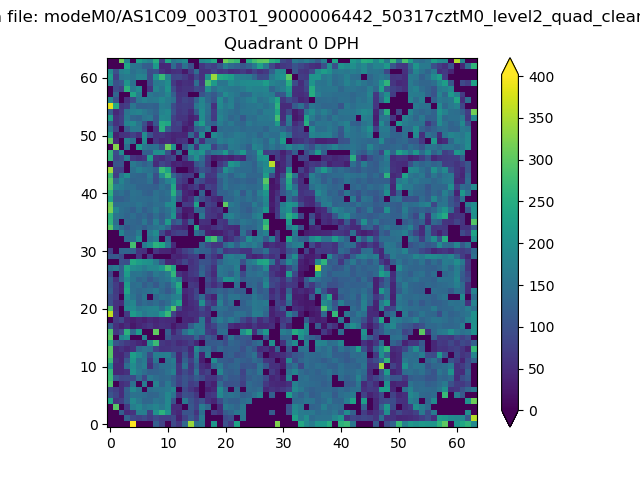 |
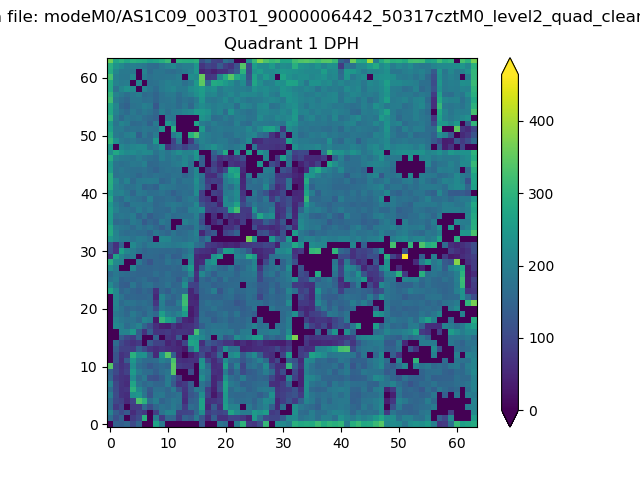 |
Quadrant B |
|---|---|---|---|
| Quadrant D | 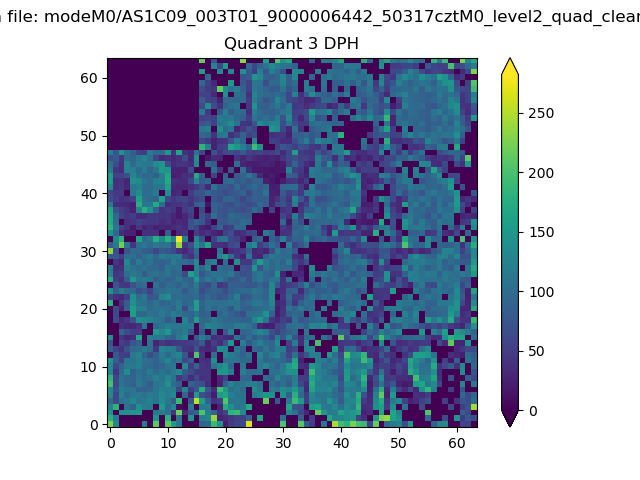 |
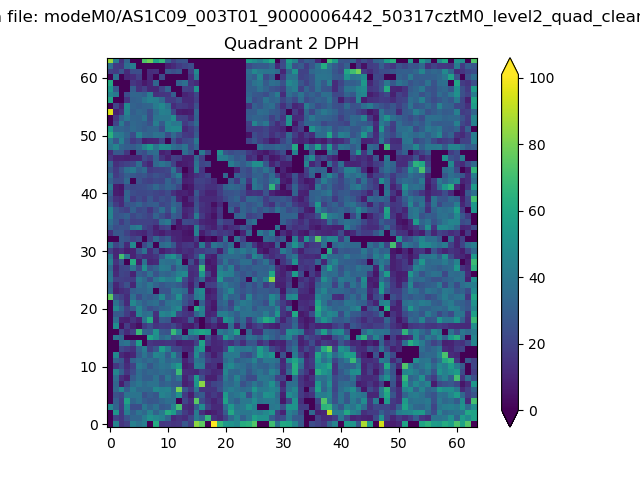 |
Quadrant C |
| Plot type | Count rate plots | Images |
|---|---|---|
| Comparison with Poisson distribution Blue bars denote a histogram of data divided into 1 sec bins. Red curve is a Poisson curve with rate = median count rate of data. |
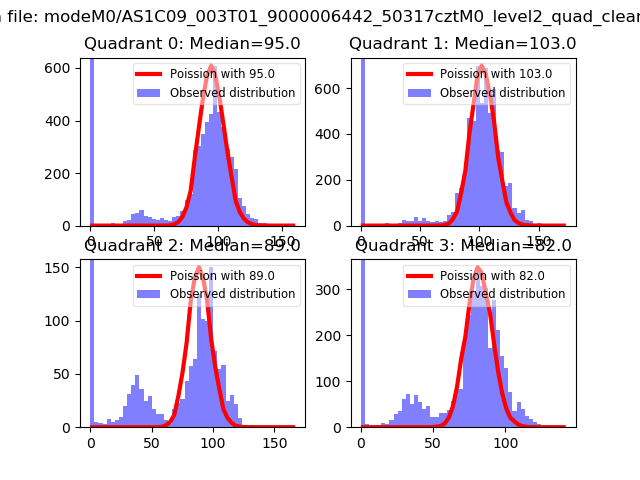 |
 |
| Quadrant-wise count rates Data is divided into 100 sec bins |
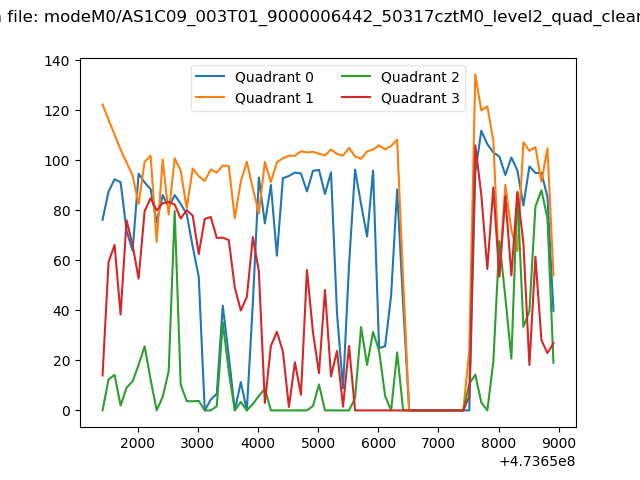 |
|
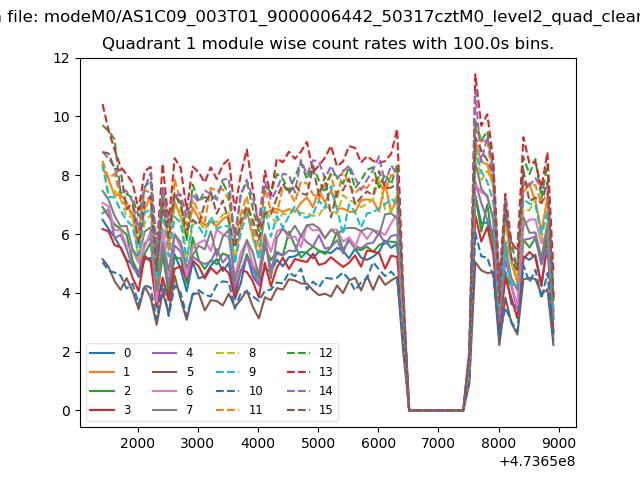
| Module-wise count rates for Quadrant A Data is divided into 100 sec bins |
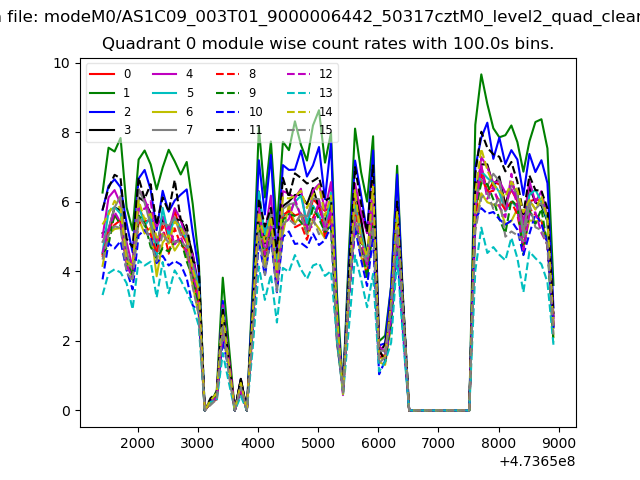 |
 |
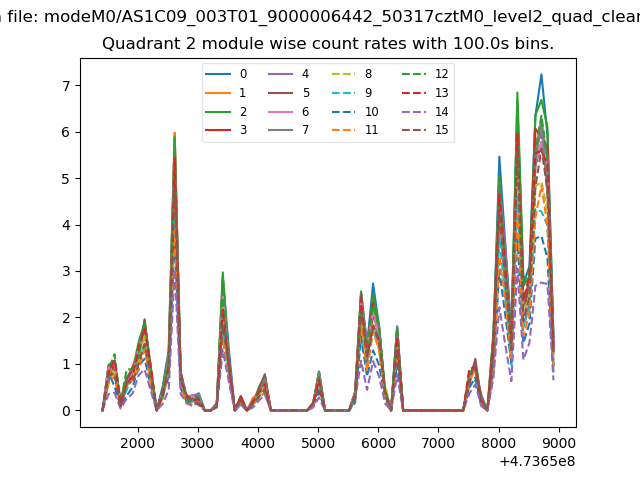
| Module-wise count rates for Quadrant B Data is divided into 100 sec bins |
 |
 |
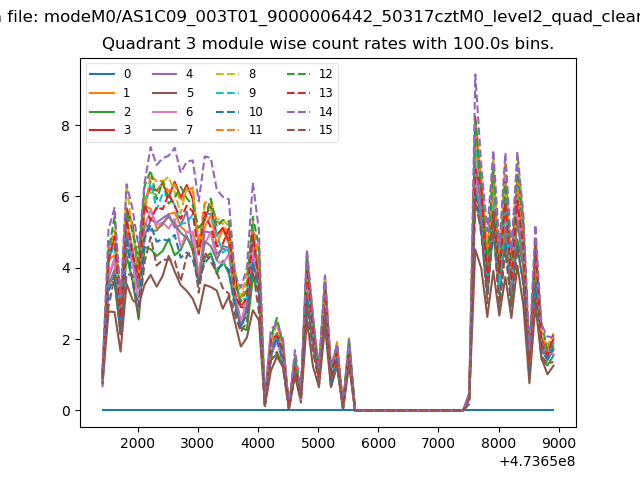
| Module-wise count rates for Quadrant C Data is divided into 100 sec bins |
 |
 |
| Module-wise count rates for Quadrant D Data is divided into 100 sec bins |
 |
 |
| Parameter | Plot |
|---|---|
| CZT HV Monitor | 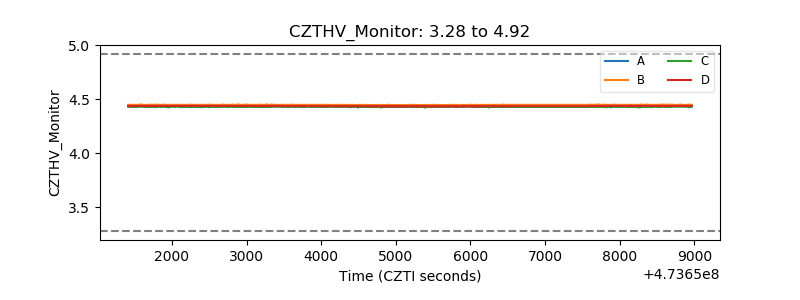 |
| D_VDD | 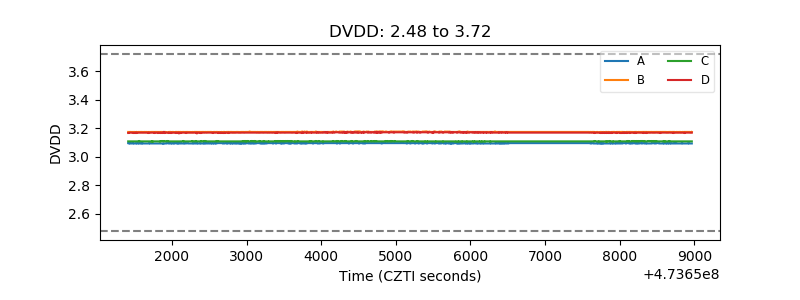 |
| Temperature 1 | 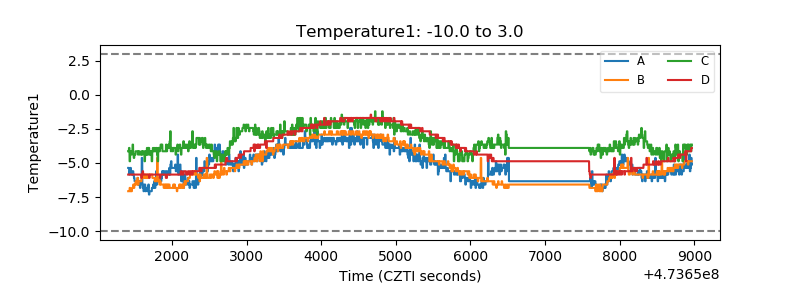 |
| Veto HV Monitor | 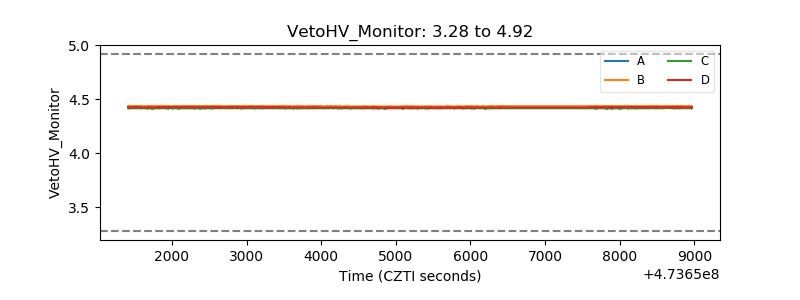 |
| Veto LLD | 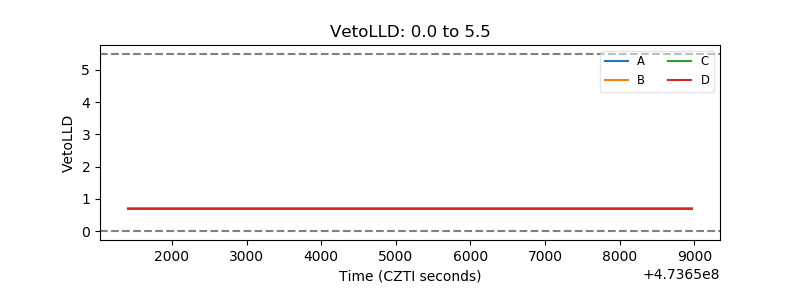 |
| Alpha Counter | 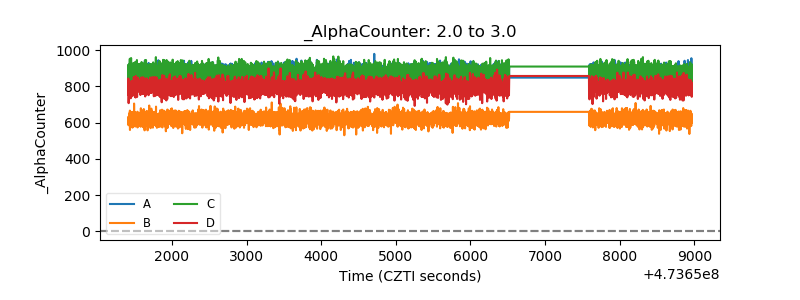 |
| _CPM_Rate | 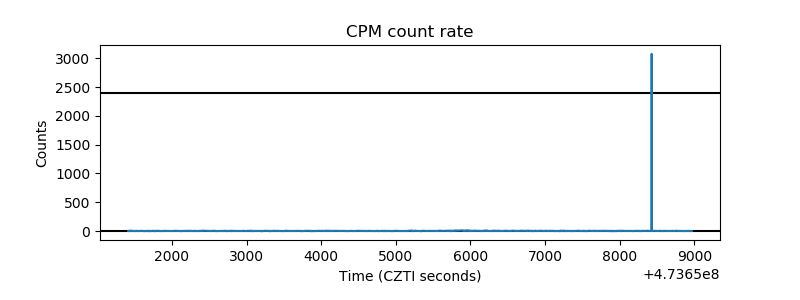 |
| CZT Counter | 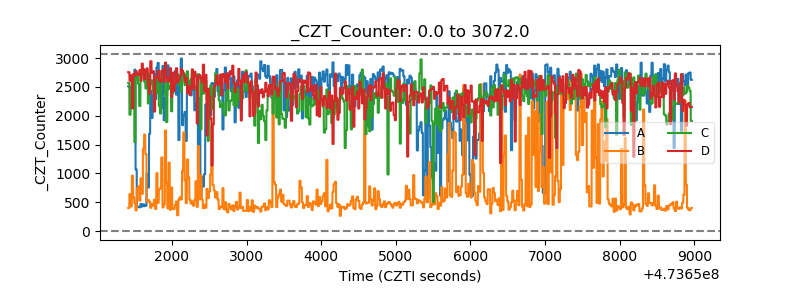 |
| +2.5 Volts monitor | 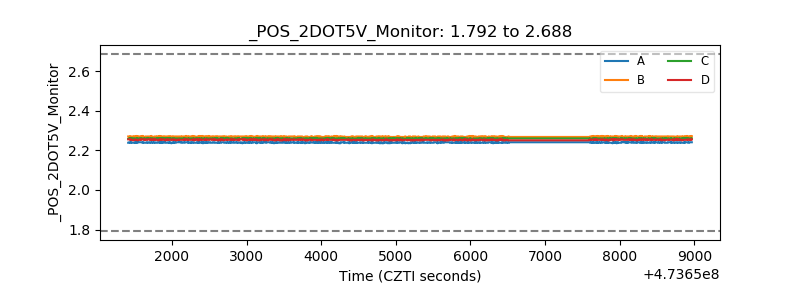 |
| +5 Volts monitor | 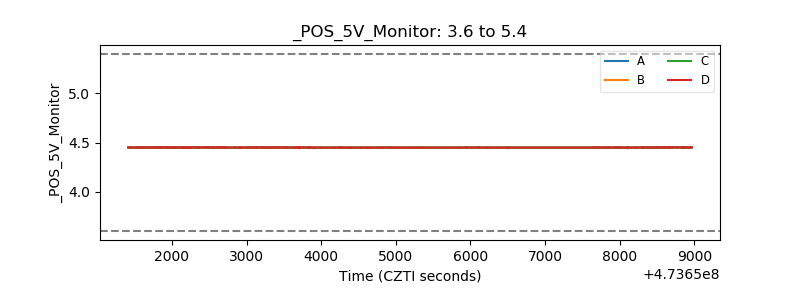 |
| _ROLL_ROT | 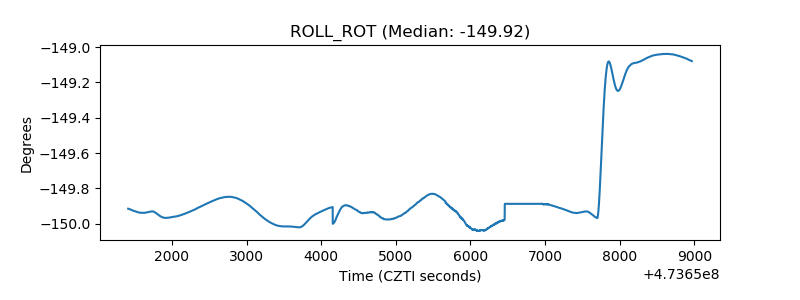 |
| _Roll_DEC | 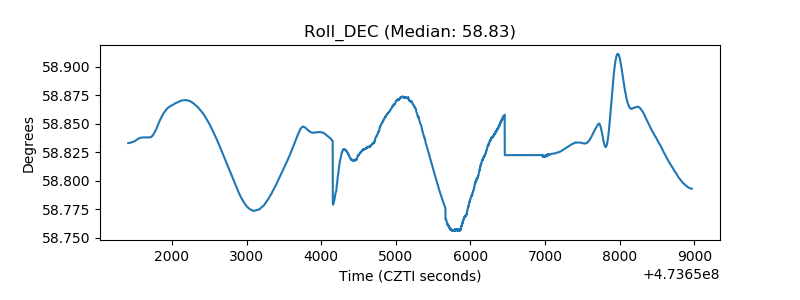 |
| _Roll_RA | 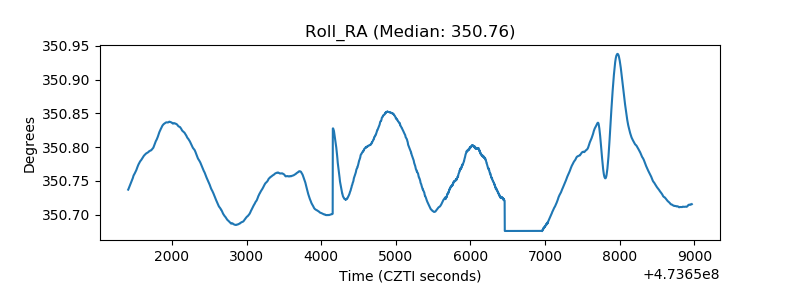 |
| Veto Counter | 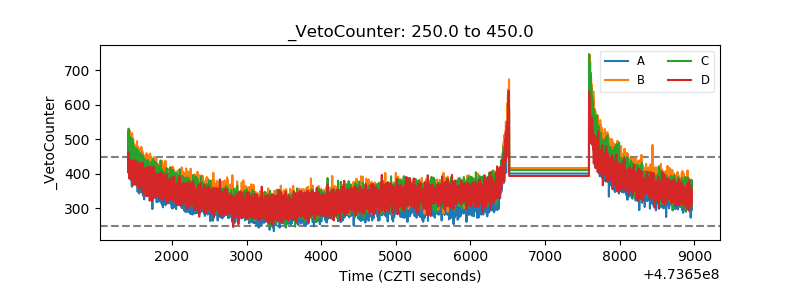 |