| Param | Original file | Final file |
|---|---|---|
| Filename | modeM0/AS1C09_003T01_9000006442_50318cztM0_level2.fits | modeM0/AS1C09_003T01_9000006442_50318cztM0_level2_quad_clean.evt |
| Size (bytes) | 959,443,200 | 62,349,120 |
| Size | 915.0 MB | 59.5 MB |
| Events in quadrant A | 9,155,868 | 426,910 |
| Events in quadrant B | 3,754,205 | 600,851 |
| Events in quadrant C | 10,390,360 | 261,991 |
| Events in quadrant D | 11,768,722 | 193,130 |
| Mode M9 | |||
|---|---|---|---|
| Quadrant | BADHDUFLAG | Total packets | Discarded packets |
| A | 0 | 11 | 0 |
| B | 0 | 11 | 0 |
| C | 0 | 11 | 0 |
| D | 0 | 11 | 0 |
| Mode M0 | |||
|---|---|---|---|
| Quadrant | BADHDUFLAG | Total packets | Discarded packets |
| A | 0 | 31251 | 1 |
| B | 0 | 15064 | 1 |
| C | 0 | 34834 | 1 |
| D | 0 | 38950 | 1 |
| Mode SS | |||
|---|---|---|---|
| Quadrant | BADHDUFLAG | Total packets | Discarded packets |
| A | 0 | 118 | 0 |
| B | 0 | 118 | 0 |
| C | 0 | 118 | 0 |
| D | 0 | 118 | 0 |
| Quadrant | Total seconds | Saturated seconds | Saturation percentage |
|---|---|---|---|
| A | 5788 | 1836 | 31.720802% |
| B | 5788 | 267 | 4.612992% |
| C | 5788 | 3222 | 55.666897% |
| D | 5789 | 3893 | 67.248229% |
Noise dominated data is calculated using 1-second bins in cleaned event files. If a bin has >2000 counts, and if more than 50% of those come from <1% of pixels, then it is considered to be noise-dominated and hence unusable.
| Quadrant | # 1 sec bins | Bins with >0 counts | Bins with >2000 counts | High rate bins dominated by noise | Noise dominated (total time) | Noise dominated (detector-on time) | Marked lightcurve |
|---|---|---|---|---|---|---|---|
| A | 6903 | 5789 | 1594 | 1594 | 23.09% | 27.53% | 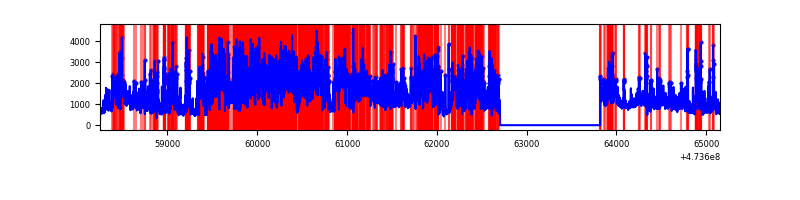 |
| B | 6903 | 5789 | 90 | 90 | 1.30% | 1.55% | 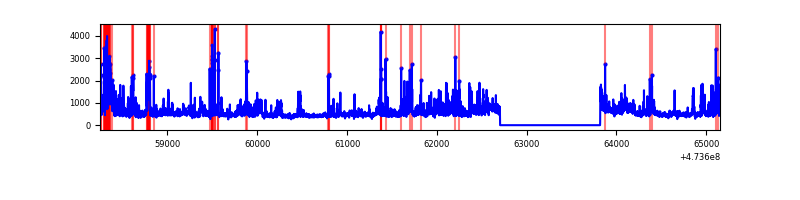 |
| C | 6903 | 5788 | 2689 | 2689 | 38.95% | 46.46% | 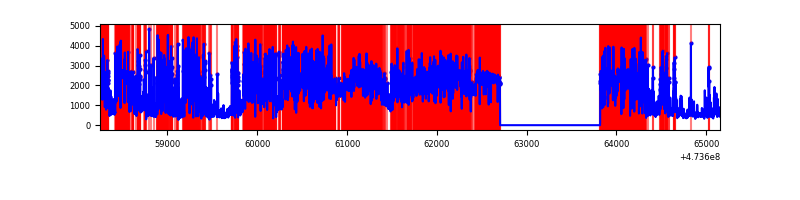 |
| D | 6904 | 5789 | 3362 | 3362 | 48.70% | 58.08% | 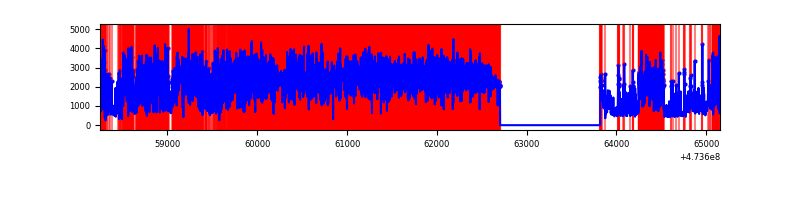 |
Top three noisy pixels from each quadrant. If the there are fewer than three noisy pixels in the level2.evt file, extra rows are filled as -1
| Pixel properties | Quadrant properties | ||||||
|---|---|---|---|---|---|---|---|
| Quadrant | DetID | PixID | Counts | Sigma | Mean | Median | Sigma |
| A | 3 | 231 | 4561723 | 32322.13 | 565 | 551 | 141.1 |
| A | 6 | 250 | 612477 | 4336.33 | 565 | 551 | 141.1 |
| A | 0 | 98 | 558203 | 3951.73 | 565 | 551 | 141.1 |
| B | 4 | 206 | 820408 | 6156.77 | 618 | 598 | 133.2 |
| B | 5 | 185 | 79708 | 594.12 | 618 | 598 | 133.2 |
| B | 12 | 0 | 75091 | 559.44 | 618 | 598 | 133.2 |
| C | 4 | 111 | 5179868 | 45788.66 | 396 | 393 | 113.1 |
| C | 15 | 197 | 2398578 | 21200.93 | 396 | 393 | 113.1 |
| C | 1 | 29 | 202307 | 1785.0 | 396 | 393 | 113.1 |
| D | 7 | 96 | 3172715 | 27370.0 | 411 | 396 | 115.9 |
| D | 7 | 61 | 2250837 | 19416.26 | 411 | 396 | 115.9 |
| D | 12 | 6 | 1541375 | 13295.19 | 411 | 396 | 115.9 |
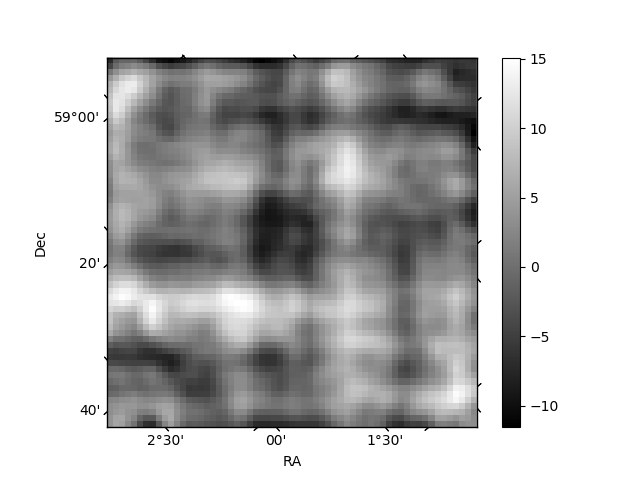
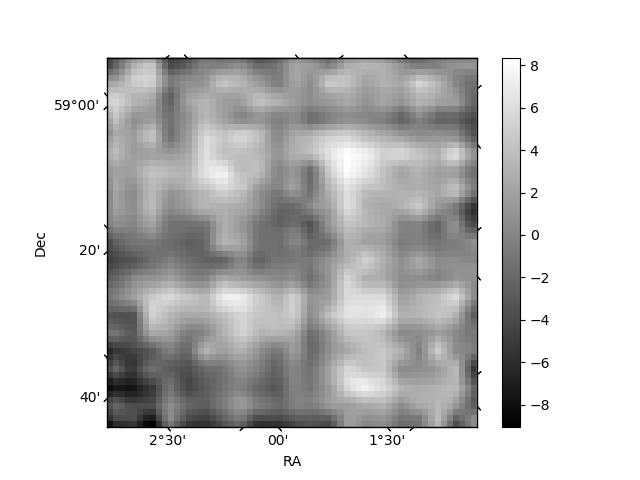
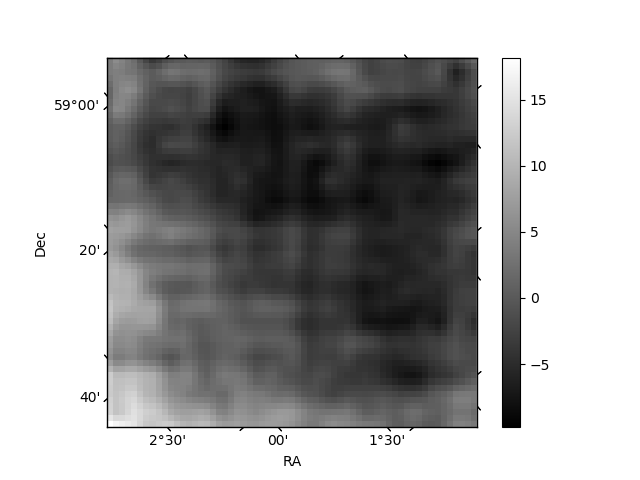
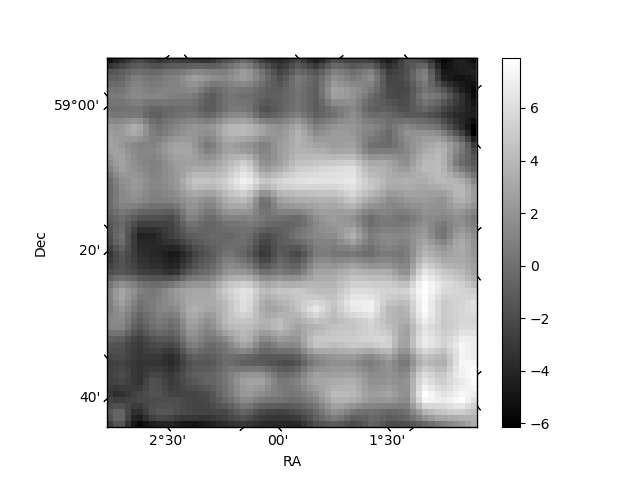
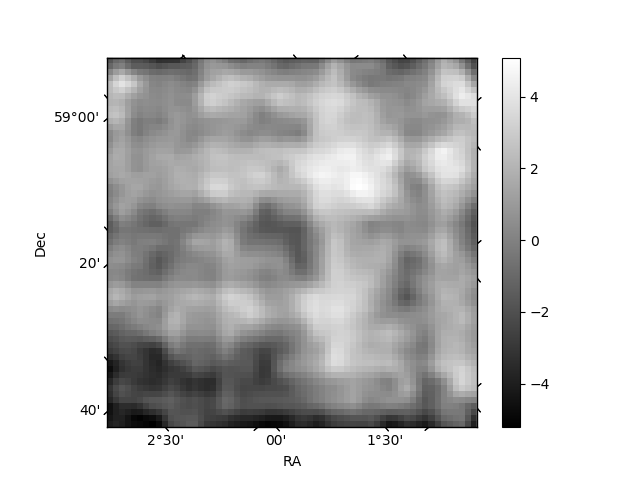
Histogram calculated using DETX and DETY for each event in the final _common_clean file
| Quadrant A | 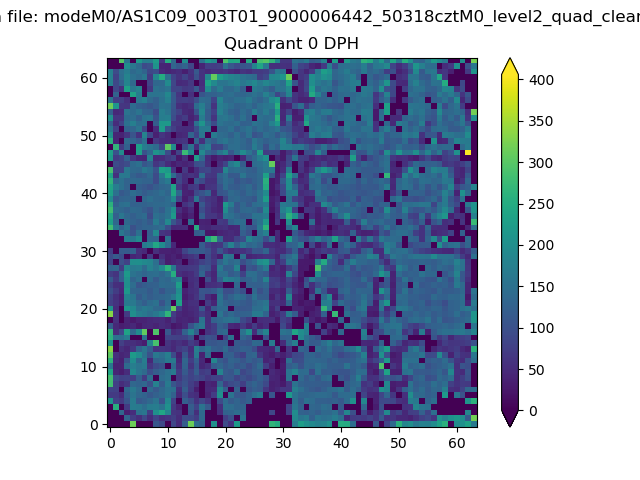 |
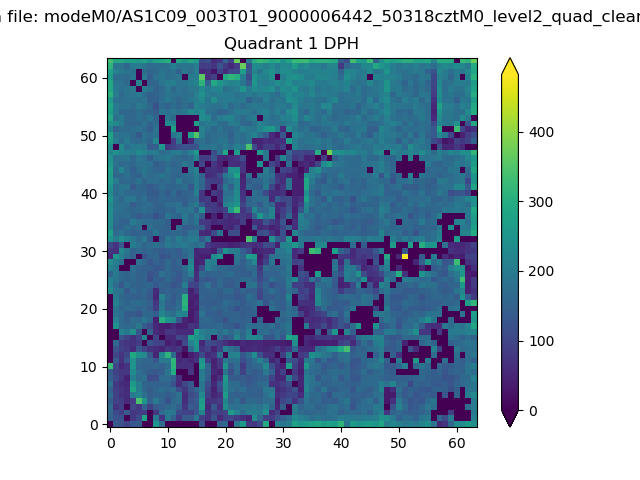 |
Quadrant B |
|---|---|---|---|
| Quadrant D | 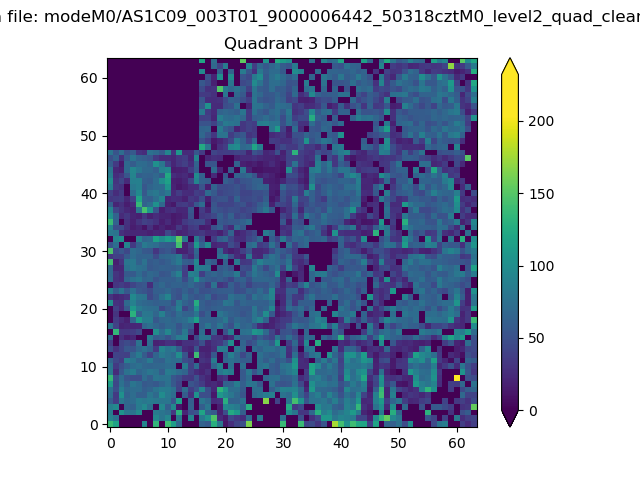 |
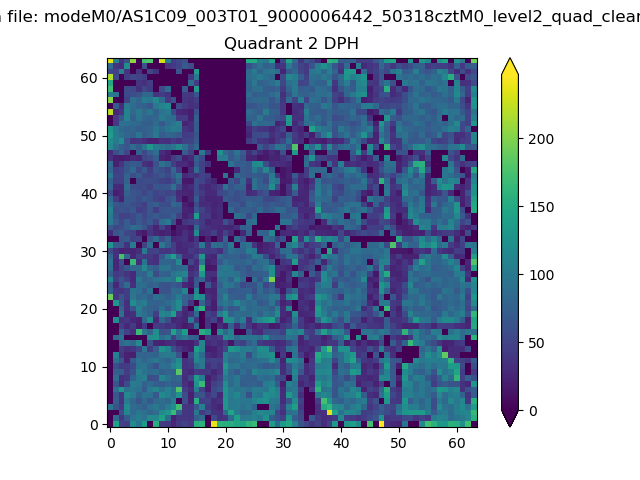 |
Quadrant C |
| Plot type | Count rate plots | Images |
|---|---|---|
| Comparison with Poisson distribution Blue bars denote a histogram of data divided into 1 sec bins. Red curve is a Poisson curve with rate = median count rate of data. |
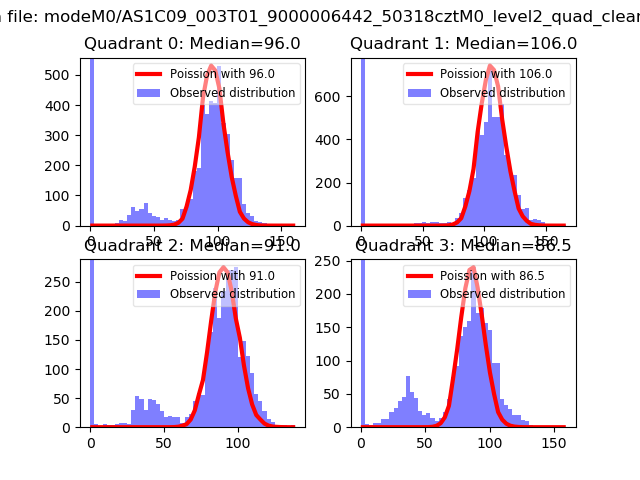 |
 |
| Quadrant-wise count rates Data is divided into 100 sec bins |
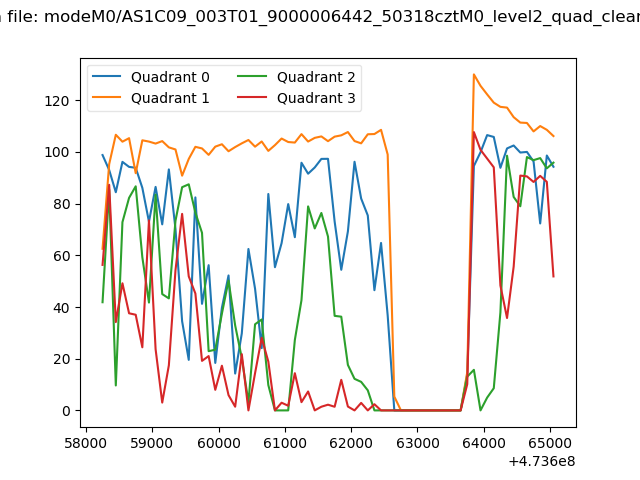 |
|
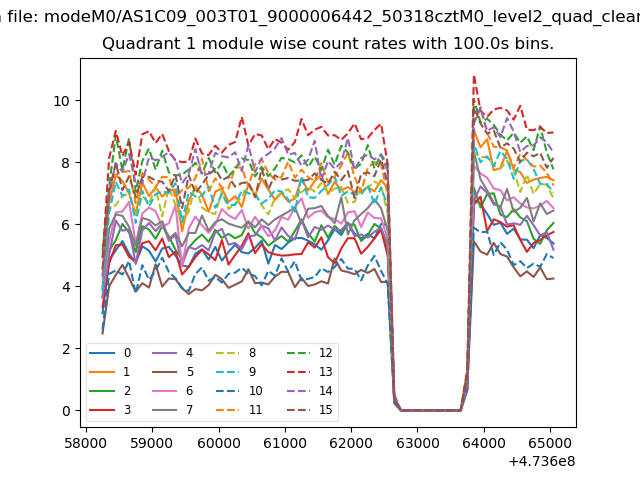
| Module-wise count rates for Quadrant A Data is divided into 100 sec bins |
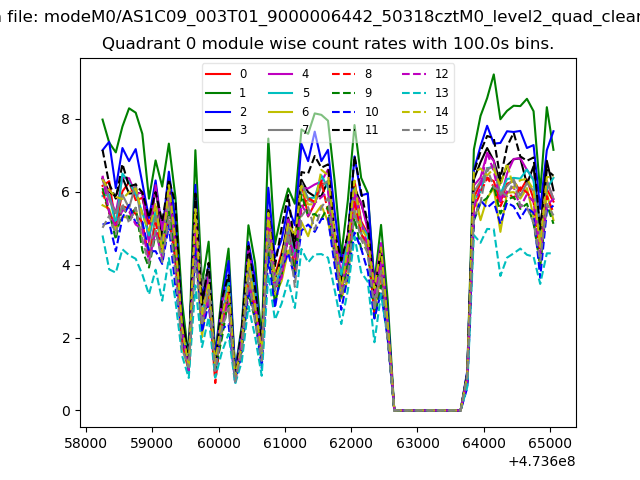 |
 |
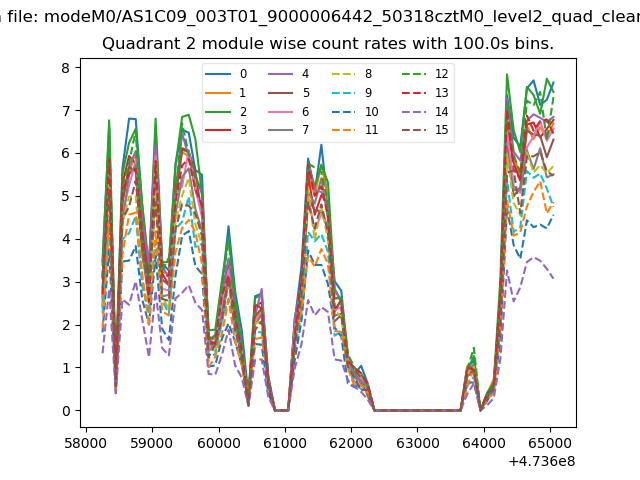
| Module-wise count rates for Quadrant B Data is divided into 100 sec bins |
 |
 |
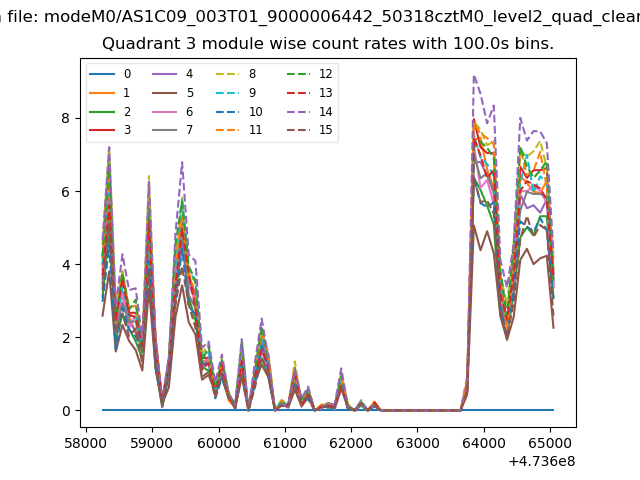
| Module-wise count rates for Quadrant C Data is divided into 100 sec bins |
 |
 |
| Module-wise count rates for Quadrant D Data is divided into 100 sec bins |
 |
 |
| Parameter | Plot |
|---|---|
| CZT HV Monitor | 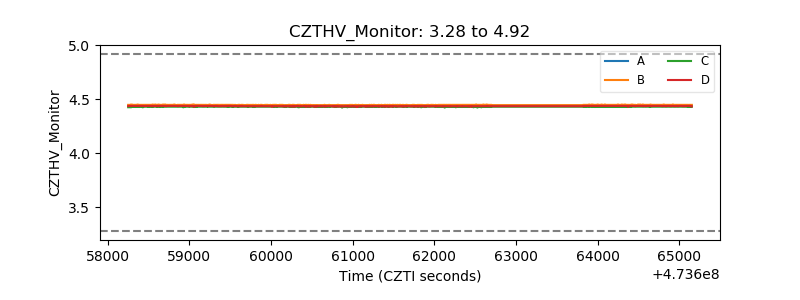 |
| D_VDD |  |
| Temperature 1 | 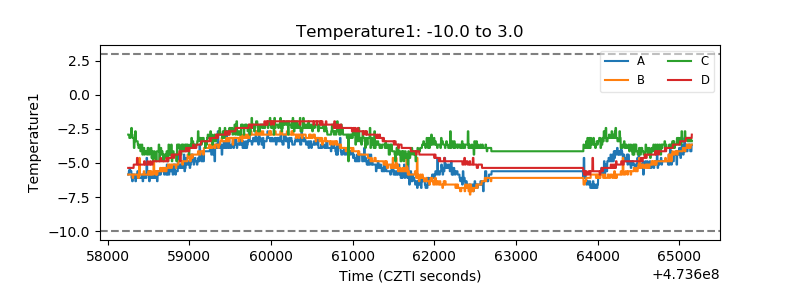 |
| Veto HV Monitor | 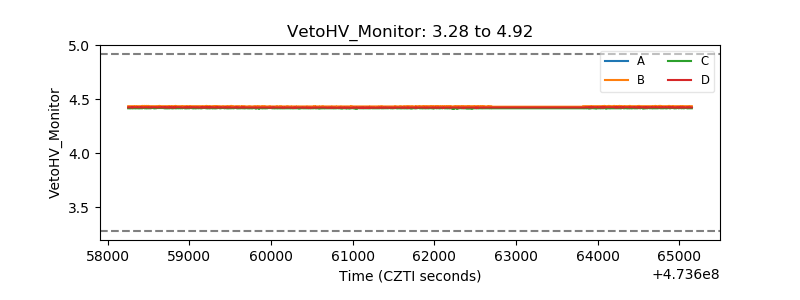 |
| Veto LLD | 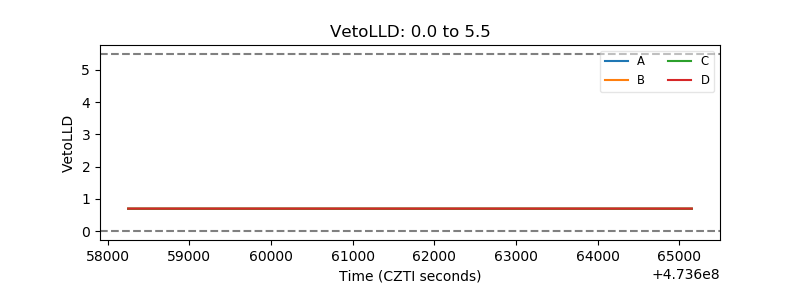 |
| Alpha Counter | 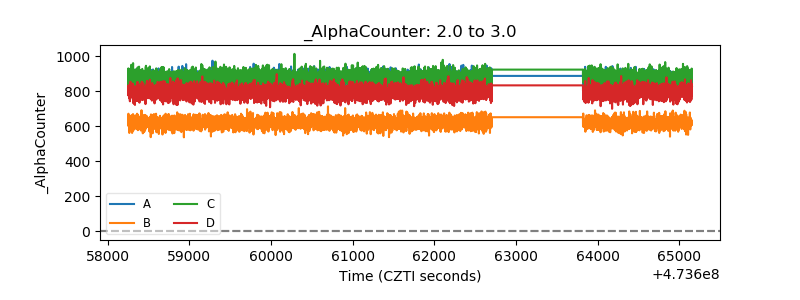 |
| _CPM_Rate | 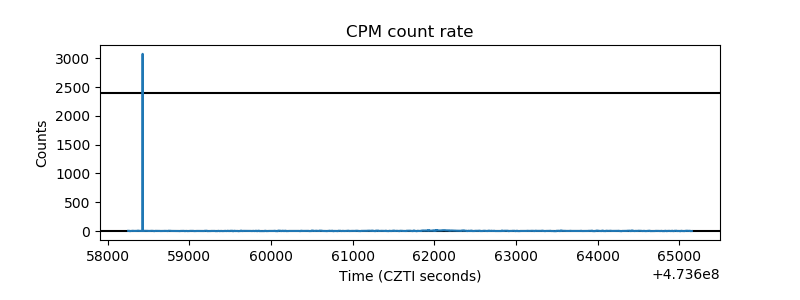 |
| CZT Counter | 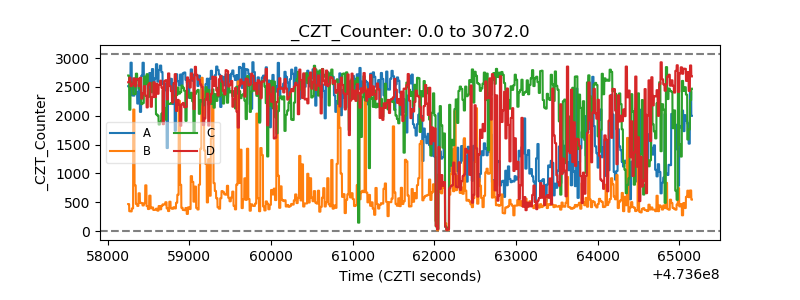 |
| +2.5 Volts monitor |  |
| +5 Volts monitor |  |
| _ROLL_ROT | 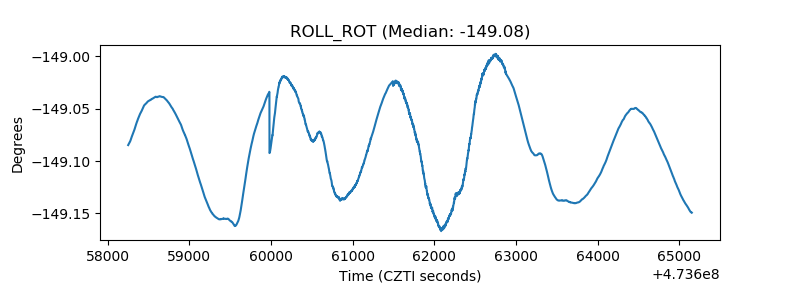 |
| _Roll_DEC | 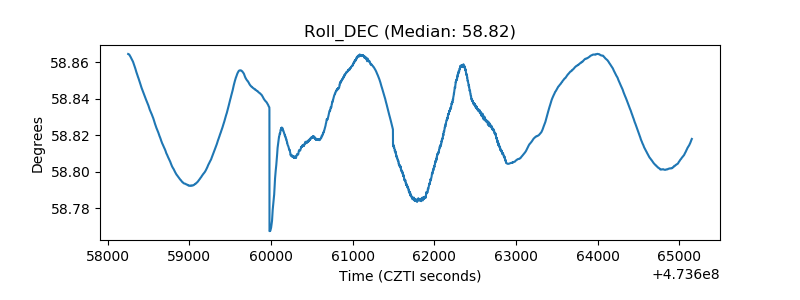 |
| _Roll_RA | 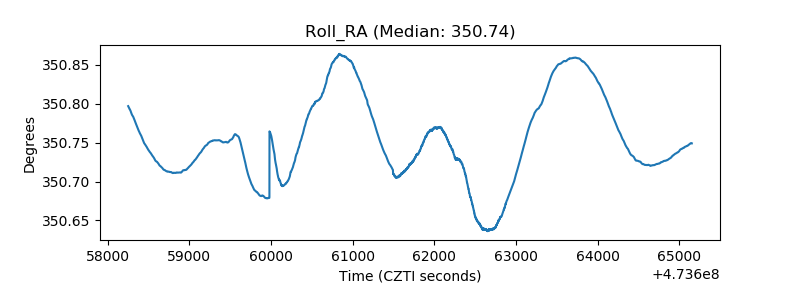 |
| Veto Counter | 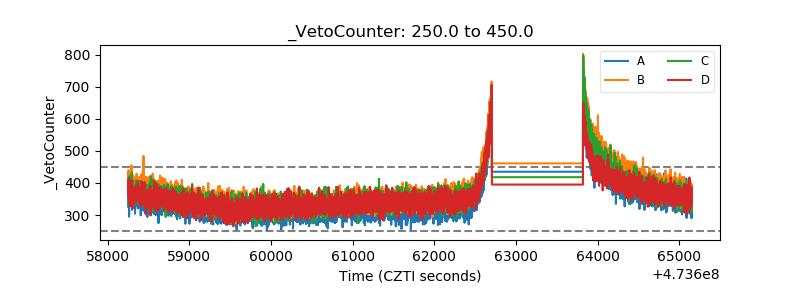 |