| Param | Original file | Final file |
|---|---|---|
| Filename | modeM0/AS1C09_003T01_9000006442_50333cztM0_level2.fits | modeM0/AS1C09_003T01_9000006442_50333cztM0_level2_quad_clean.evt |
| Size (bytes) | 746,441,280 | 70,891,200 |
| Size | 711.9 MB | 67.6 MB |
| Events in quadrant A | 5,349,159 | 506,862 |
| Events in quadrant B | 4,047,140 | 587,455 |
| Events in quadrant C | 6,267,715 | 483,558 |
| Events in quadrant D | 11,516,499 | 162,959 |
| Mode M9 | |||
|---|---|---|---|
| Quadrant | BADHDUFLAG | Total packets | Discarded packets |
| A | 0 | 12 | 0 |
| B | 0 | 12 | 0 |
| C | 0 | 12 | 0 |
| D | 0 | 12 | 0 |
| Mode M0 | |||
|---|---|---|---|
| Quadrant | BADHDUFLAG | Total packets | Discarded packets |
| A | 0 | 19741 | 1 |
| B | 0 | 15954 | 1 |
| C | 0 | 22669 | 1 |
| D | 0 | 38125 | 1 |
| Mode SS | |||
|---|---|---|---|
| Quadrant | BADHDUFLAG | Total packets | Discarded packets |
| A | 0 | 116 | 0 |
| B | 0 | 116 | 0 |
| C | 0 | 116 | 0 |
| D | 0 | 116 | 0 |
| Quadrant | Total seconds | Saturated seconds | Saturation percentage |
|---|---|---|---|
| A | 5808 | 829 | 14.273416% |
| B | 5808 | 409 | 7.042011% |
| C | 5809 | 857 | 14.752970% |
| D | 5809 | 4192 | 72.163884% |
Noise dominated data is calculated using 1-second bins in cleaned event files. If a bin has >2000 counts, and if more than 50% of those come from <1% of pixels, then it is considered to be noise-dominated and hence unusable.
| Quadrant | # 1 sec bins | Bins with >0 counts | Bins with >2000 counts | High rate bins dominated by noise | Noise dominated (total time) | Noise dominated (detector-on time) | Marked lightcurve |
|---|---|---|---|---|---|---|---|
| A | 6943 | 5809 | 647 | 647 | 9.32% | 11.14% | 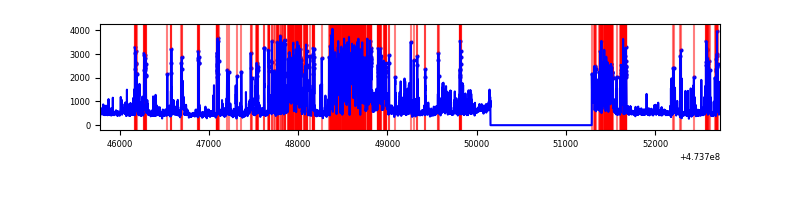 |
| B | 6943 | 5808 | 249 | 249 | 3.59% | 4.29% | 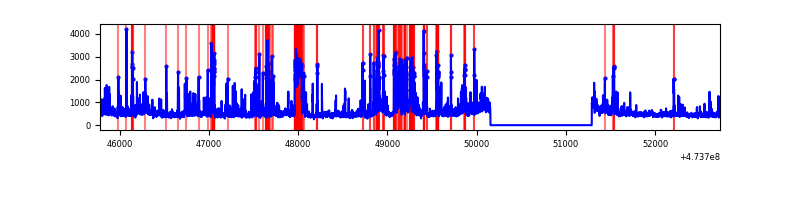 |
| C | 6944 | 5810 | 754 | 754 | 10.86% | 12.98% | 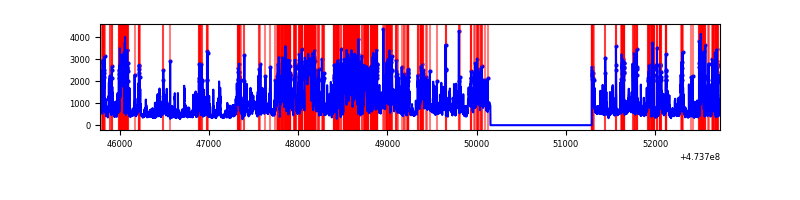 |
| D | 6944 | 5809 | 3611 | 3611 | 52.00% | 62.16% | 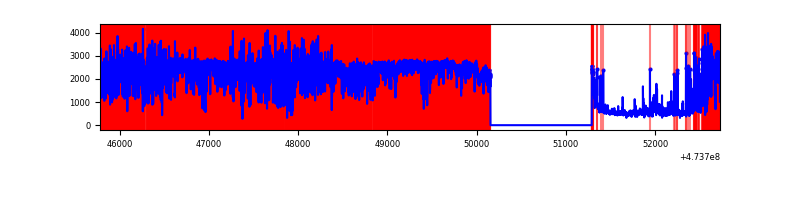 |
Top three noisy pixels from each quadrant. If the there are fewer than three noisy pixels in the level2.evt file, extra rows are filled as -1
| Pixel properties | Quadrant properties | ||||||
|---|---|---|---|---|---|---|---|
| Quadrant | DetID | PixID | Counts | Sigma | Mean | Median | Sigma |
| A | 8 | 248 | 1521672 | 10353.37 | 595 | 579 | 146.9 |
| A | 4 | 249 | 427169 | 2903.6 | 595 | 579 | 146.9 |
| A | 8 | 38 | 117847 | 798.19 | 595 | 579 | 146.9 |
| B | 6 | 51 | 356394 | 2719.19 | 614 | 593 | 130.8 |
| B | 4 | 206 | 262967 | 2005.18 | 614 | 593 | 130.8 |
| B | 1 | 238 | 183260 | 1396.02 | 614 | 593 | 130.8 |
| C | 15 | 232 | 1526711 | 9480.0 | 578 | 574 | 161.0 |
| C | 15 | 127 | 525851 | 3262.89 | 578 | 574 | 161.0 |
| C | 0 | 208 | 478225 | 2967.05 | 578 | 574 | 161.0 |
| D | 12 | 1 | 5062196 | 60456.01 | 295 | 285 | 83.7 |
| D | 7 | 61 | 3639325 | 43462.21 | 295 | 285 | 83.7 |
| D | 7 | 110 | 539478 | 6439.75 | 295 | 285 | 83.7 |
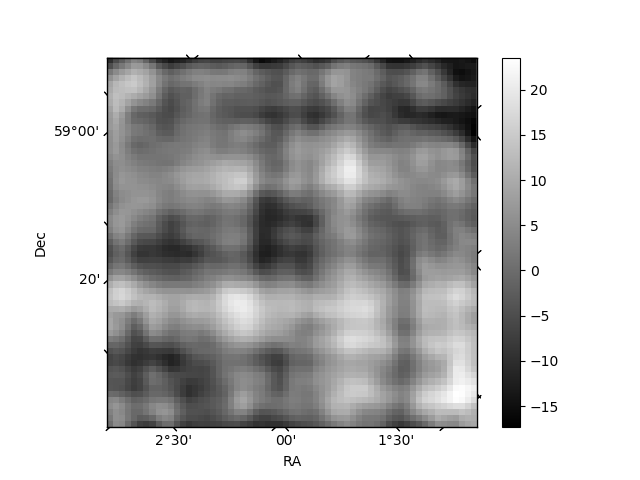
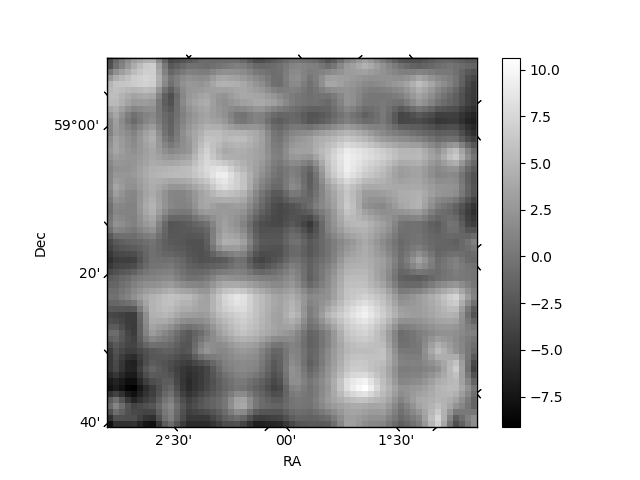
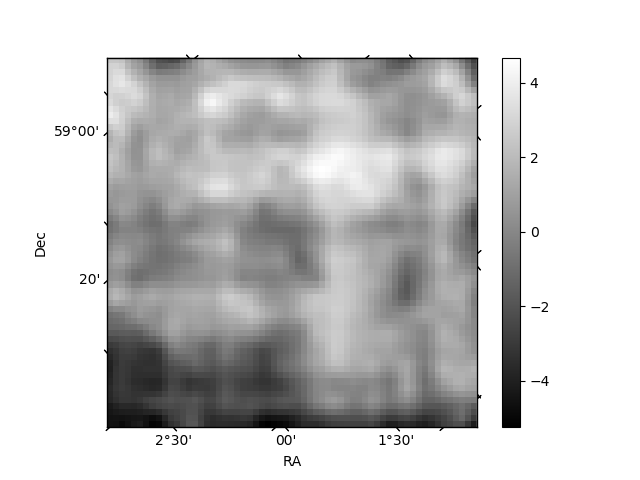
Histogram calculated using DETX and DETY for each event in the final _common_clean file
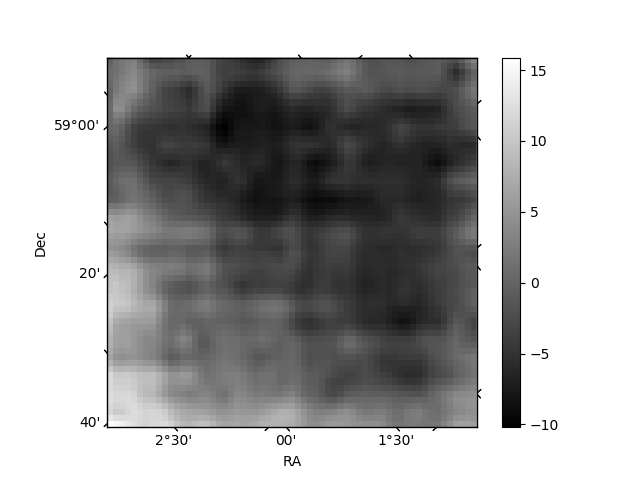
| Quadrant A | 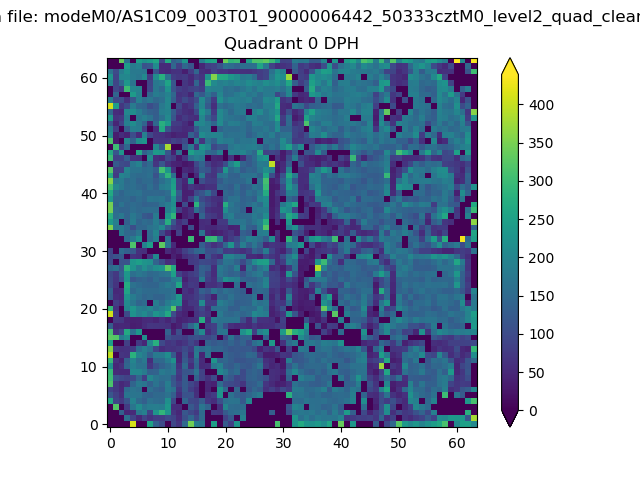 |
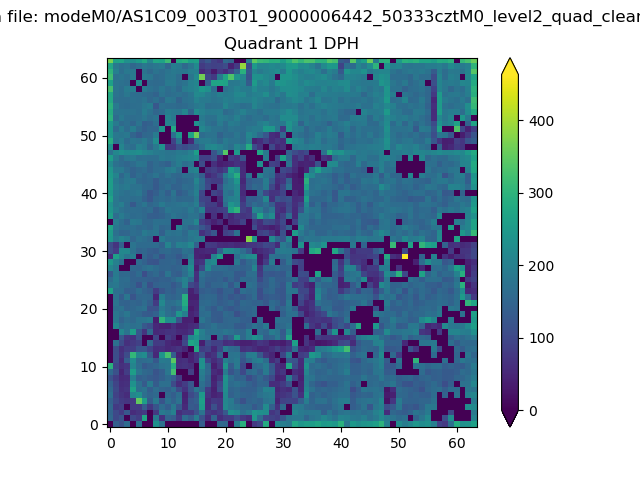 |
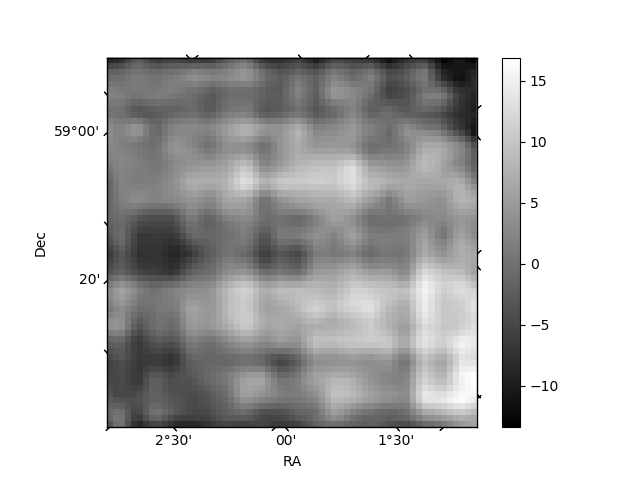
Quadrant B |
|---|---|---|---|
| Quadrant D |  |
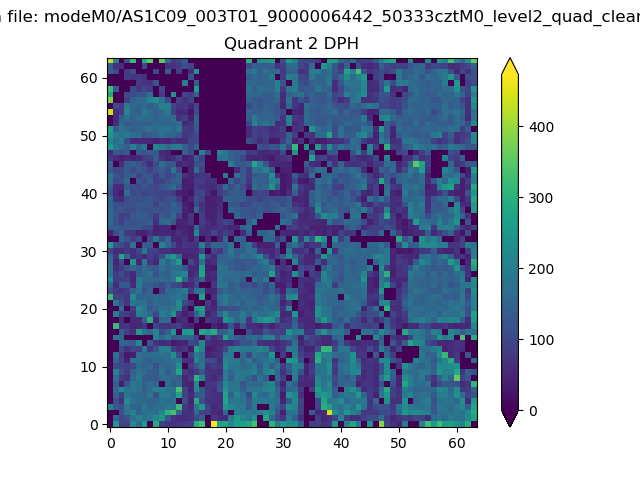 |
Quadrant C |
| Plot type | Count rate plots | Images |
|---|---|---|
| Comparison with Poisson distribution Blue bars denote a histogram of data divided into 1 sec bins. Red curve is a Poisson curve with rate = median count rate of data. |
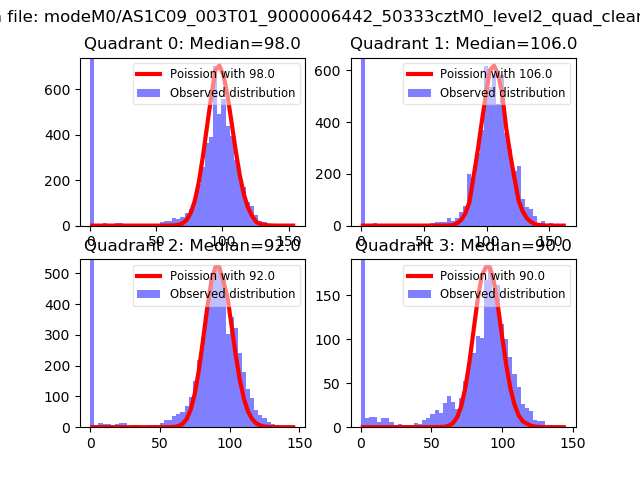 |
 |
| Quadrant-wise count rates Data is divided into 100 sec bins |
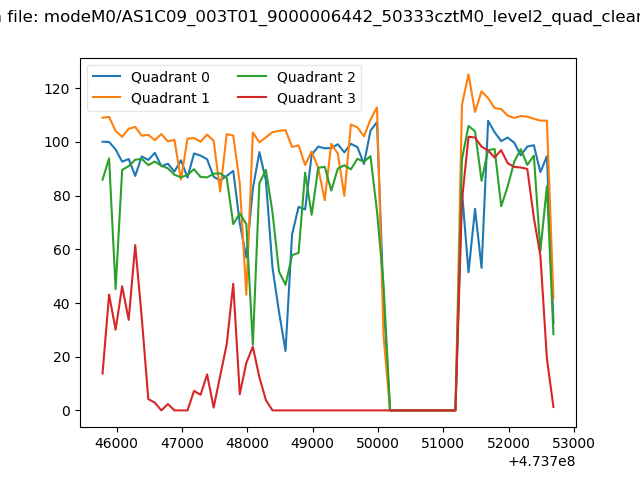 |
|
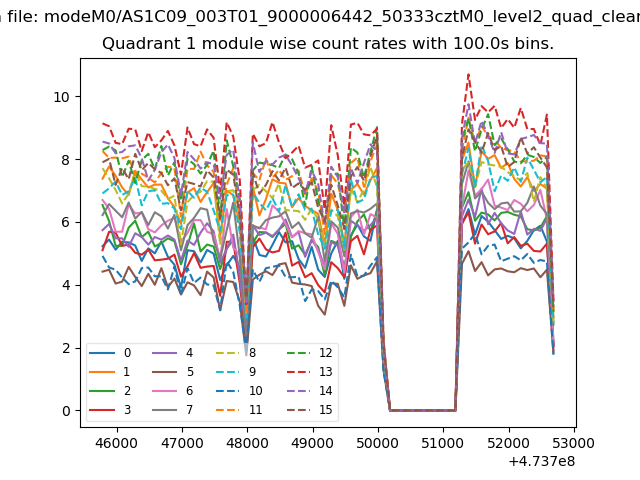
| Module-wise count rates for Quadrant A Data is divided into 100 sec bins |
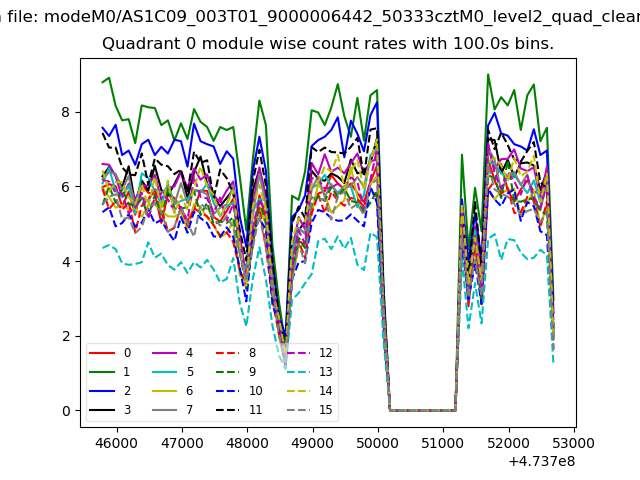 |
 |
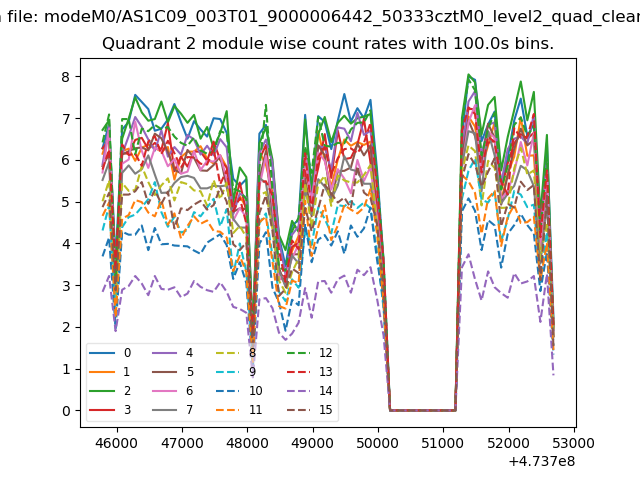
| Module-wise count rates for Quadrant B Data is divided into 100 sec bins |
 |
 |
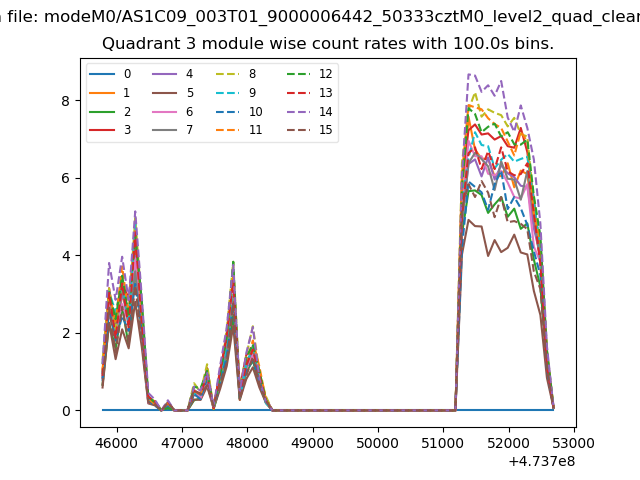
| Module-wise count rates for Quadrant C Data is divided into 100 sec bins |
 |
 |
| Module-wise count rates for Quadrant D Data is divided into 100 sec bins |
 |
 |
| Parameter | Plot |
|---|---|
| CZT HV Monitor | 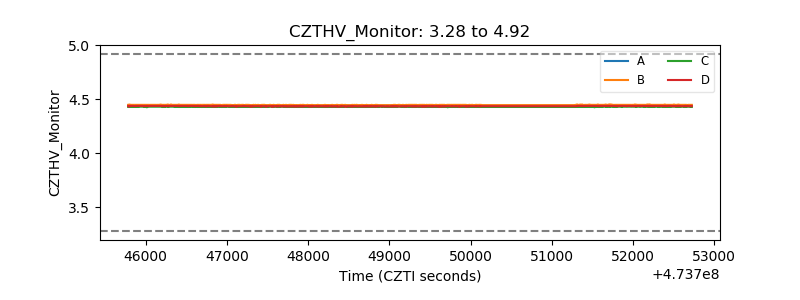 |
| D_VDD | 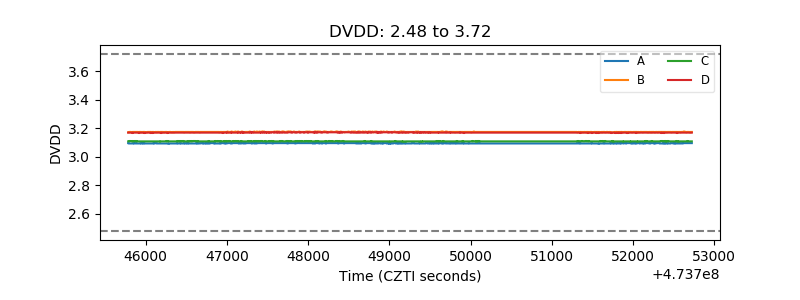 |
| Temperature 1 | 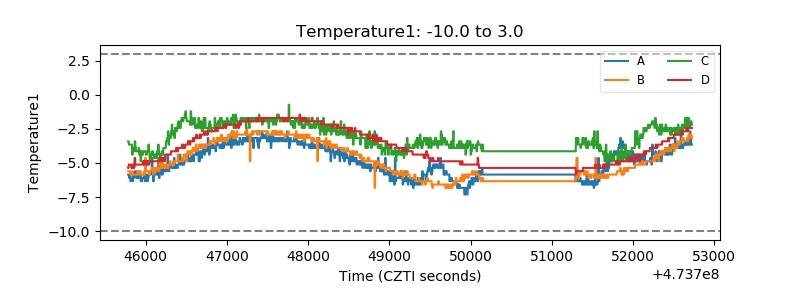 |
| Veto HV Monitor | 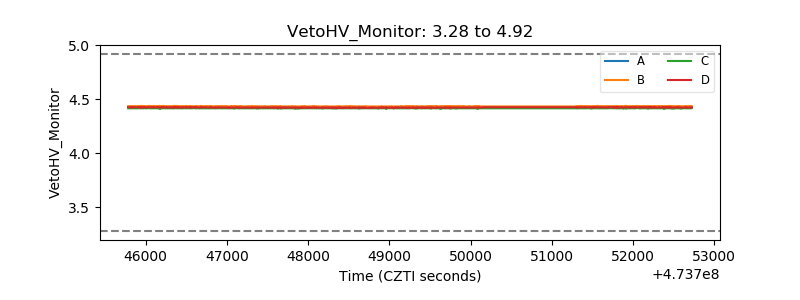 |
| Veto LLD | 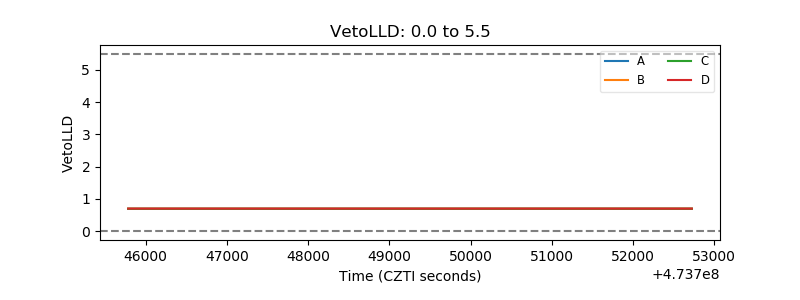 |
| Alpha Counter | 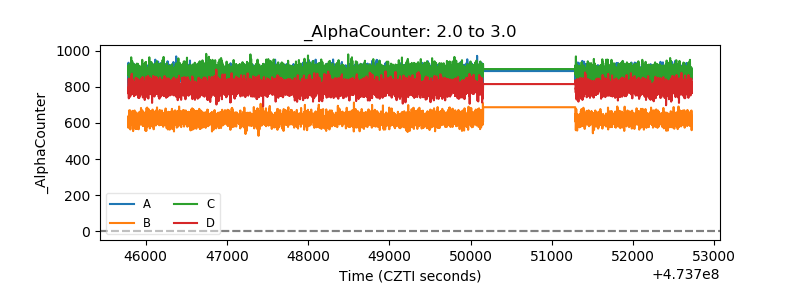 |
| _CPM_Rate | 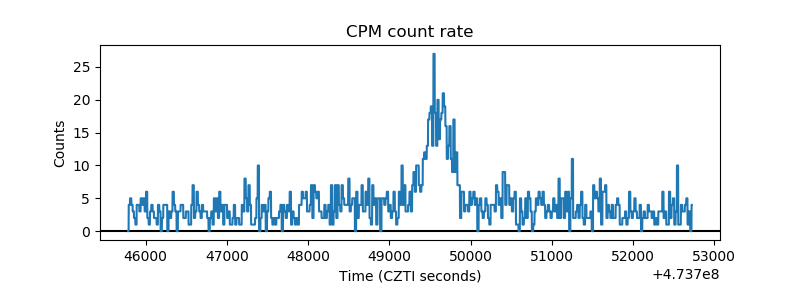 |
| CZT Counter | 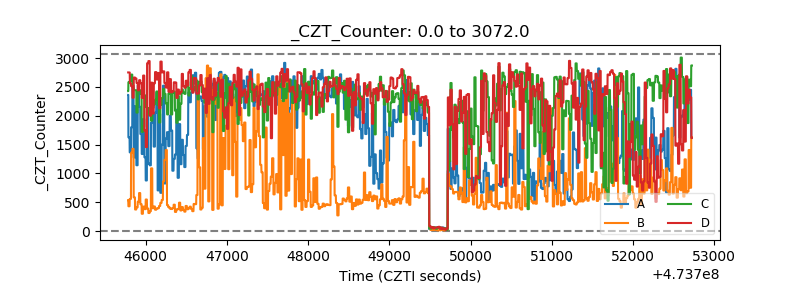 |
| +2.5 Volts monitor | 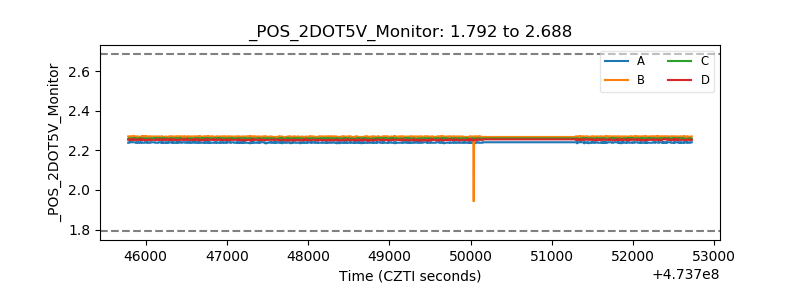 |
| +5 Volts monitor |  |
| _ROLL_ROT | 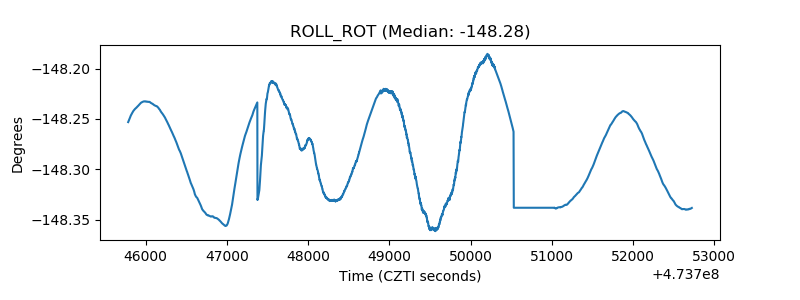 |
| _Roll_DEC | 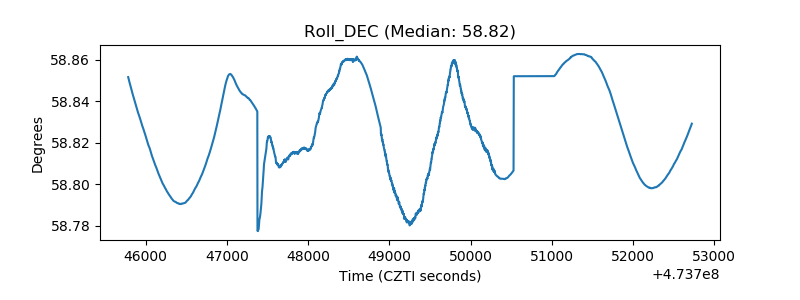 |
| _Roll_RA | 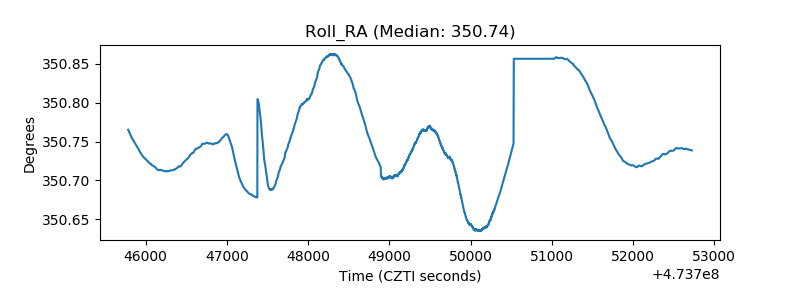 |
| Veto Counter | 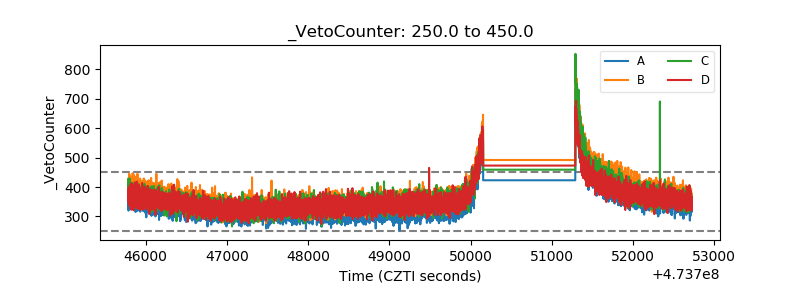 |