| Param | Original file | Final file |
|---|---|---|
| Filename | modeM0/AS1C09_003T01_9000006442_50336cztM0_level2.fits | modeM0/AS1C09_003T01_9000006442_50336cztM0_level2_quad_clean.evt |
| Size (bytes) | 862,145,280 | 87,238,080 |
| Size | 822.2 MB | 83.2 MB |
| Events in quadrant A | 5,448,442 | 646,742 |
| Events in quadrant B | 4,668,313 | 703,032 |
| Events in quadrant C | 7,717,214 | 542,778 |
| Events in quadrant D | 13,537,033 | 259,895 |
| Mode M9 | |||
|---|---|---|---|
| Quadrant | BADHDUFLAG | Total packets | Discarded packets |
| A | 0 | 7 | 0 |
| B | 0 | 7 | 0 |
| C | 0 | 7 | 0 |
| D | 0 | 7 | 0 |
| Mode M0 | |||
|---|---|---|---|
| Quadrant | BADHDUFLAG | Total packets | Discarded packets |
| A | 0 | 21019 | 2 |
| B | 0 | 18619 | 2 |
| C | 0 | 27850 | 2 |
| D | 0 | 45053 | 5 |
| Mode SS | |||
|---|---|---|---|
| Quadrant | BADHDUFLAG | Total packets | Discarded packets |
| A | 0 | 142 | 0 |
| B | 0 | 142 | 0 |
| C | 0 | 142 | 0 |
| D | 0 | 142 | 0 |
| Quadrant | Total seconds | Saturated seconds | Saturation percentage |
|---|---|---|---|
| A | 7018 | 362 | 5.158165% |
| B | 7018 | 334 | 4.759191% |
| C | 7019 | 1332 | 18.977062% |
| D | 7018 | 4271 | 60.857794% |
Noise dominated data is calculated using 1-second bins in cleaned event files. If a bin has >2000 counts, and if more than 50% of those come from <1% of pixels, then it is considered to be noise-dominated and hence unusable.
| Quadrant | # 1 sec bins | Bins with >0 counts | Bins with >2000 counts | High rate bins dominated by noise | Noise dominated (total time) | Noise dominated (detector-on time) | Marked lightcurve |
|---|---|---|---|---|---|---|---|
| A | 7703 | 7018 | 203 | 203 | 2.64% | 2.89% | 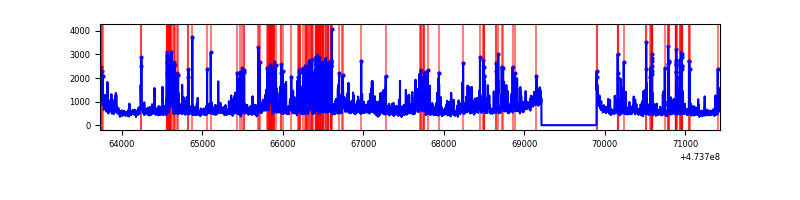 |
| B | 7703 | 7018 | 145 | 145 | 1.88% | 2.07% | 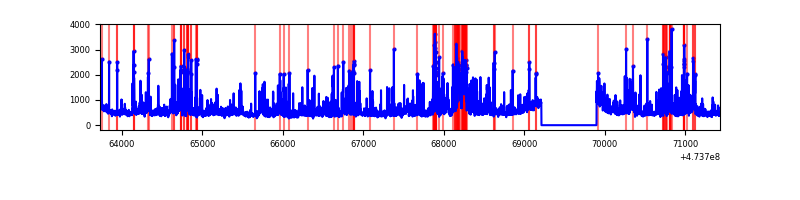 |
| C | 7704 | 7019 | 1209 | 1209 | 15.69% | 17.22% | 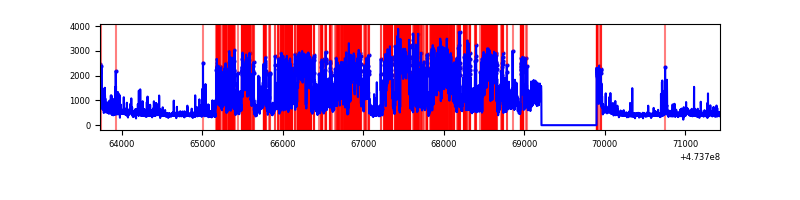 |
| D | 7703 | 7018 | 4107 | 4107 | 53.32% | 58.52% | 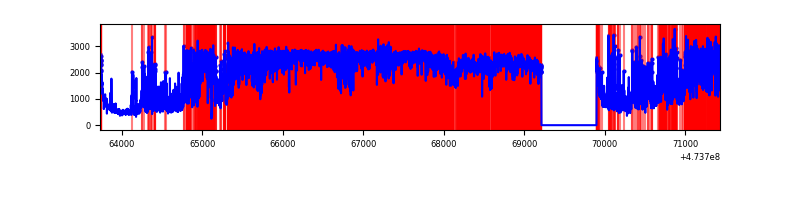 |
Top three noisy pixels from each quadrant. If the there are fewer than three noisy pixels in the level2.evt file, extra rows are filled as -1
| Pixel properties | Quadrant properties | ||||||
|---|---|---|---|---|---|---|---|
| Quadrant | DetID | PixID | Counts | Sigma | Mean | Median | Sigma |
| A | 8 | 248 | 488115 | 2637.13 | 751 | 735 | 184.8 |
| A | 3 | 231 | 483421 | 2611.73 | 751 | 735 | 184.8 |
| A | 7 | 206 | 258579 | 1395.15 | 751 | 735 | 184.8 |
| B | 10 | 254 | 454702 | 2862.61 | 744 | 719 | 158.6 |
| B | 1 | 238 | 259678 | 1632.88 | 744 | 719 | 158.6 |
| B | 10 | 44 | 173856 | 1091.72 | 744 | 719 | 158.6 |
| C | 15 | 127 | 2161699 | 11308.11 | 697 | 694 | 191.1 |
| C | 0 | 208 | 774247 | 4047.85 | 697 | 694 | 191.1 |
| C | 15 | 196 | 648900 | 3391.93 | 697 | 694 | 191.1 |
| D | 7 | 61 | 8126807 | 59094.33 | 481 | 465 | 137.5 |
| D | 11 | 245 | 677259 | 4921.61 | 481 | 465 | 137.5 |
| D | 15 | 154 | 441032 | 3203.78 | 481 | 465 | 137.5 |
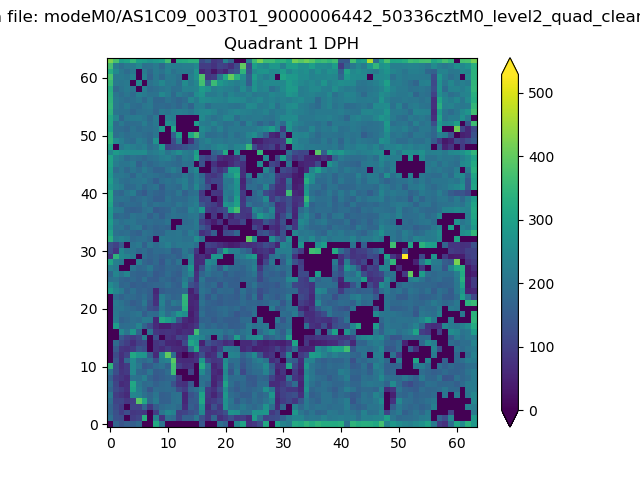
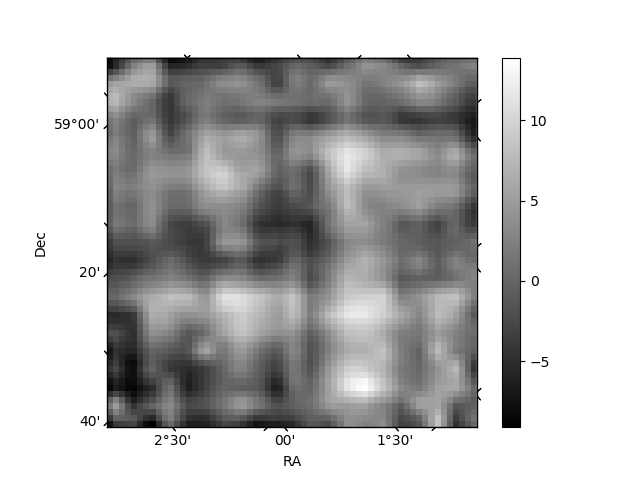
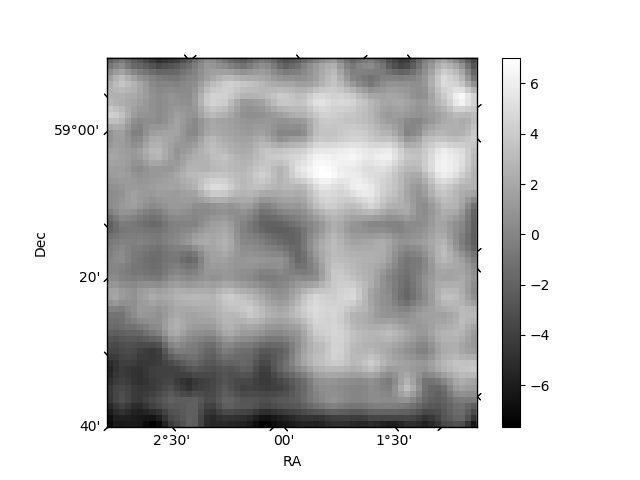
Histogram calculated using DETX and DETY for each event in the final _common_clean file
| Quadrant A |  |
 |
Quadrant B |
|---|---|---|---|
| Quadrant D | 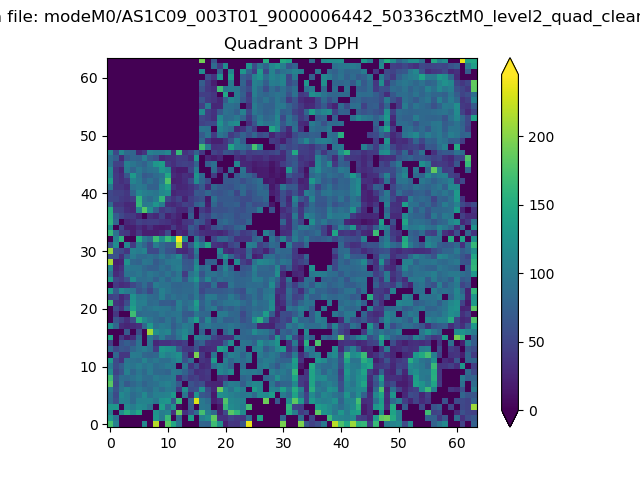 |
 |
Quadrant C |
| Plot type | Count rate plots | Images |
|---|---|---|
| Comparison with Poisson distribution Blue bars denote a histogram of data divided into 1 sec bins. Red curve is a Poisson curve with rate = median count rate of data. |
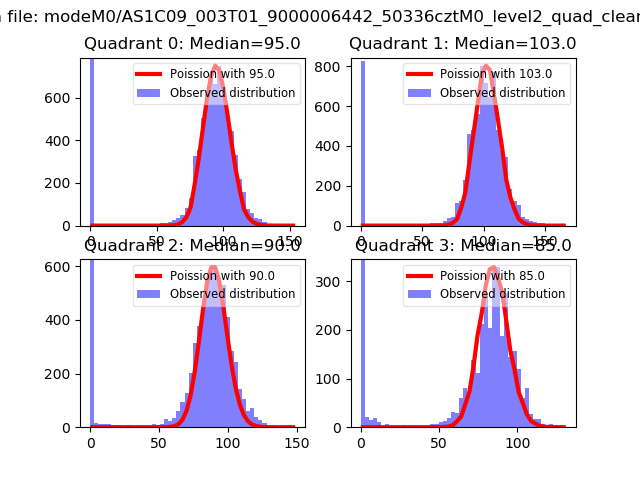 |
 |
| Quadrant-wise count rates Data is divided into 100 sec bins |
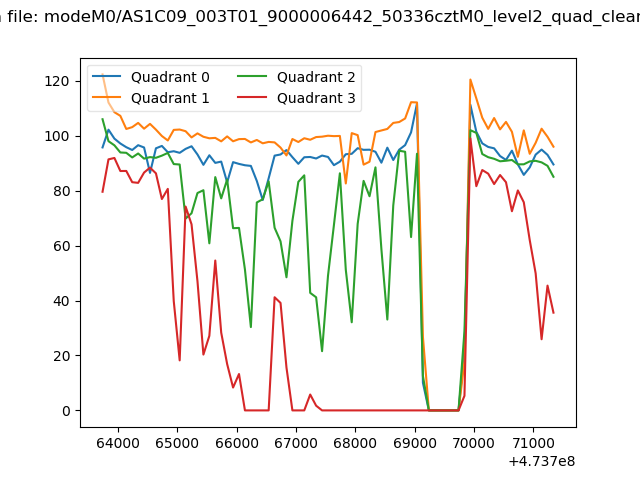 |
|
| Module-wise count rates for Quadrant A Data is divided into 100 sec bins |
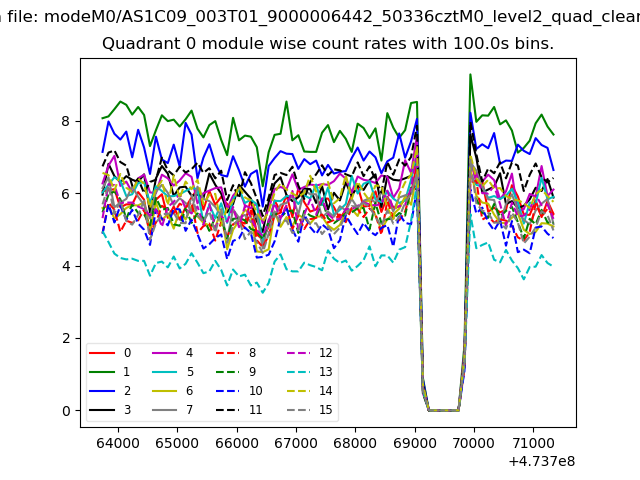 |
 |
| Module-wise count rates for Quadrant B Data is divided into 100 sec bins |
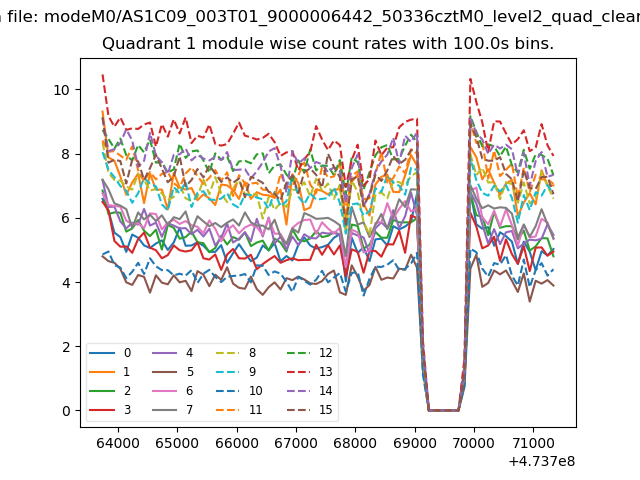 |
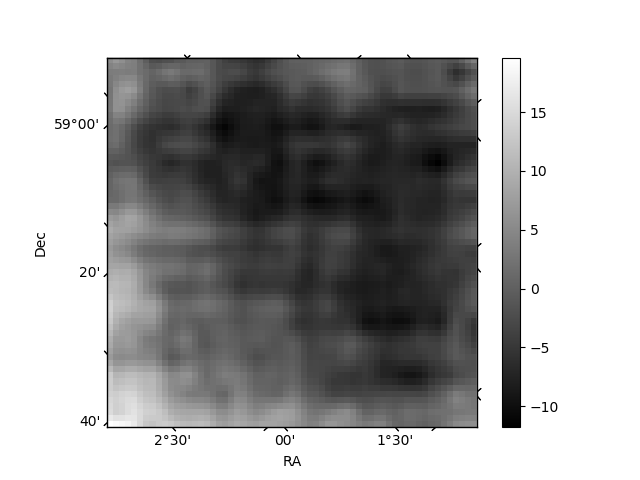 |
| Module-wise count rates for Quadrant C Data is divided into 100 sec bins |
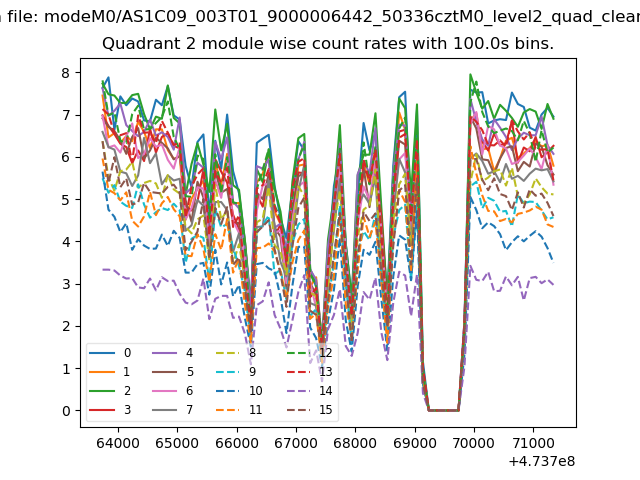 |
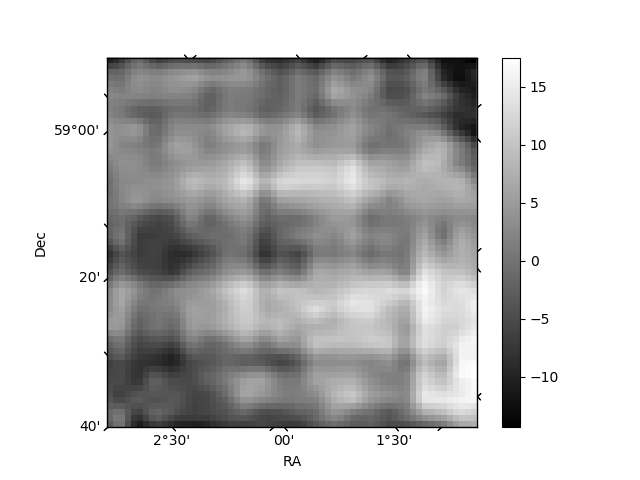 |
| Module-wise count rates for Quadrant D Data is divided into 100 sec bins |
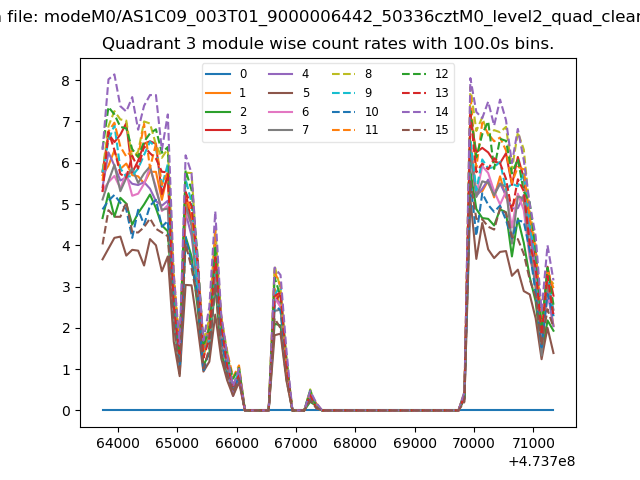 |
 |
| Parameter | Plot |
|---|---|
| CZT HV Monitor | 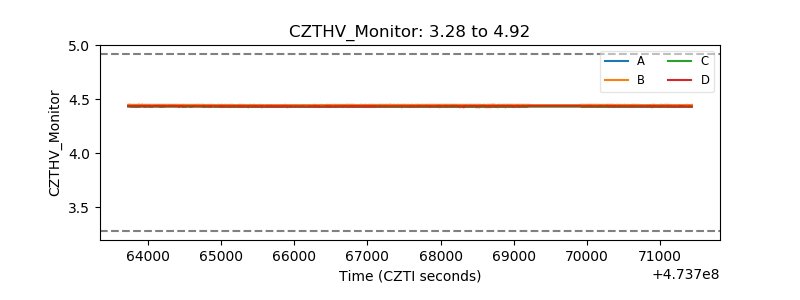 |
| D_VDD | 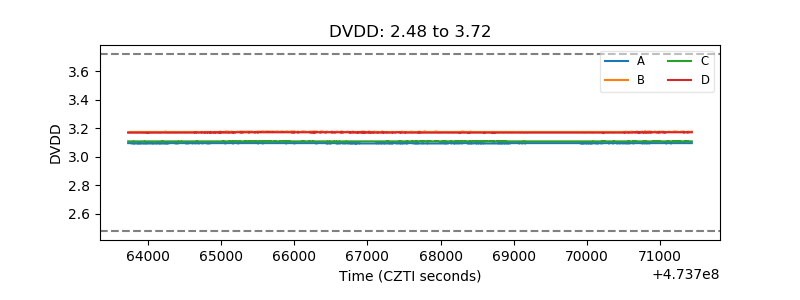 |
| Temperature 1 | 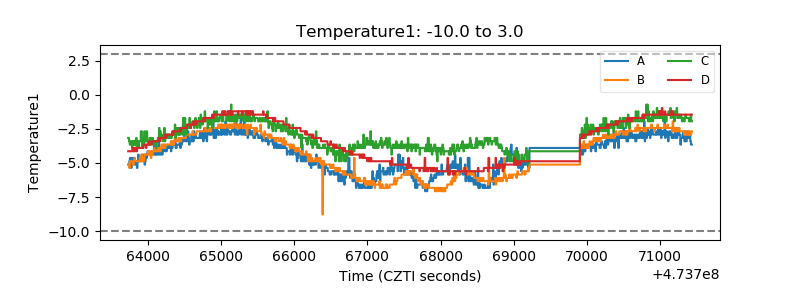 |
| Veto HV Monitor | 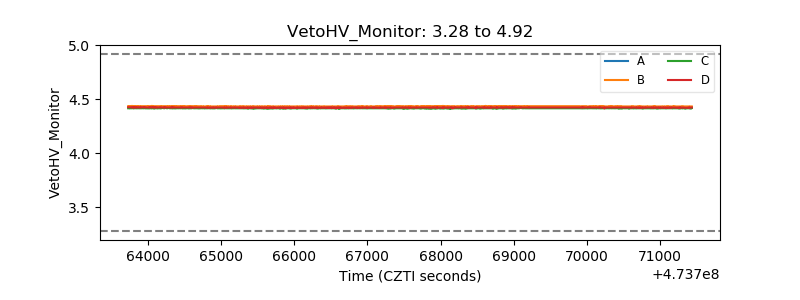 |
| Veto LLD | 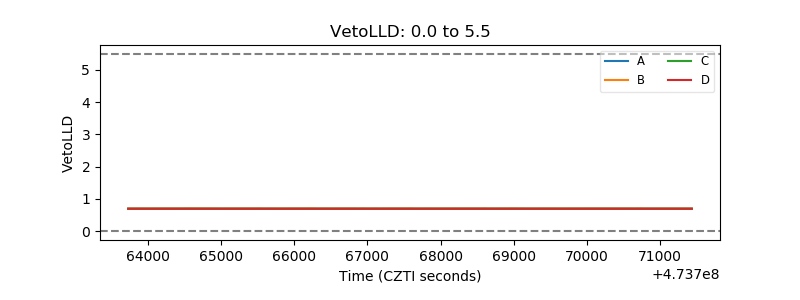 |
| Alpha Counter | 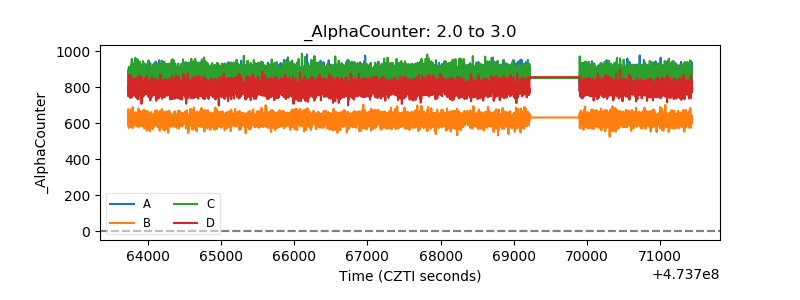 |
| _CPM_Rate | 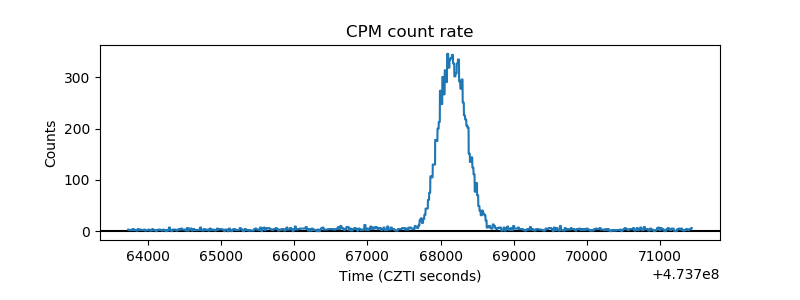 |
| CZT Counter | 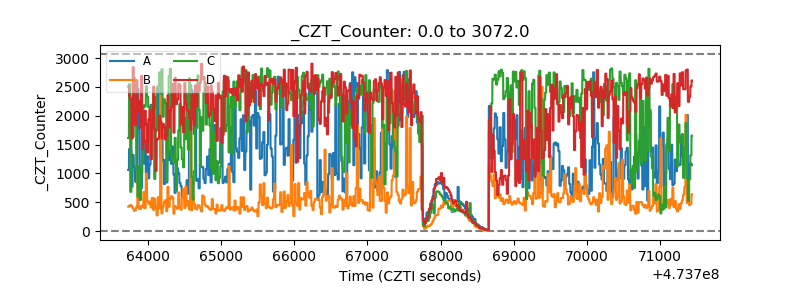 |
| +2.5 Volts monitor | 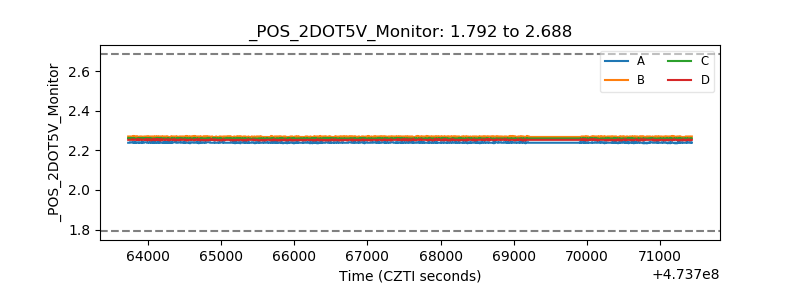 |
| +5 Volts monitor |  |
| _ROLL_ROT | 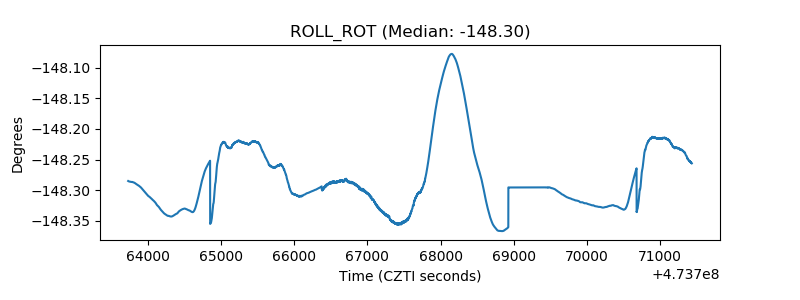 |
| _Roll_DEC | 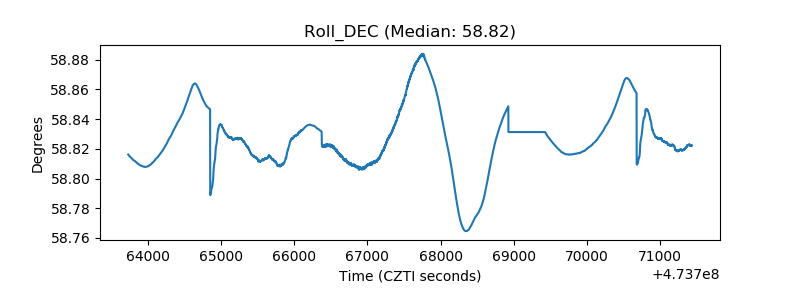 |
| _Roll_RA | 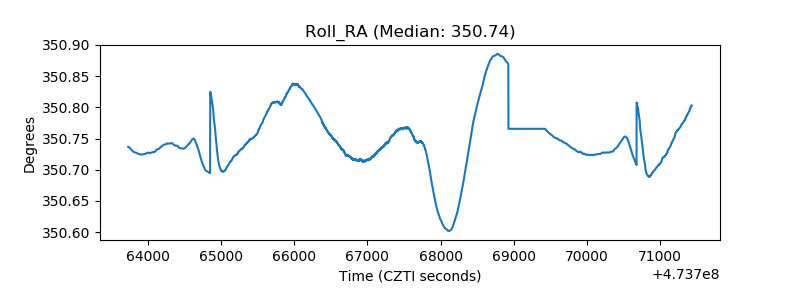 |
| Veto Counter | 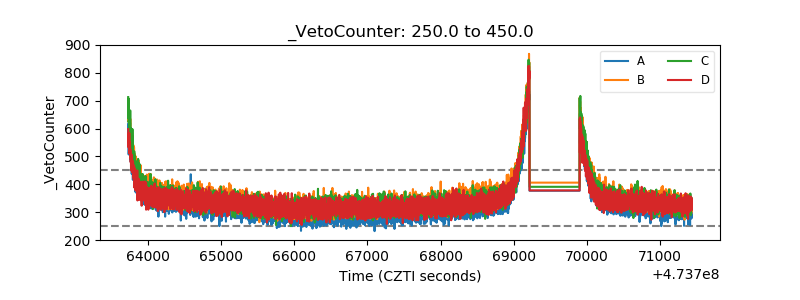 |