| Param | Original file | Final file |
|---|---|---|
| Filename | modeM0/AS1C09_003T01_9000006442_50337cztM0_level2.fits | modeM0/AS1C09_003T01_9000006442_50337cztM0_level2_quad_clean.evt |
| Size (bytes) | 955,535,040 | 78,454,080 |
| Size | 911.3 MB | 74.8 MB |
| Events in quadrant A | 5,163,322 | 635,585 |
| Events in quadrant B | 4,685,603 | 689,358 |
| Events in quadrant C | 8,926,615 | 480,824 |
| Events in quadrant D | 16,056,694 | 84,299 |
| Mode M0 | |||
|---|---|---|---|
| Quadrant | BADHDUFLAG | Total packets | Discarded packets |
| A | 0 | 20013 | 7 |
| B | 0 | 18666 | 3 |
| C | 0 | 31356 | 4 |
| D | 0 | 52486 | 4 |
| Mode SS | |||
|---|---|---|---|
| Quadrant | BADHDUFLAG | Total packets | Discarded packets |
| A | 0 | 142 | 0 |
| B | 0 | 142 | 0 |
| C | 0 | 142 | 0 |
| D | 0 | 142 | 0 |
| Quadrant | Total seconds | Saturated seconds | Saturation percentage |
|---|---|---|---|
| A | 6954 | 352 | 5.061835% |
| B | 6957 | 344 | 4.944660% |
| C | 6956 | 1827 | 26.265095% |
| D | 6955 | 6148 | 88.396837% |
Noise dominated data is calculated using 1-second bins in cleaned event files. If a bin has >2000 counts, and if more than 50% of those come from <1% of pixels, then it is considered to be noise-dominated and hence unusable.
| Quadrant | # 1 sec bins | Bins with >0 counts | Bins with >2000 counts | High rate bins dominated by noise | Noise dominated (total time) | Noise dominated (detector-on time) | Marked lightcurve |
|---|---|---|---|---|---|---|---|
| A | 7081 | 6960 | 222 | 222 | 3.14% | 3.19% | 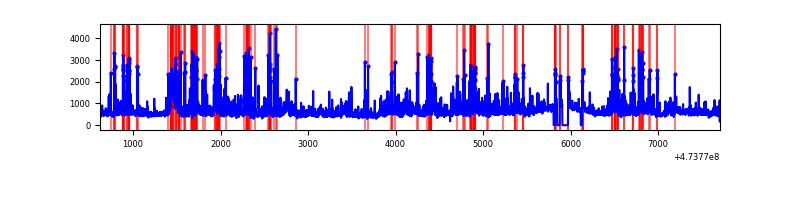 |
| B | 7082 | 6961 | 183 | 183 | 2.58% | 2.63% | 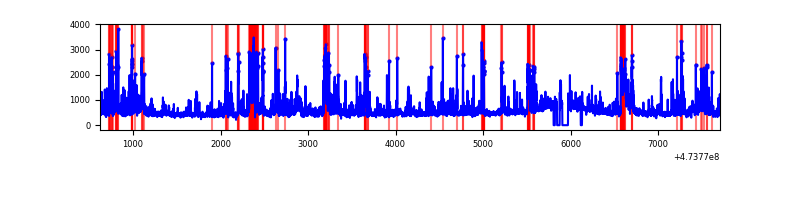 |
| C | 7081 | 6958 | 1640 | 1640 | 23.16% | 23.57% | 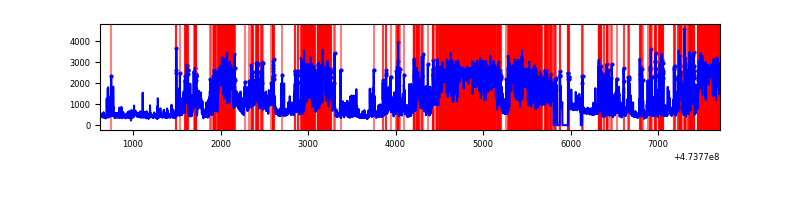 |
| D | 7080 | 6956 | 5554 | 5554 | 78.45% | 79.84% | 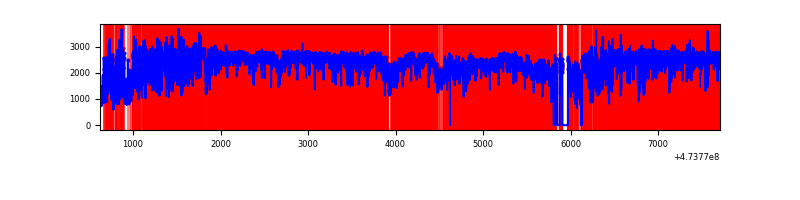 |
Top three noisy pixels from each quadrant. If the there are fewer than three noisy pixels in the level2.evt file, extra rows are filled as -1
| Pixel properties | Quadrant properties | ||||||
|---|---|---|---|---|---|---|---|
| Quadrant | DetID | PixID | Counts | Sigma | Mean | Median | Sigma |
| A | 8 | 248 | 626745 | 3397.37 | 746 | 727 | 184.3 |
| A | 3 | 231 | 267356 | 1446.98 | 746 | 727 | 184.3 |
| A | 4 | 3 | 197287 | 1066.72 | 746 | 727 | 184.3 |
| B | 1 | 238 | 528634 | 3361.68 | 742 | 717 | 157.0 |
| B | 10 | 44 | 219662 | 1394.2 | 742 | 717 | 157.0 |
| B | 12 | 0 | 109220 | 690.93 | 742 | 717 | 157.0 |
| C | 15 | 127 | 2117566 | 11418.59 | 667 | 660 | 185.4 |
| C | 0 | 208 | 1260331 | 6794.67 | 667 | 660 | 185.4 |
| C | 15 | 196 | 1155697 | 6230.27 | 667 | 660 | 185.4 |
| D | 7 | 61 | 8727647 | 102252.28 | 292 | 280 | 85.4 |
| D | 11 | 245 | 2904104 | 34022.02 | 292 | 280 | 85.4 |
| D | 15 | 108 | 615555 | 7208.73 | 292 | 280 | 85.4 |
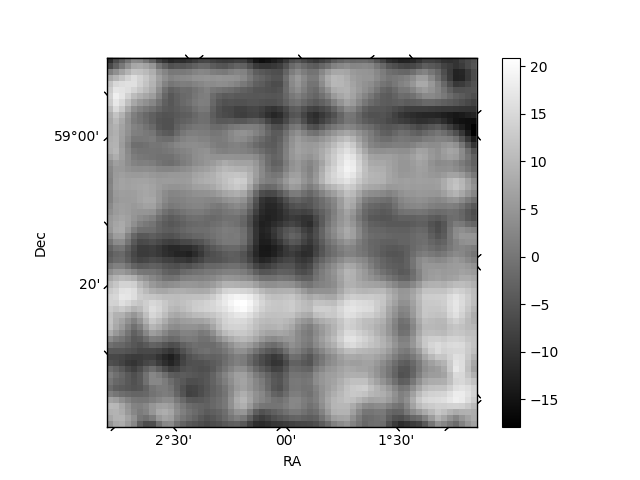
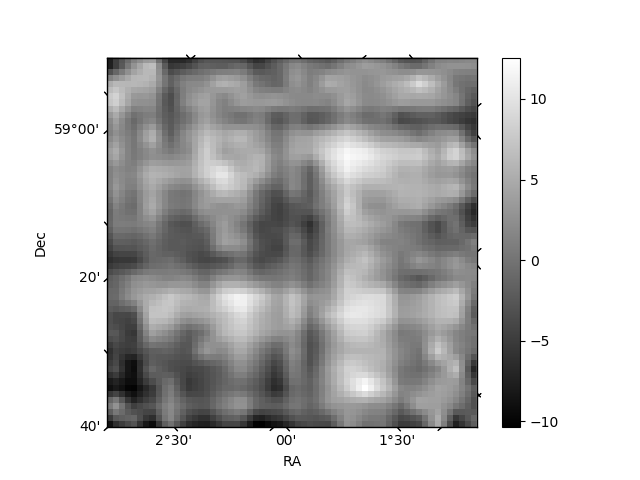
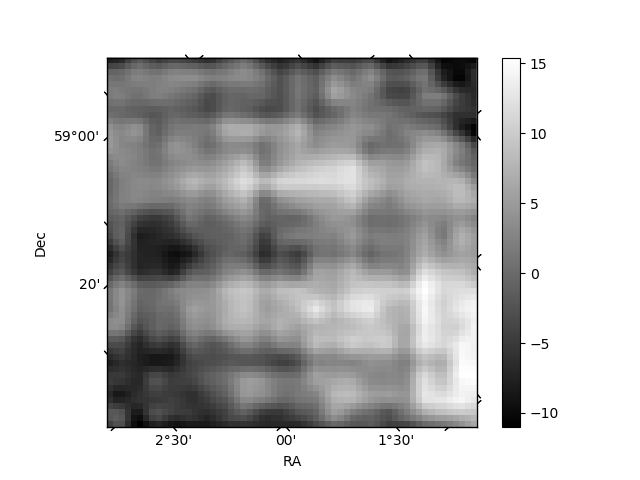
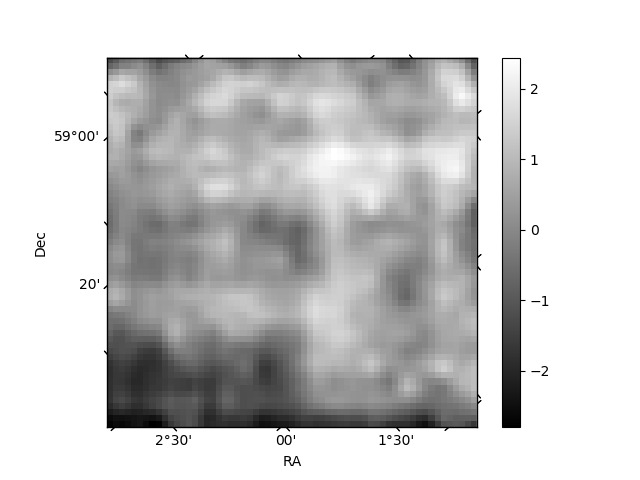
Histogram calculated using DETX and DETY for each event in the final _common_clean file
| Quadrant A | 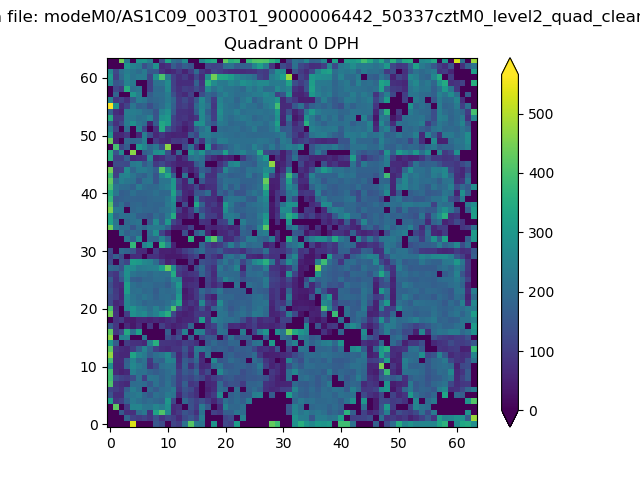 |
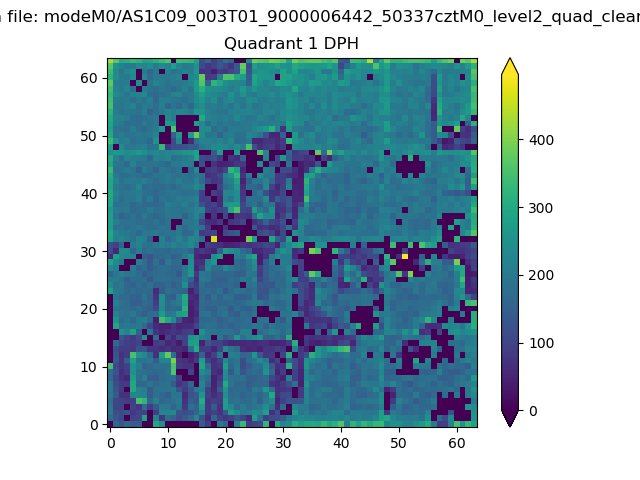 |
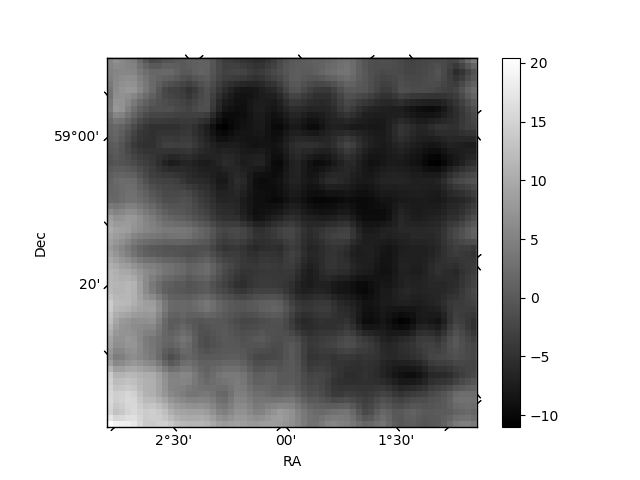
Quadrant B |
|---|---|---|---|
| Quadrant D | 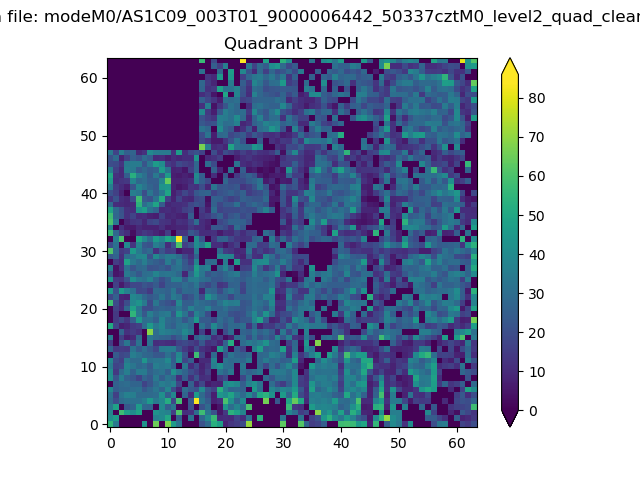 |
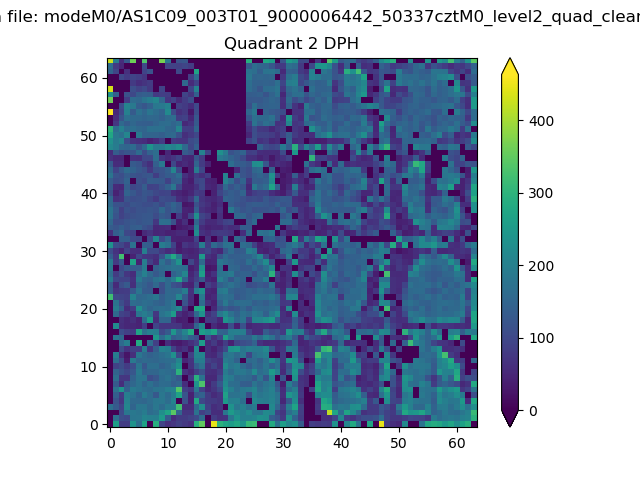 |
Quadrant C |
| Plot type | Count rate plots | Images |
|---|---|---|
| Comparison with Poisson distribution Blue bars denote a histogram of data divided into 1 sec bins. Red curve is a Poisson curve with rate = median count rate of data. |
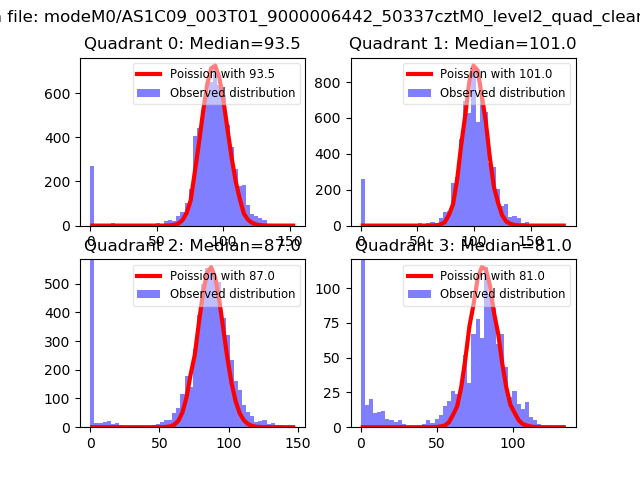 |
 |
| Quadrant-wise count rates Data is divided into 100 sec bins |
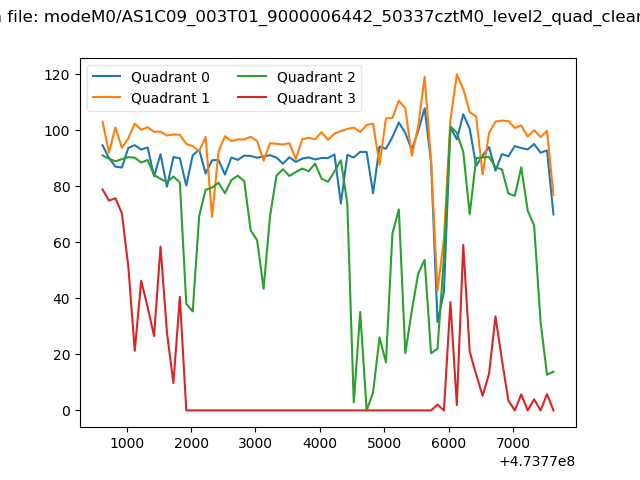 |
|
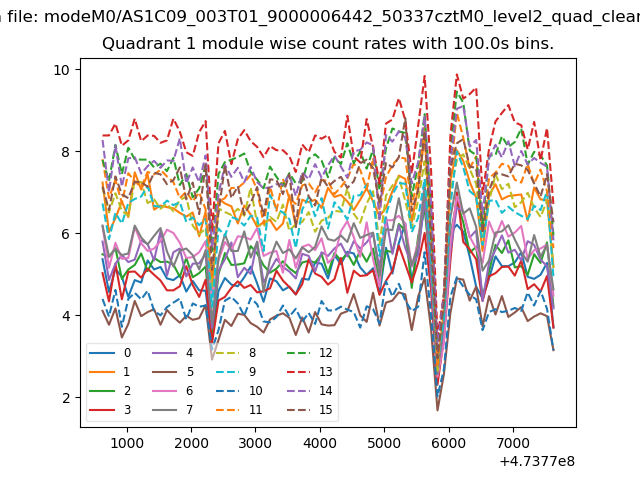
| Module-wise count rates for Quadrant A Data is divided into 100 sec bins |
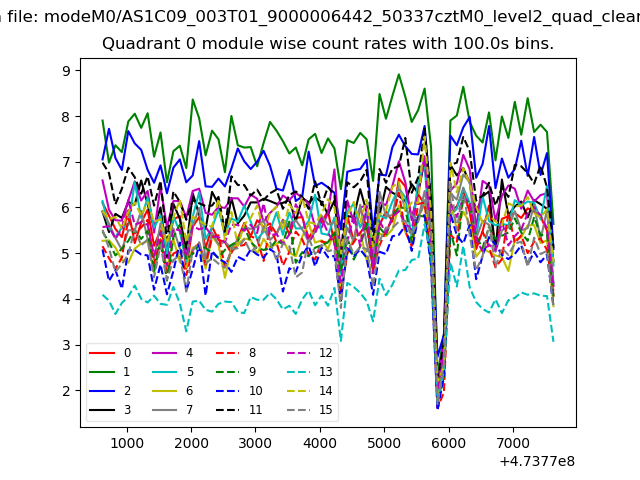 |
 |
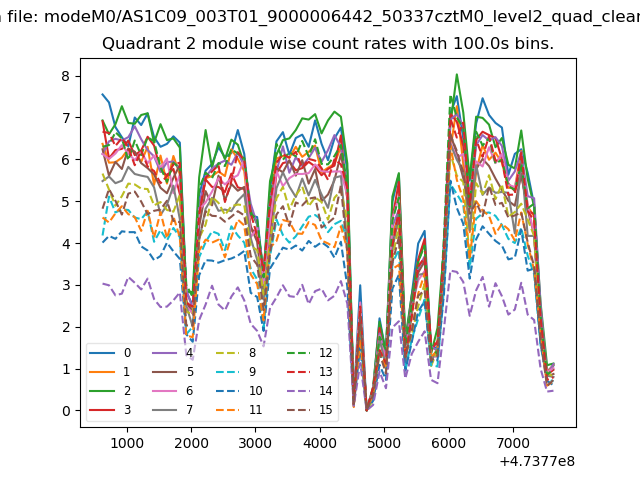
| Module-wise count rates for Quadrant B Data is divided into 100 sec bins |
 |
 |
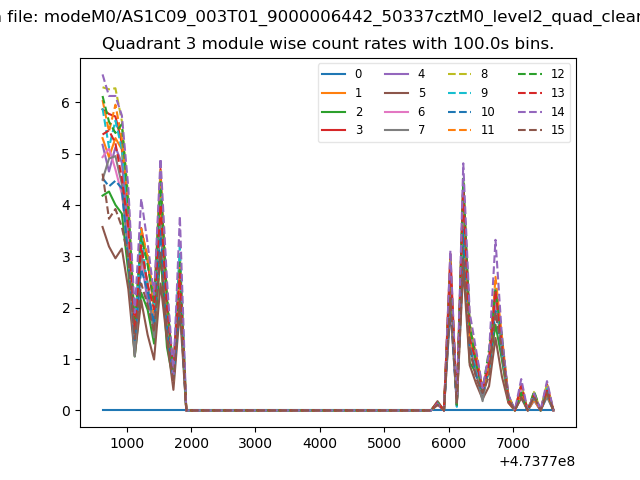
| Module-wise count rates for Quadrant C Data is divided into 100 sec bins |
 |
 |
| Module-wise count rates for Quadrant D Data is divided into 100 sec bins |
 |
 |
| Parameter | Plot |
|---|---|
| CZT HV Monitor | 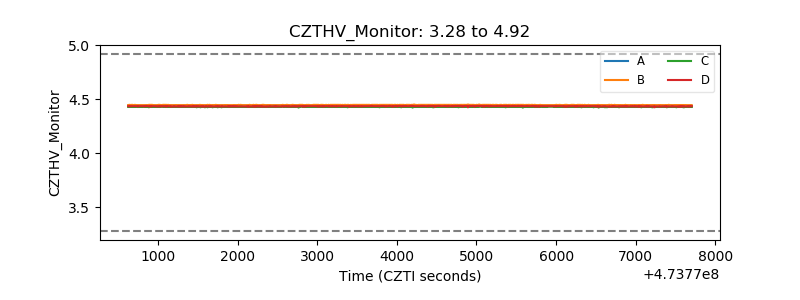 |
| D_VDD | 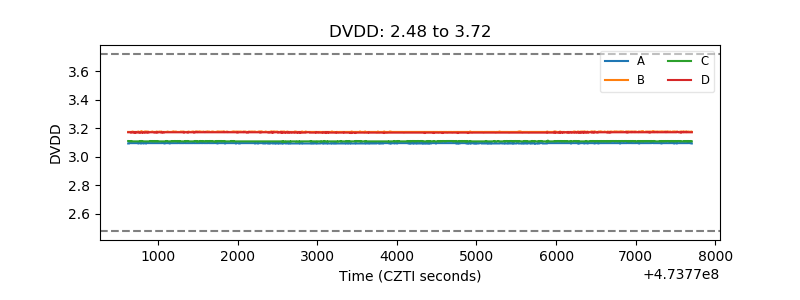 |
| Temperature 1 | 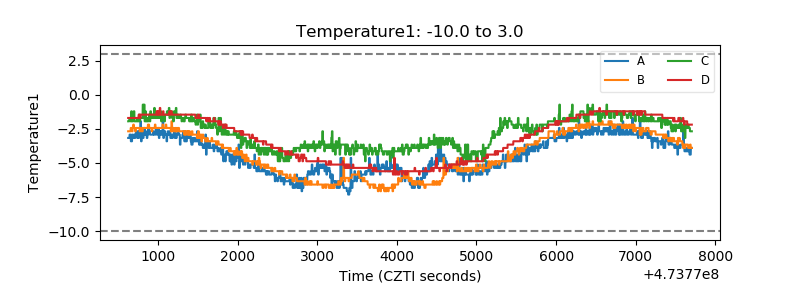 |
| Veto HV Monitor | 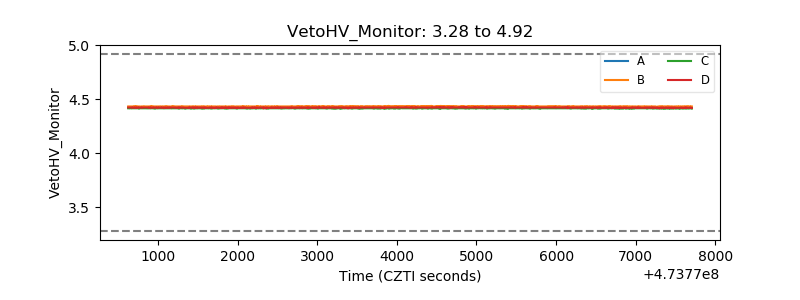 |
| Veto LLD | 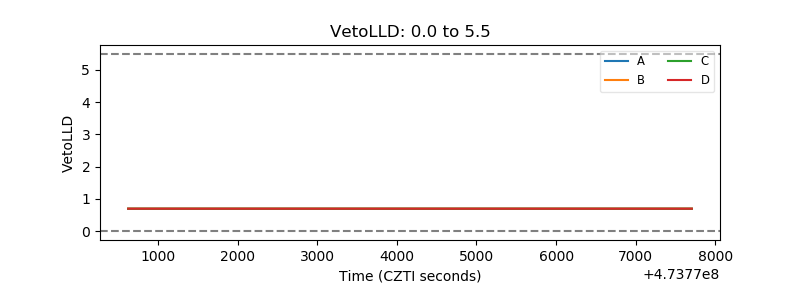 |
| Alpha Counter | 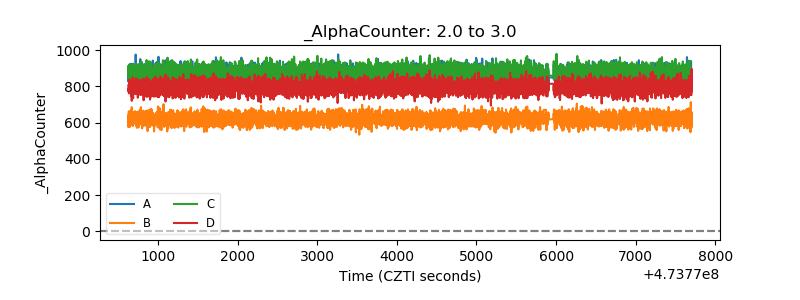 |
| _CPM_Rate | 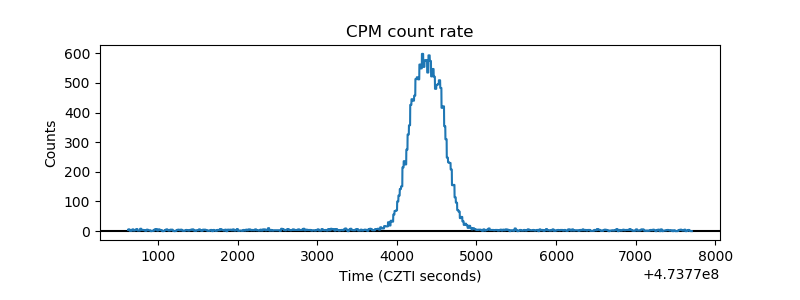 |
| CZT Counter | 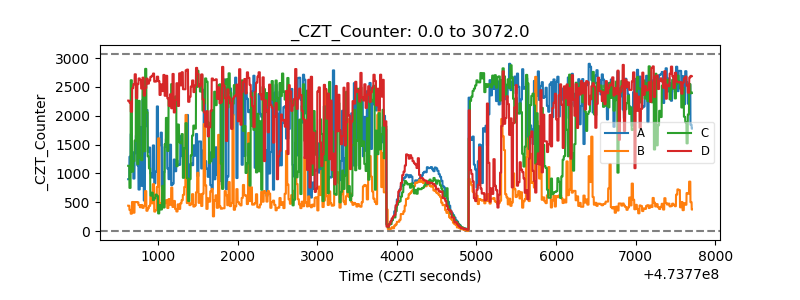 |
| +2.5 Volts monitor | 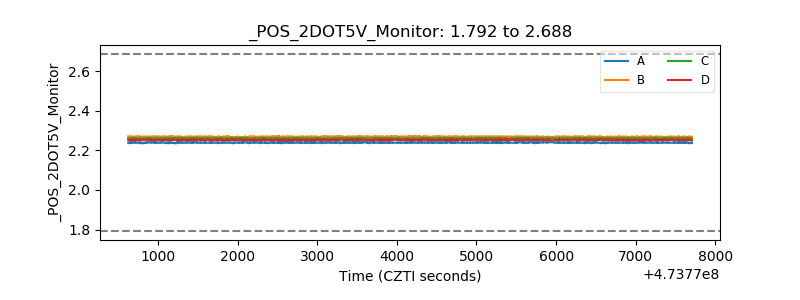 |
| +5 Volts monitor | 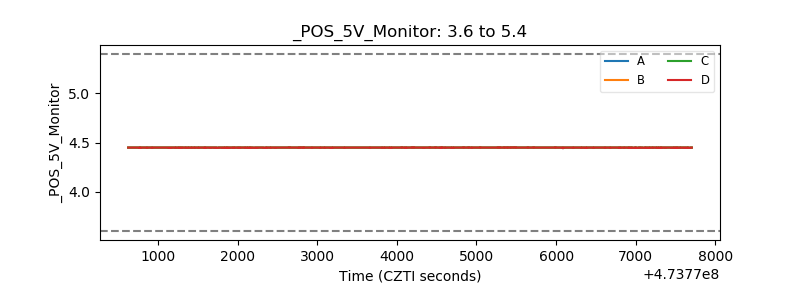 |
| _ROLL_ROT | 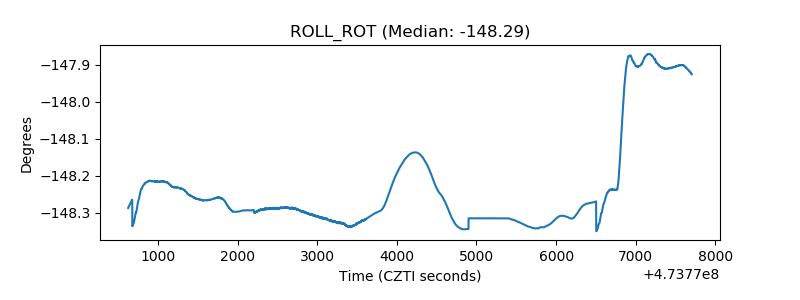 |
| _Roll_DEC | 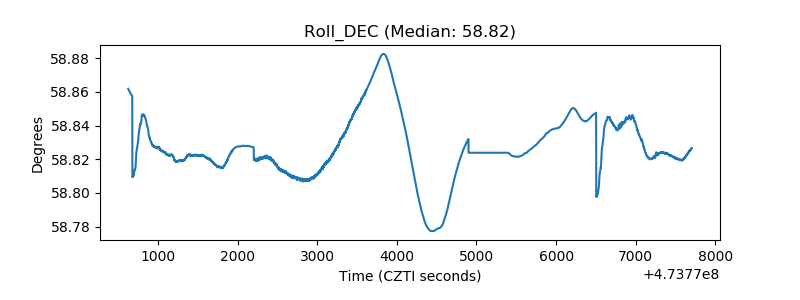 |
| _Roll_RA | 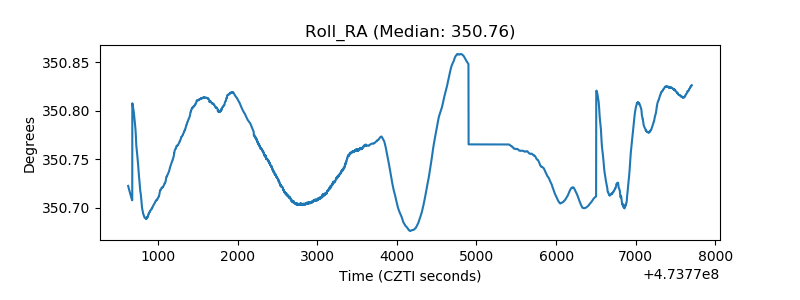 |
| Veto Counter | 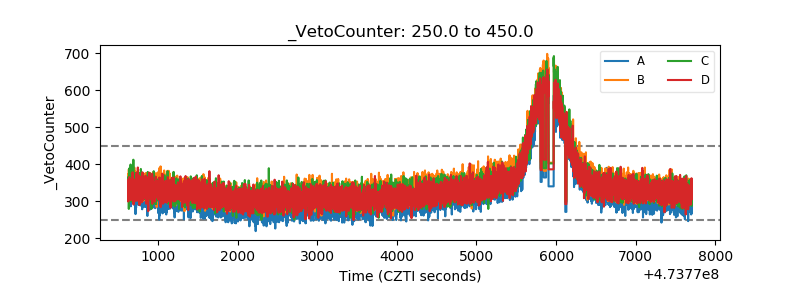 |