| Param | Original file | Final file |
|---|---|---|
| Filename | modeM0/AS1C09_003T01_9000006442_50339cztM0_level2.fits | modeM0/AS1C09_003T01_9000006442_50339cztM0_level2_quad_clean.evt |
| Size (bytes) | 1,128,248,640 | 77,258,880 |
| Size | 1.1 GB | 73.7 MB |
| Events in quadrant A | 5,092,434 | 660,531 |
| Events in quadrant B | 4,854,148 | 715,734 |
| Events in quadrant C | 15,478,600 | 383,414 |
| Events in quadrant D | 15,778,412 | 69,293 |
| Mode M0 | |||
|---|---|---|---|
| Quadrant | BADHDUFLAG | Total packets | Discarded packets |
| A | 0 | 19973 | 0 |
| B | 0 | 19287 | 0 |
| C | 0 | 50970 | 0 |
| D | 0 | 51798 | 0 |
| Mode SS | |||
|---|---|---|---|
| Quadrant | BADHDUFLAG | Total packets | Discarded packets |
| A | 0 | 144 | 0 |
| B | 0 | 144 | 0 |
| C | 0 | 144 | 0 |
| D | 0 | 144 | 0 |
| Quadrant | Total seconds | Saturated seconds | Saturation percentage |
|---|---|---|---|
| A | 7241 | 318 | 4.391659% |
| B | 7241 | 413 | 5.703632% |
| C | 7241 | 5216 | 72.034249% |
| D | 7240 | 7240 | 100.000000% |
Noise dominated data is calculated using 1-second bins in cleaned event files. If a bin has >2000 counts, and if more than 50% of those come from <1% of pixels, then it is considered to be noise-dominated and hence unusable.
| Quadrant | # 1 sec bins | Bins with >0 counts | Bins with >2000 counts | High rate bins dominated by noise | Noise dominated (total time) | Noise dominated (detector-on time) | Marked lightcurve |
|---|---|---|---|---|---|---|---|
| A | 7240 | 7240 | 220 | 220 | 3.04% | 3.04% | 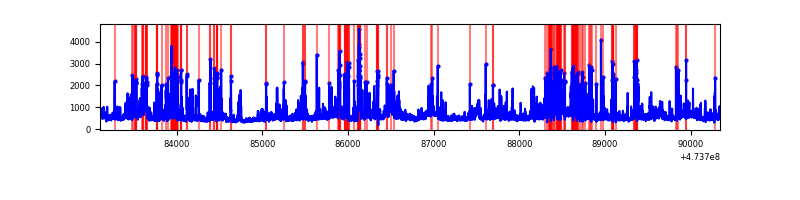 |
| B | 7240 | 7240 | 337 | 337 | 4.65% | 4.65% | 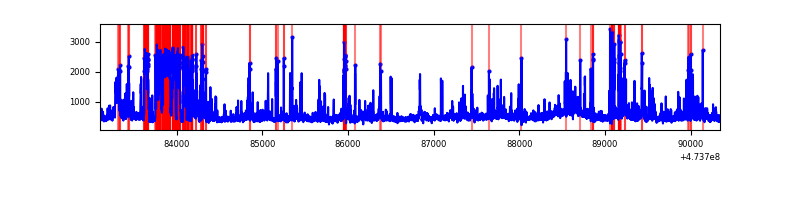 |
| C | 7240 | 7240 | 4755 | 4755 | 65.68% | 65.68% | 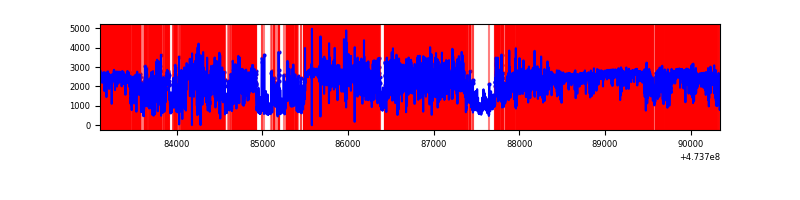 |
| D | 7238 | 7236 | 5477 | 5477 | 75.67% | 75.69% | 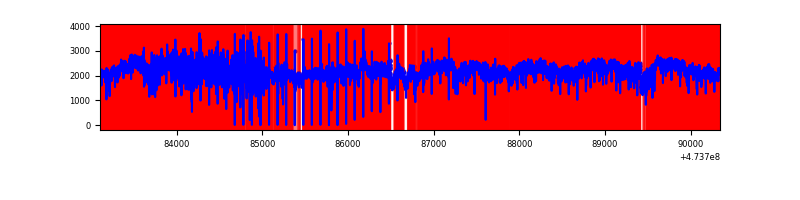 |
Top three noisy pixels from each quadrant. If the there are fewer than three noisy pixels in the level2.evt file, extra rows are filled as -1
| Pixel properties | Quadrant properties | ||||||
|---|---|---|---|---|---|---|---|
| Quadrant | DetID | PixID | Counts | Sigma | Mean | Median | Sigma |
| A | 8 | 248 | 408014 | 2172.27 | 750 | 729 | 187.5 |
| A | 3 | 231 | 323802 | 1723.12 | 750 | 729 | 187.5 |
| A | 3 | 130 | 250829 | 1333.92 | 750 | 729 | 187.5 |
| B | 12 | 0 | 724566 | 4545.27 | 748 | 723 | 159.3 |
| B | 9 | 218 | 163804 | 1024.04 | 748 | 723 | 159.3 |
| B | 8 | 128 | 116272 | 725.57 | 748 | 723 | 159.3 |
| C | 15 | 127 | 4622507 | 35825.36 | 457 | 453 | 129.0 |
| C | 15 | 196 | 1679607 | 13015.06 | 457 | 453 | 129.0 |
| C | 0 | 209 | 1548718 | 12000.54 | 457 | 453 | 129.0 |
| D | 7 | 61 | 12544688 | 338914.13 | 102 | 96 | 37.0 |
| D | 12 | 1 | 440515 | 11898.69 | 102 | 96 | 37.0 |
| D | 12 | 6 | 295187 | 7972.4 | 102 | 96 | 37.0 |
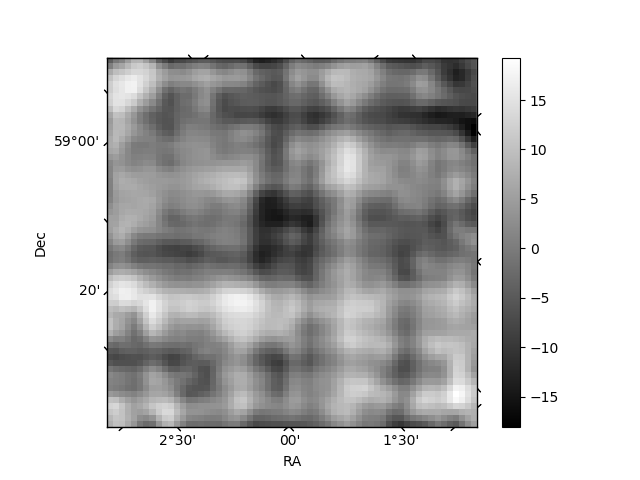
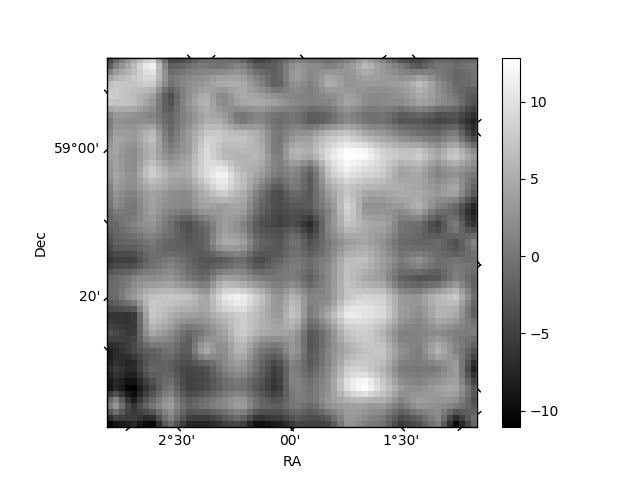
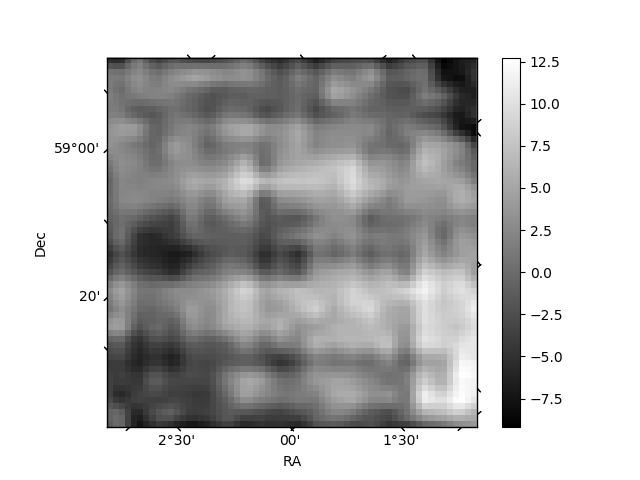
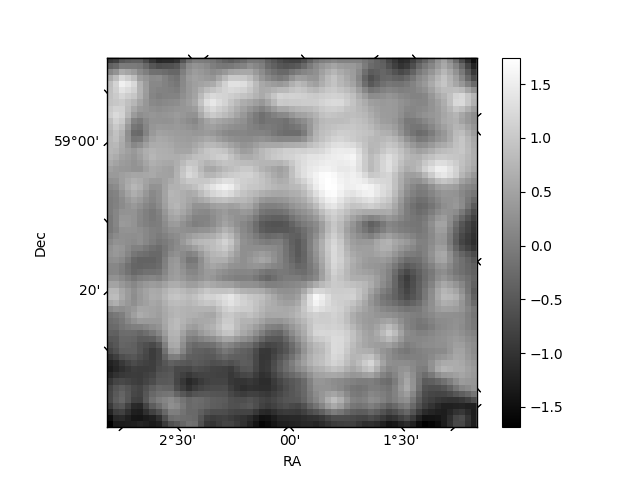
Histogram calculated using DETX and DETY for each event in the final _common_clean file
| Quadrant A | 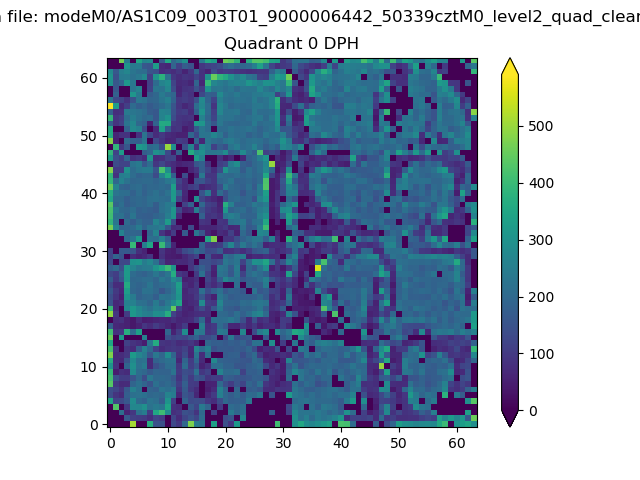 |
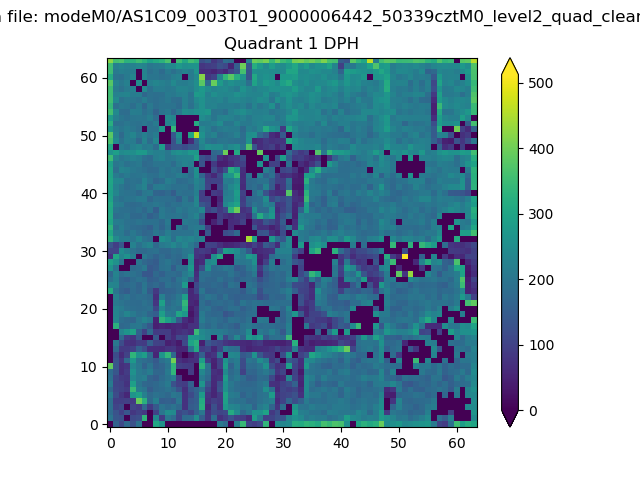 |
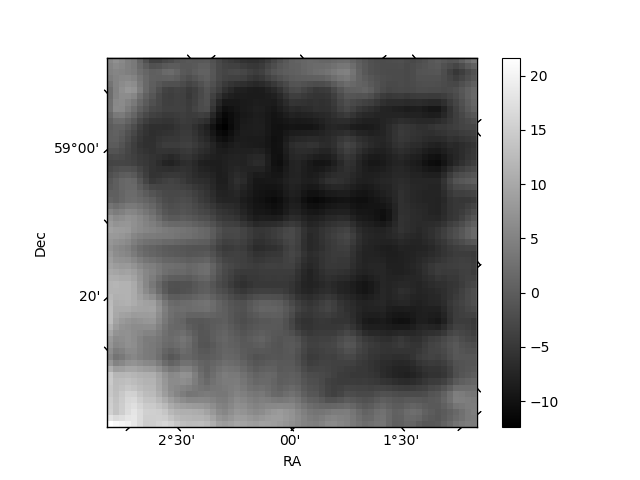
Quadrant B |
|---|---|---|---|
| Quadrant D | 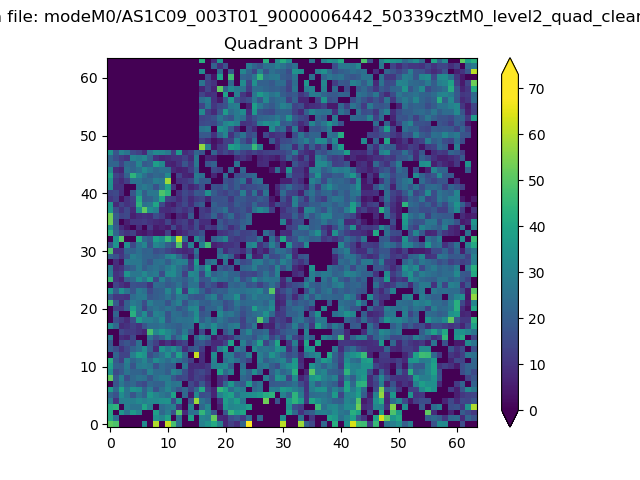 |
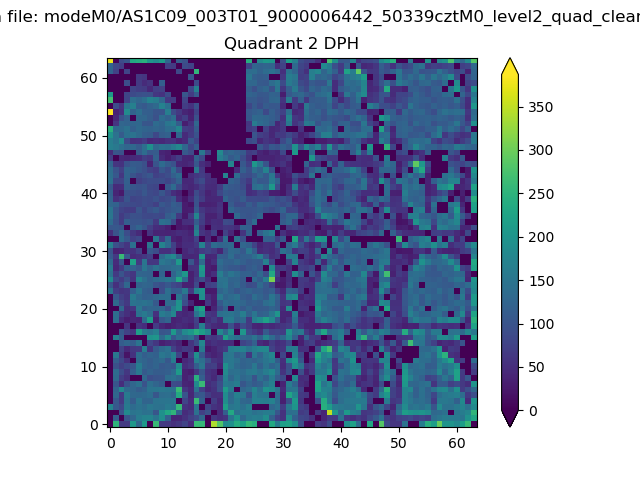 |
Quadrant C |
| Plot type | Count rate plots | Images |
|---|---|---|
| Comparison with Poisson distribution Blue bars denote a histogram of data divided into 1 sec bins. Red curve is a Poisson curve with rate = median count rate of data. |
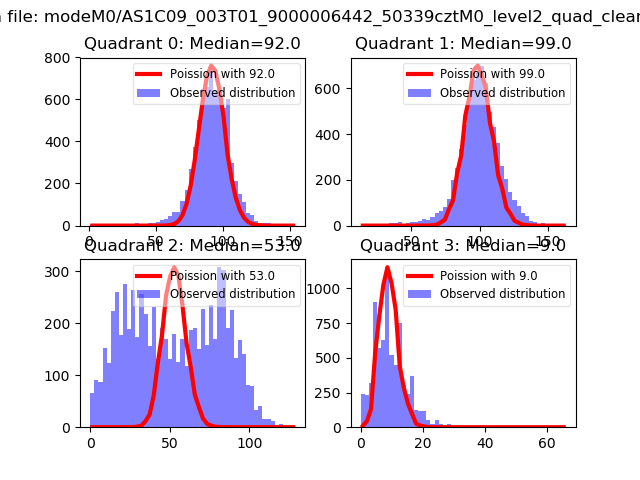 |
 |
| Quadrant-wise count rates Data is divided into 100 sec bins |
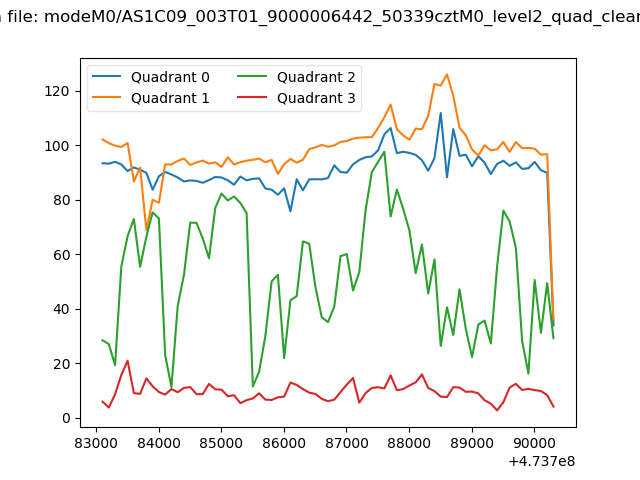 |
|
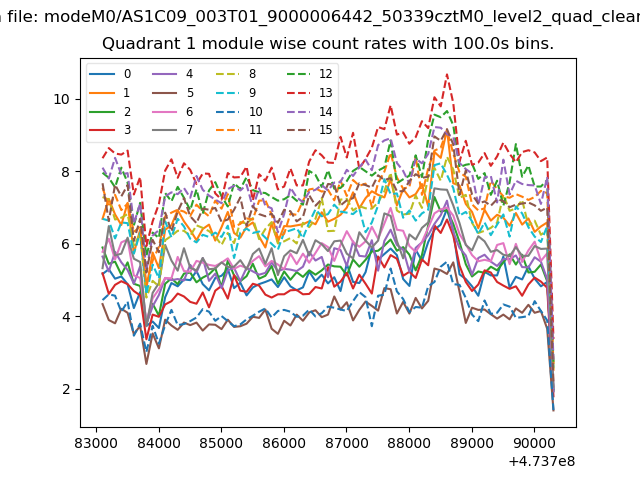
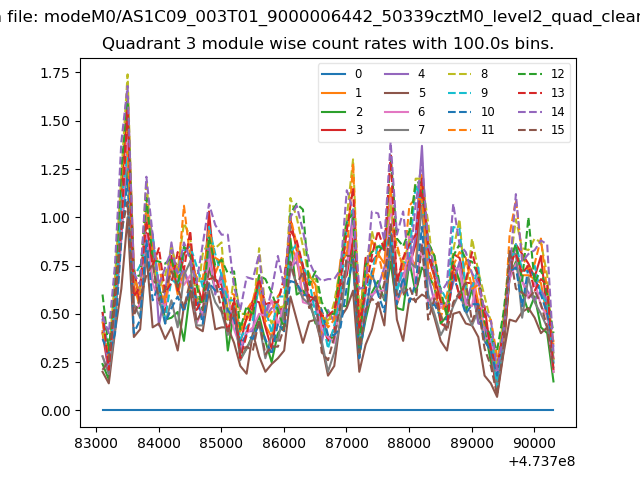
| Module-wise count rates for Quadrant A Data is divided into 100 sec bins |
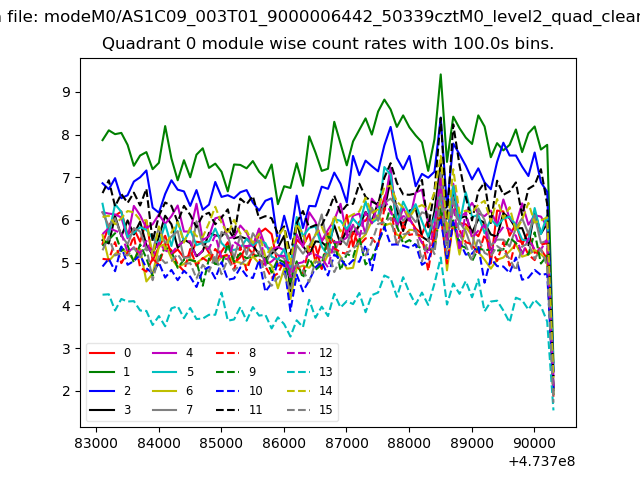 |
 |
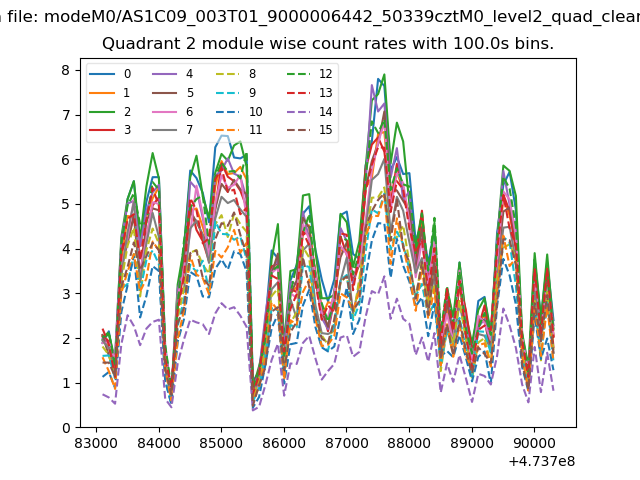
| Module-wise count rates for Quadrant B Data is divided into 100 sec bins |
 |
 |
| Module-wise count rates for Quadrant C Data is divided into 100 sec bins |
 |
 |
| Module-wise count rates for Quadrant D Data is divided into 100 sec bins |
 |
 |
| Parameter | Plot |
|---|---|
| CZT HV Monitor | 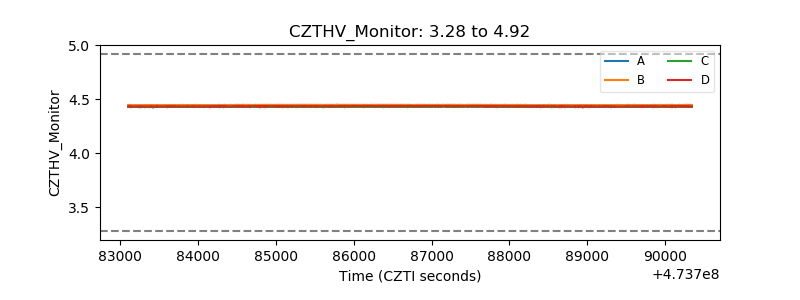 |
| D_VDD | 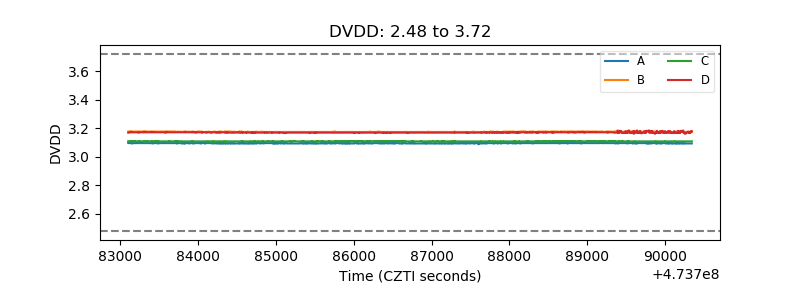 |
| Temperature 1 | 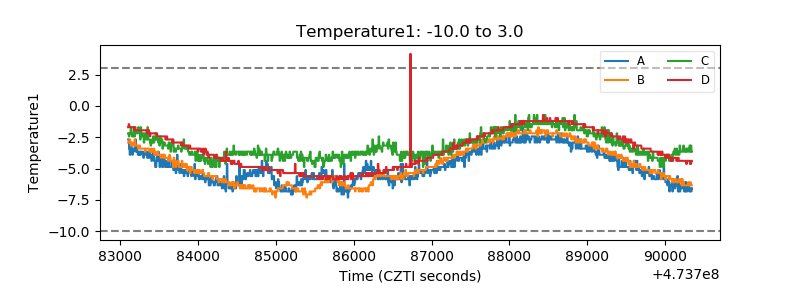 |
| Veto HV Monitor |  |
| Veto LLD | 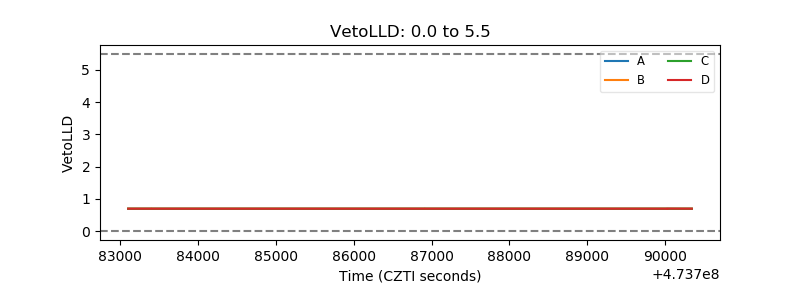 |
| Alpha Counter | 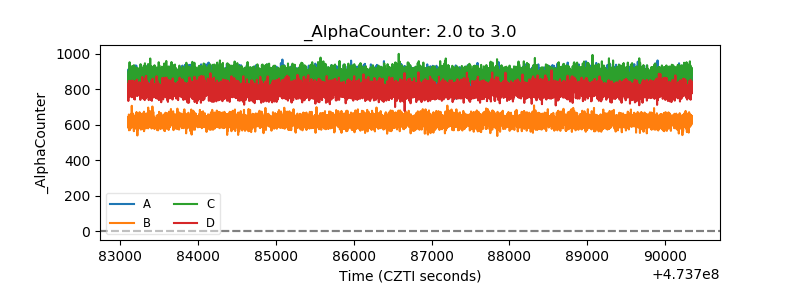 |
| _CPM_Rate | 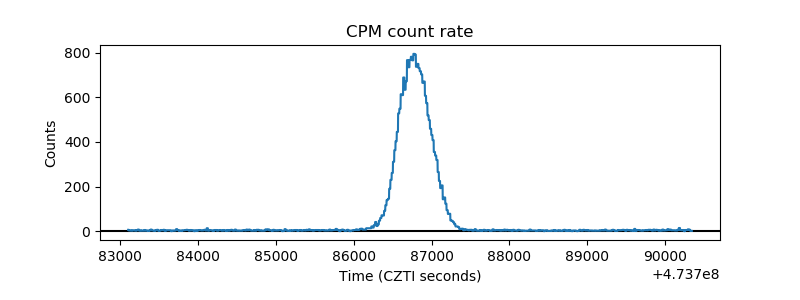 |
| CZT Counter | 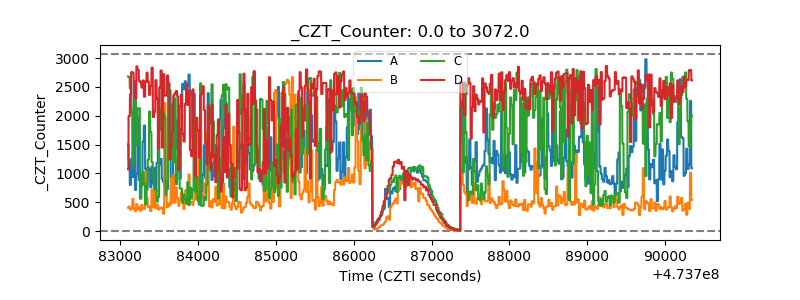 |
| +2.5 Volts monitor | 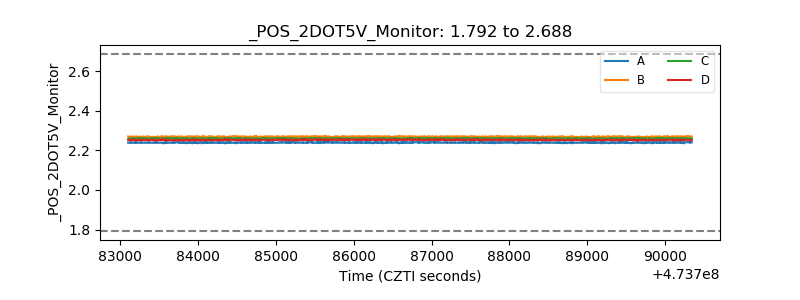 |
| +5 Volts monitor |  |
| _ROLL_ROT | 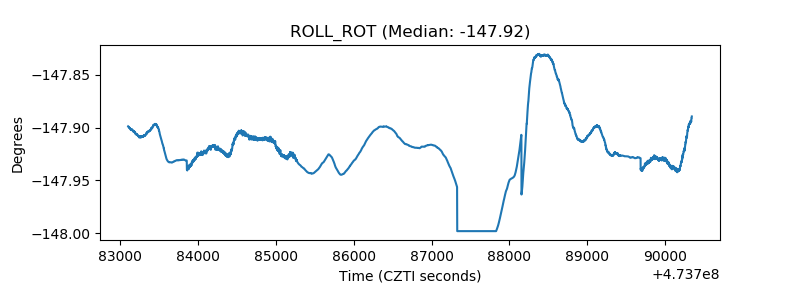 |
| _Roll_DEC | 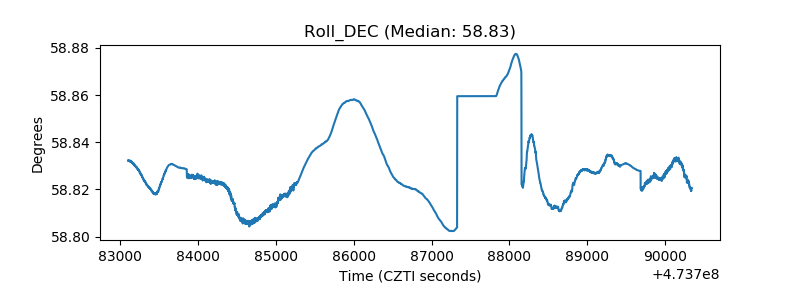 |
| _Roll_RA | 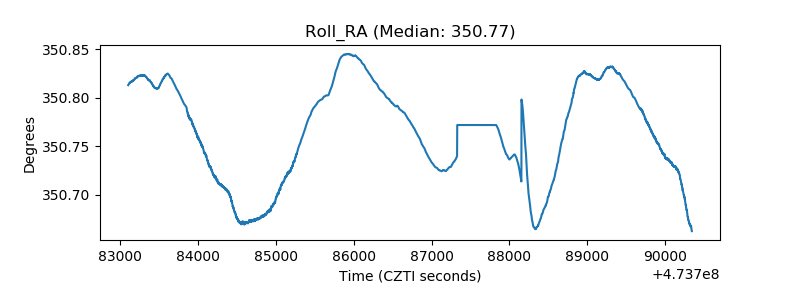 |
| Veto Counter | 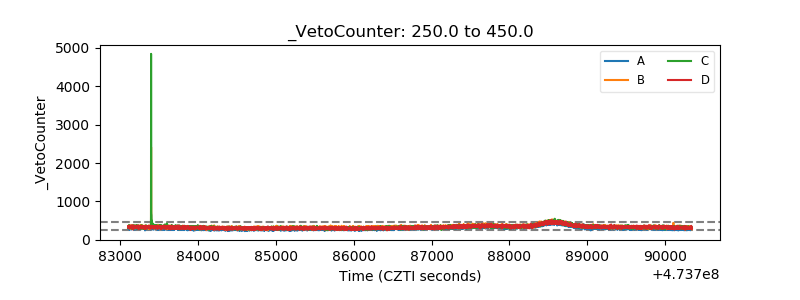 |