| Param | Original file | Final file |
|---|---|---|
| Filename | modeM0/AS1C09_003T01_9000006442_50343cztM0_level2.fits | modeM0/AS1C09_003T01_9000006442_50343cztM0_level2_quad_clean.evt |
| Size (bytes) | 852,347,520 | 83,617,920 |
| Size | 812.9 MB | 79.7 MB |
| Events in quadrant A | 4,563,068 | 614,464 |
| Events in quadrant B | 4,648,744 | 660,474 |
| Events in quadrant C | 8,913,108 | 463,421 |
| Events in quadrant D | 12,899,327 | 317,819 |
| Mode M9 | |||
|---|---|---|---|
| Quadrant | BADHDUFLAG | Total packets | Discarded packets |
| A | 0 | 8 | 0 |
| B | 0 | 8 | 0 |
| C | 0 | 8 | 0 |
| D | 0 | 8 | 0 |
| Mode M0 | |||
|---|---|---|---|
| Quadrant | BADHDUFLAG | Total packets | Discarded packets |
| A | 0 | 18181 | 1 |
| B | 0 | 18440 | 2 |
| C | 0 | 31145 | 1 |
| D | 0 | 43081 | 1 |
| Mode SS | |||
|---|---|---|---|
| Quadrant | BADHDUFLAG | Total packets | Discarded packets |
| A | 0 | 138 | 0 |
| B | 0 | 138 | 0 |
| C | 0 | 138 | 0 |
| D | 0 | 138 | 0 |
| Quadrant | Total seconds | Saturated seconds | Saturation percentage |
|---|---|---|---|
| A | 6821 | 242 | 3.547867% |
| B | 6821 | 333 | 4.881982% |
| C | 6821 | 1841 | 26.990177% |
| D | 6821 | 3378 | 49.523530% |
Noise dominated data is calculated using 1-second bins in cleaned event files. If a bin has >2000 counts, and if more than 50% of those come from <1% of pixels, then it is considered to be noise-dominated and hence unusable.
| Quadrant | # 1 sec bins | Bins with >0 counts | Bins with >2000 counts | High rate bins dominated by noise | Noise dominated (total time) | Noise dominated (detector-on time) | Marked lightcurve |
|---|---|---|---|---|---|---|---|
| A | 7671 | 6821 | 181 | 181 | 2.36% | 2.65% | 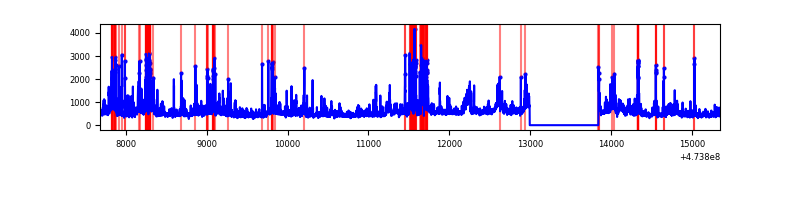 |
| B | 7671 | 6821 | 237 | 237 | 3.09% | 3.47% | 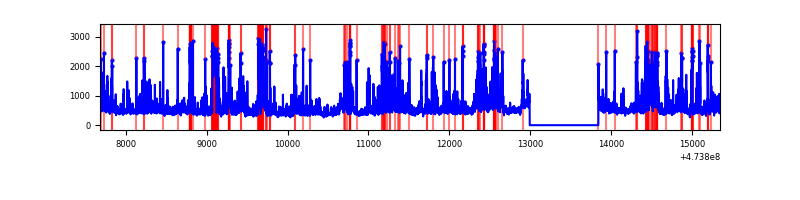 |
| C | 7671 | 6821 | 1820 | 1820 | 23.73% | 26.68% | 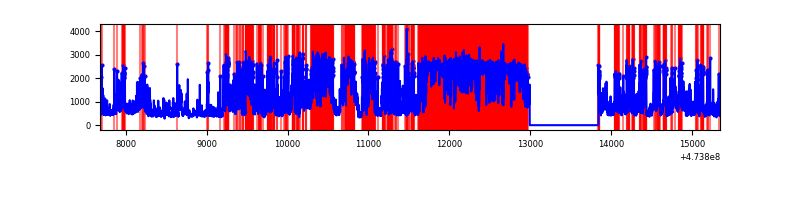 |
| D | 7671 | 6821 | 3600 | 3600 | 46.93% | 52.78% | 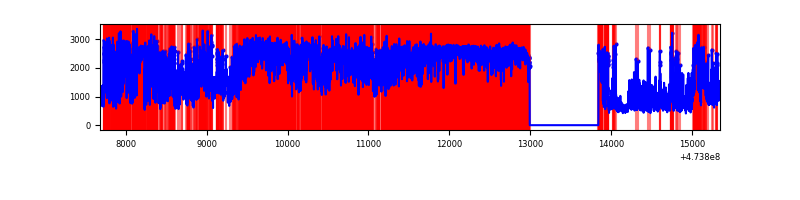 |
Top three noisy pixels from each quadrant. If the there are fewer than three noisy pixels in the level2.evt file, extra rows are filled as -1
| Pixel properties | Quadrant properties | ||||||
|---|---|---|---|---|---|---|---|
| Quadrant | DetID | PixID | Counts | Sigma | Mean | Median | Sigma |
| A | 3 | 231 | 332194 | 1838.58 | 712 | 694 | 180.3 |
| A | 4 | 3 | 243433 | 1346.29 | 712 | 694 | 180.3 |
| A | 13 | 248 | 167763 | 926.61 | 712 | 694 | 180.3 |
| B | 0 | 200 | 376882 | 2483.75 | 708 | 684 | 151.5 |
| B | 1 | 238 | 355769 | 2344.36 | 708 | 684 | 151.5 |
| B | 10 | 44 | 318204 | 2096.34 | 708 | 684 | 151.5 |
| C | 0 | 208 | 4133757 | 24408.6 | 615 | 613 | 169.3 |
| C | 15 | 232 | 421605 | 2486.2 | 615 | 613 | 169.3 |
| C | 1 | 60 | 369571 | 2178.91 | 615 | 613 | 169.3 |
| D | 7 | 61 | 5578361 | 35352.36 | 550 | 530 | 157.8 |
| D | 11 | 245 | 1349592 | 8550.37 | 550 | 530 | 157.8 |
| D | 12 | 6 | 468083 | 2963.36 | 550 | 530 | 157.8 |
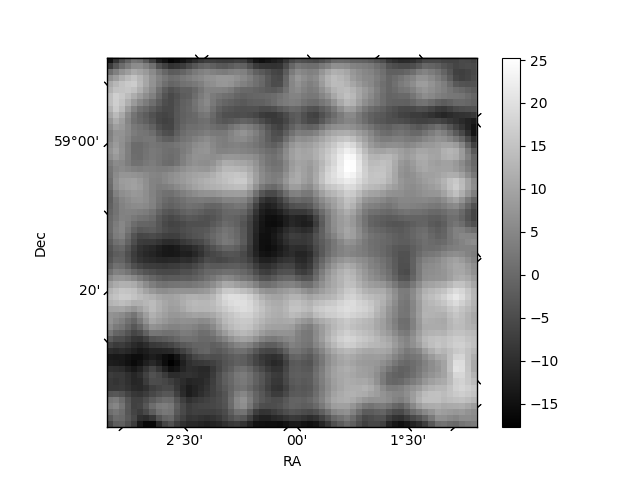
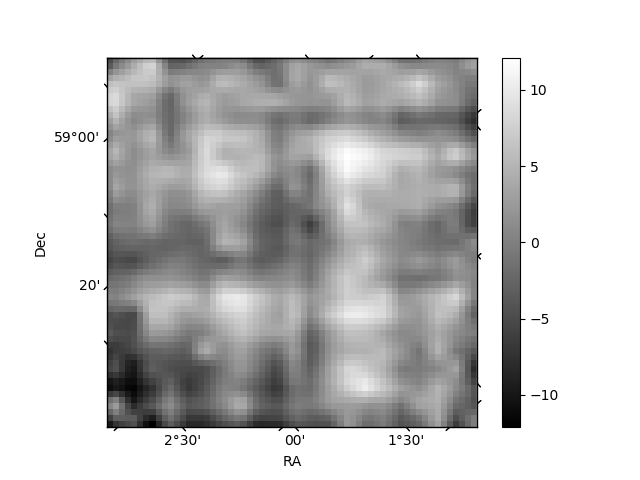
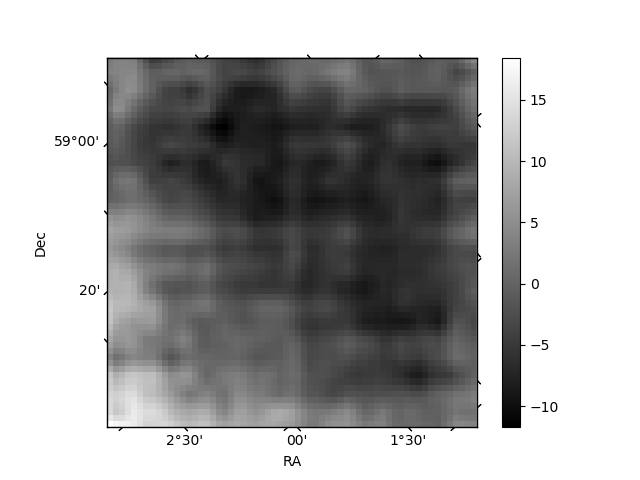
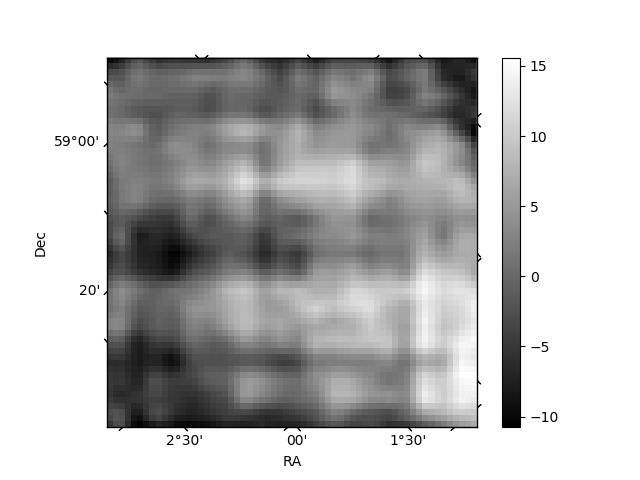
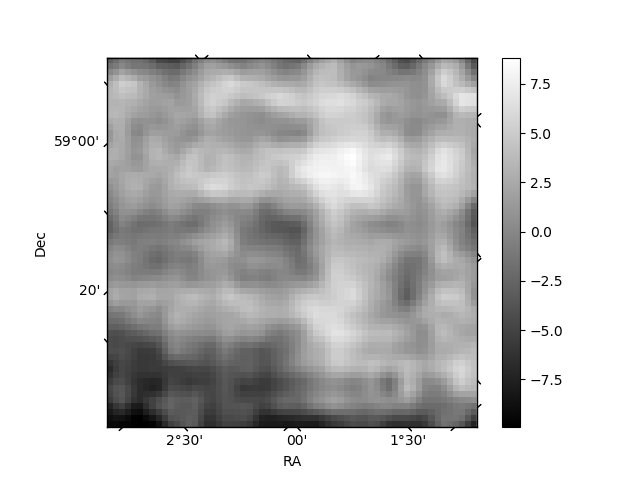
Histogram calculated using DETX and DETY for each event in the final _common_clean file
| Quadrant A | 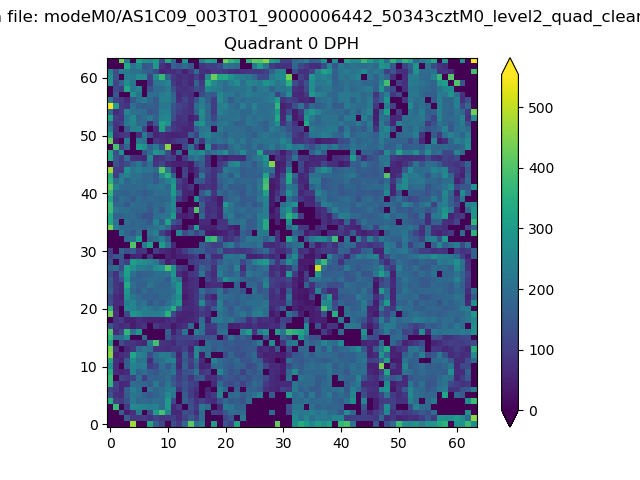 |
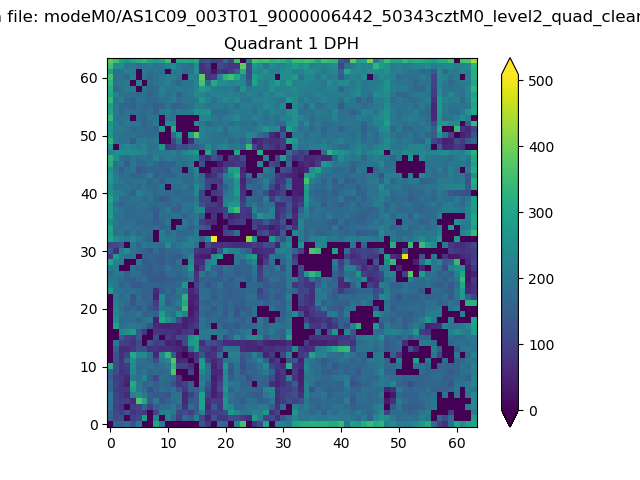 |
Quadrant B |
|---|---|---|---|
| Quadrant D | 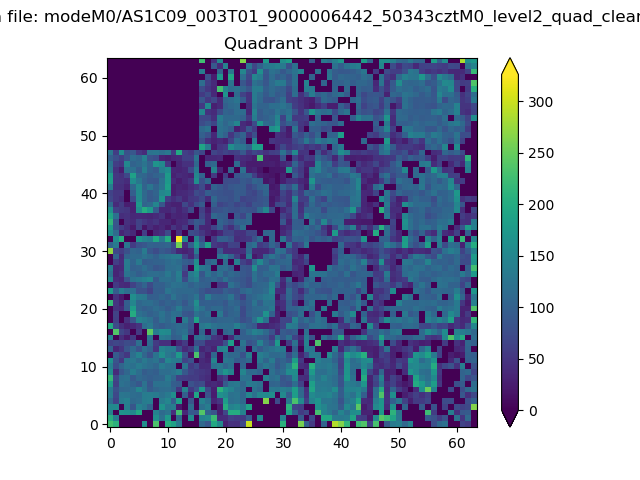 |
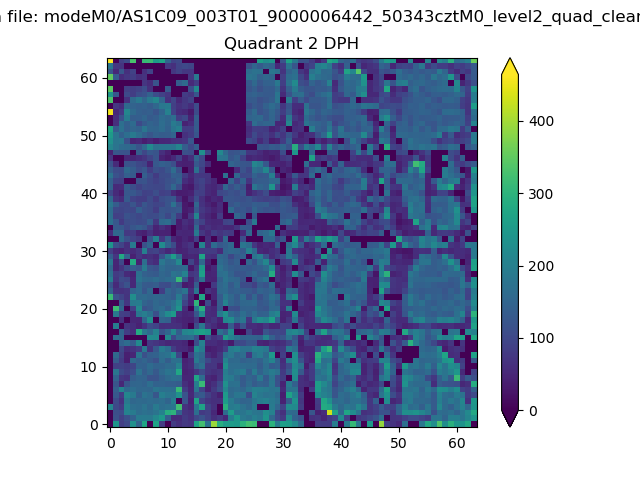 |
Quadrant C |
| Plot type | Count rate plots | Images |
|---|---|---|
| Comparison with Poisson distribution Blue bars denote a histogram of data divided into 1 sec bins. Red curve is a Poisson curve with rate = median count rate of data. |
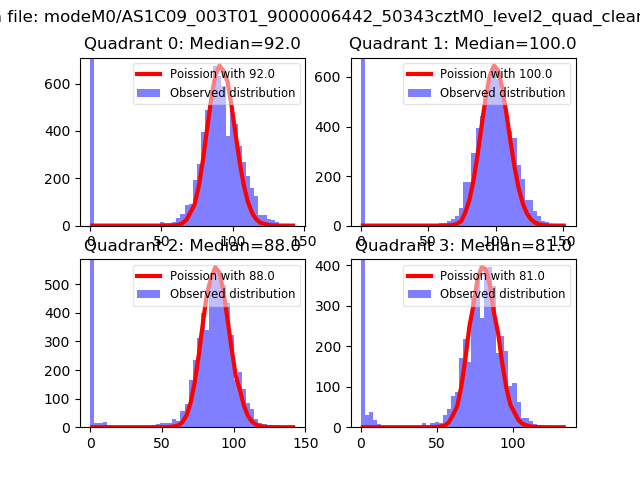 |
 |
| Quadrant-wise count rates Data is divided into 100 sec bins |
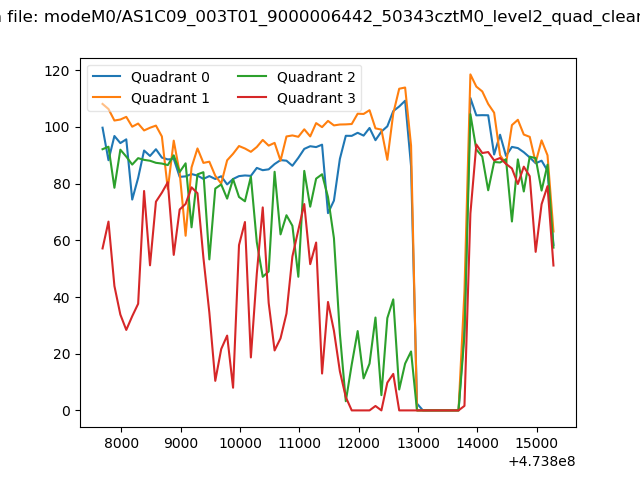 |
|
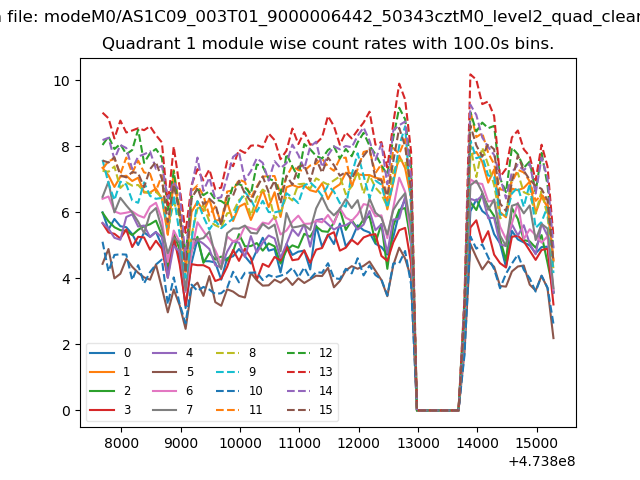
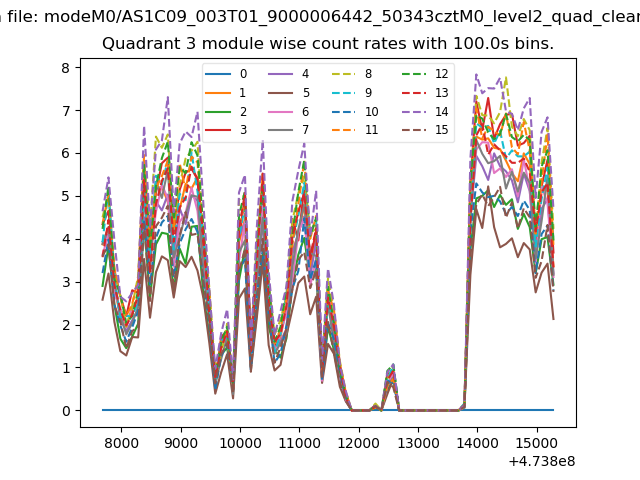
| Module-wise count rates for Quadrant A Data is divided into 100 sec bins |
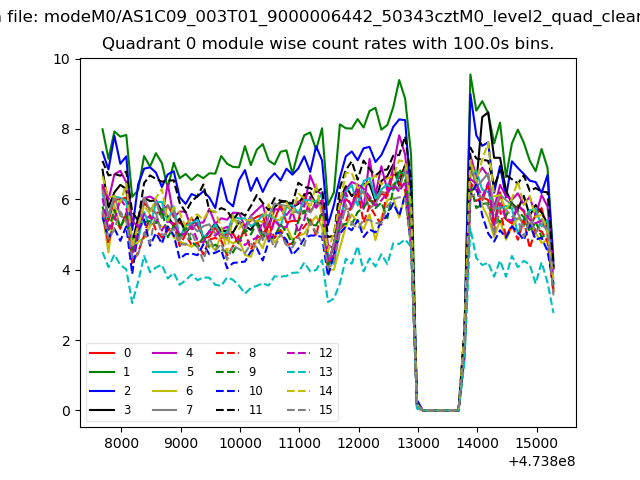 |
 |
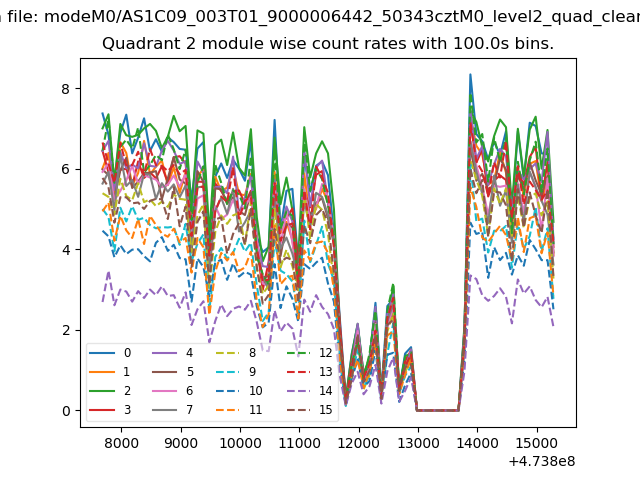
| Module-wise count rates for Quadrant B Data is divided into 100 sec bins |
 |
 |
| Module-wise count rates for Quadrant C Data is divided into 100 sec bins |
 |
 |
| Module-wise count rates for Quadrant D Data is divided into 100 sec bins |
 |
 |
| Parameter | Plot |
|---|---|
| CZT HV Monitor | 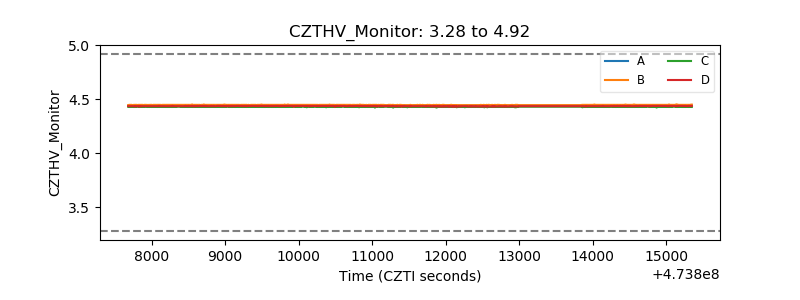 |
| D_VDD | 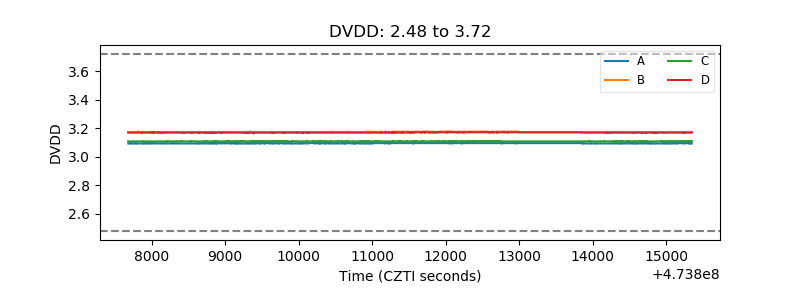 |
| Temperature 1 | 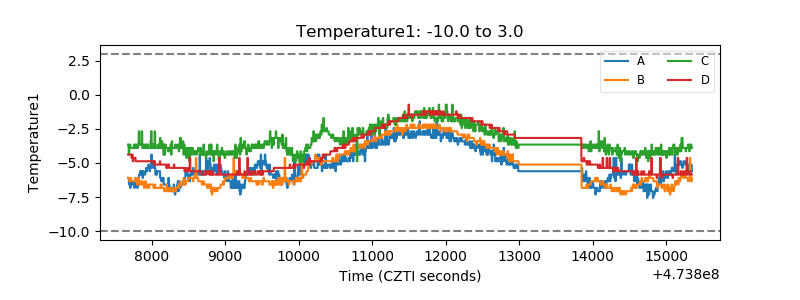 |
| Veto HV Monitor | 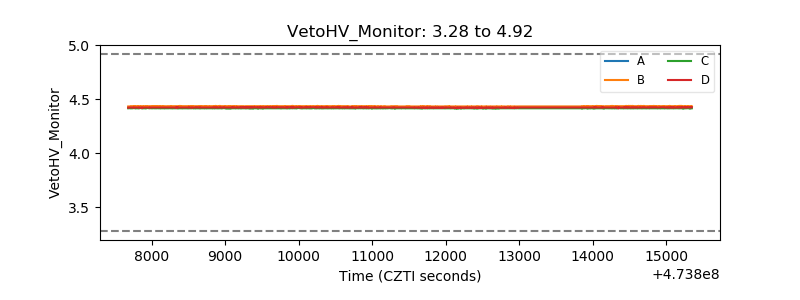 |
| Veto LLD | 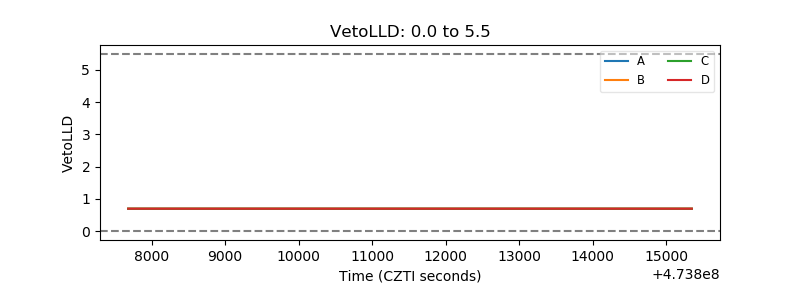 |
| Alpha Counter | 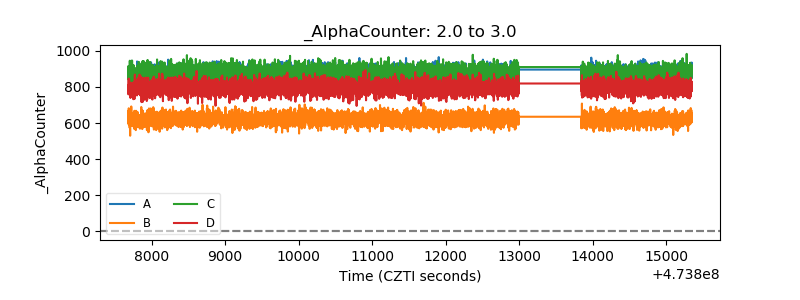 |
| _CPM_Rate | 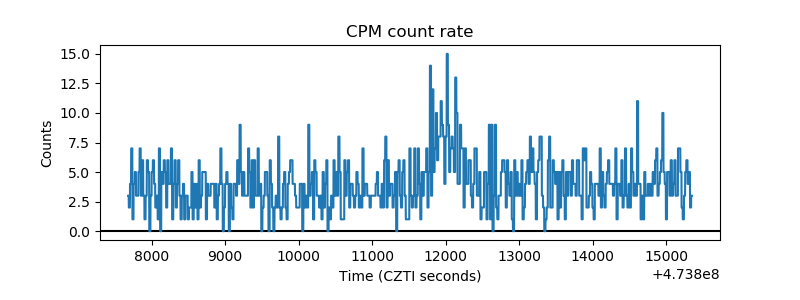 |
| CZT Counter | 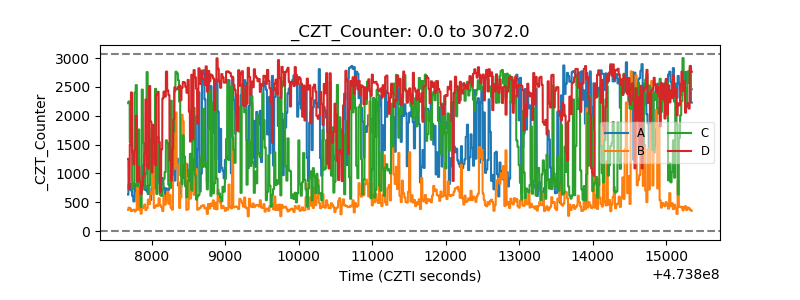 |
| +2.5 Volts monitor |  |
| +5 Volts monitor | 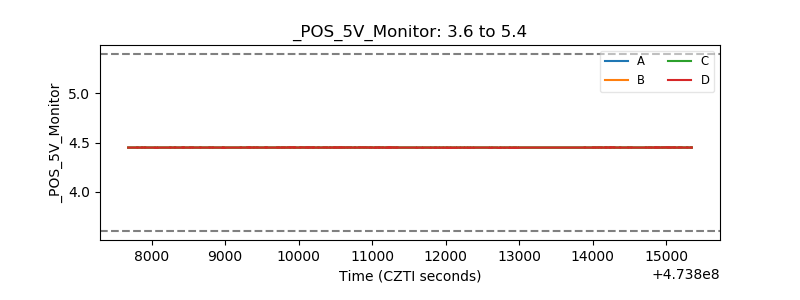 |
| _ROLL_ROT | 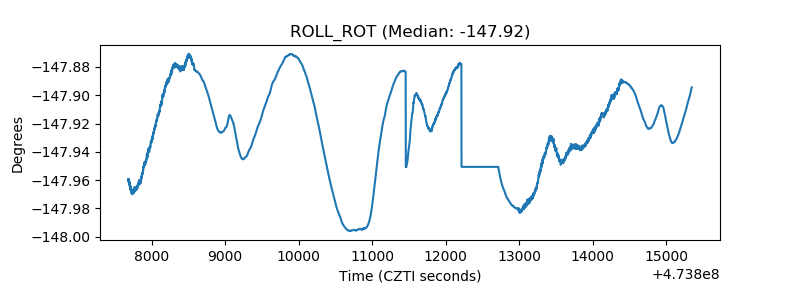 |
| _Roll_DEC | 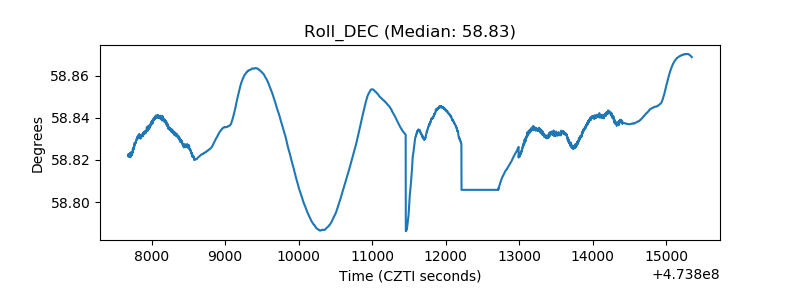 |
| _Roll_RA | 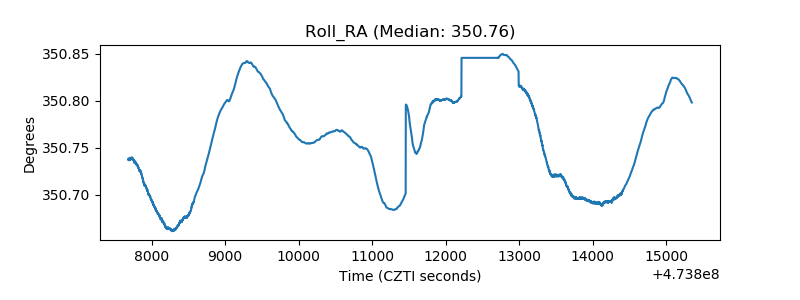 |
| Veto Counter | 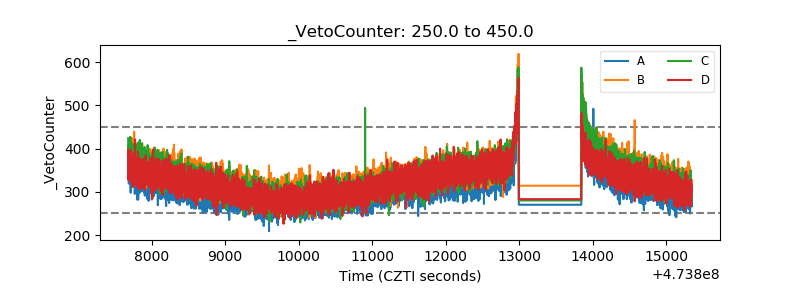 |