| Param | Original file | Final file |
|---|---|---|
| Filename | modeM0/AS1C09_003T01_9000006442_50346cztM0_level2.fits | modeM0/AS1C09_003T01_9000006442_50346cztM0_level2_quad_clean.evt |
| Size (bytes) | 791,622,720 | 83,344,320 |
| Size | 755.0 MB | 79.5 MB |
| Events in quadrant A | 4,401,483 | 616,793 |
| Events in quadrant B | 5,523,416 | 625,812 |
| Events in quadrant C | 8,263,235 | 454,489 |
| Events in quadrant D | 10,611,523 | 371,868 |
| Mode M9 | |||
|---|---|---|---|
| Quadrant | BADHDUFLAG | Total packets | Discarded packets |
| A | 0 | 11 | 0 |
| B | 0 | 11 | 0 |
| C | 0 | 11 | 0 |
| D | 0 | 11 | 0 |
| Mode M0 | |||
|---|---|---|---|
| Quadrant | BADHDUFLAG | Total packets | Discarded packets |
| A | 0 | 17401 | 1 |
| B | 0 | 20835 | 1 |
| C | 0 | 28921 | 1 |
| D | 0 | 35998 | 8 |
| Mode SS | |||
|---|---|---|---|
| Quadrant | BADHDUFLAG | Total packets | Discarded packets |
| A | 0 | 132 | 0 |
| B | 0 | 132 | 0 |
| C | 0 | 132 | 0 |
| D | 0 | 132 | 0 |
| Quadrant | Total seconds | Saturated seconds | Saturation percentage |
|---|---|---|---|
| A | 6515 | 144 | 2.210284% |
| B | 6516 | 691 | 10.604665% |
| C | 6516 | 1836 | 28.176796% |
| D | 6515 | 2466 | 37.851113% |
Noise dominated data is calculated using 1-second bins in cleaned event files. If a bin has >2000 counts, and if more than 50% of those come from <1% of pixels, then it is considered to be noise-dominated and hence unusable.
| Quadrant | # 1 sec bins | Bins with >0 counts | Bins with >2000 counts | High rate bins dominated by noise | Noise dominated (total time) | Noise dominated (detector-on time) | Marked lightcurve |
|---|---|---|---|---|---|---|---|
| A | 7595 | 6515 | 84 | 84 | 1.11% | 1.29% | 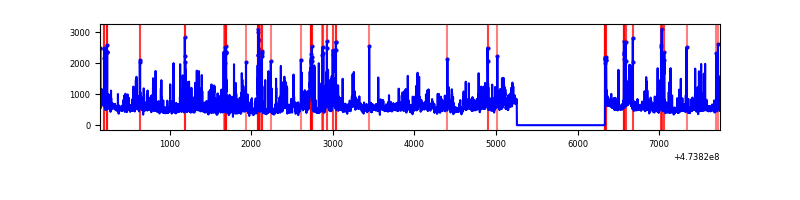 |
| B | 7596 | 6516 | 570 | 570 | 7.50% | 8.75% | 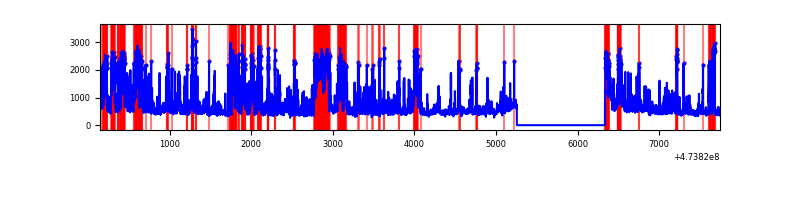 |
| C | 7595 | 6515 | 1816 | 1816 | 23.91% | 27.87% | 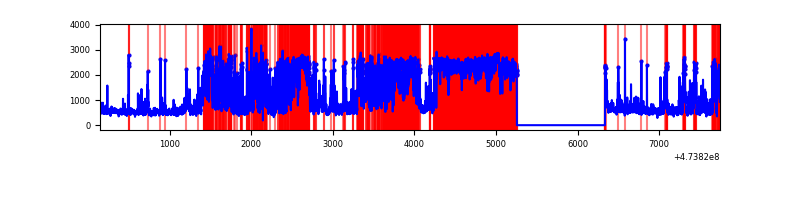 |
| D | 7595 | 6515 | 2658 | 2658 | 35.00% | 40.80% | 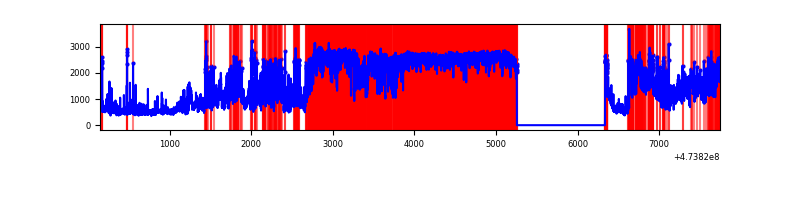 |
Top three noisy pixels from each quadrant. If the there are fewer than three noisy pixels in the level2.evt file, extra rows are filled as -1
| Pixel properties | Quadrant properties | ||||||
|---|---|---|---|---|---|---|---|
| Quadrant | DetID | PixID | Counts | Sigma | Mean | Median | Sigma |
| A | 4 | 3 | 414673 | 2372.04 | 702 | 686 | 174.5 |
| A | 3 | 231 | 321025 | 1835.46 | 702 | 686 | 174.5 |
| A | 12 | 250 | 153337 | 874.65 | 702 | 686 | 174.5 |
| B | 1 | 238 | 1176561 | 8202.2 | 673 | 651 | 143.4 |
| B | 10 | 44 | 573477 | 3995.57 | 673 | 651 | 143.4 |
| B | 4 | 216 | 274447 | 1909.78 | 673 | 651 | 143.4 |
| C | 0 | 208 | 3352872 | 20595.31 | 571 | 567 | 162.8 |
| C | 13 | 3 | 314063 | 1926.0 | 571 | 567 | 162.8 |
| C | 0 | 225 | 293653 | 1800.61 | 571 | 567 | 162.8 |
| D | 7 | 61 | 4826900 | 31693.75 | 534 | 515 | 152.3 |
| D | 12 | 6 | 1025488 | 6730.76 | 534 | 515 | 152.3 |
| D | 2 | 165 | 858889 | 5636.74 | 534 | 515 | 152.3 |
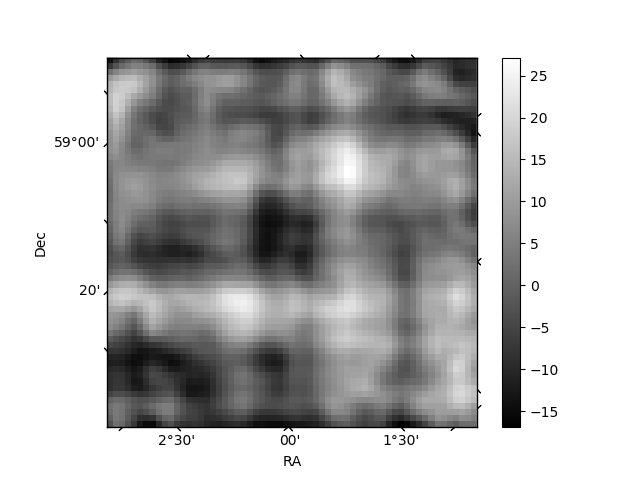
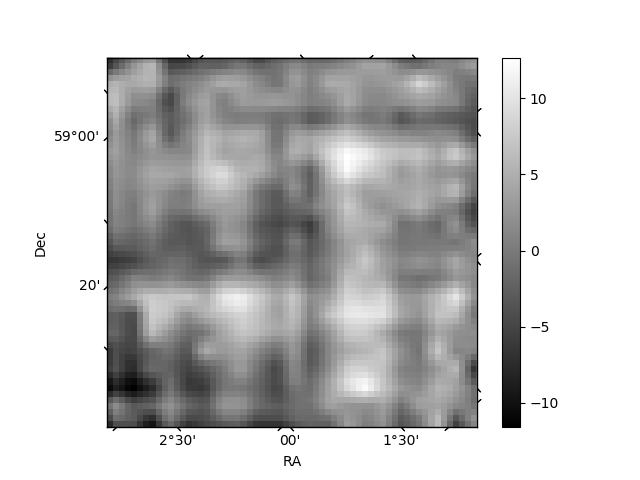
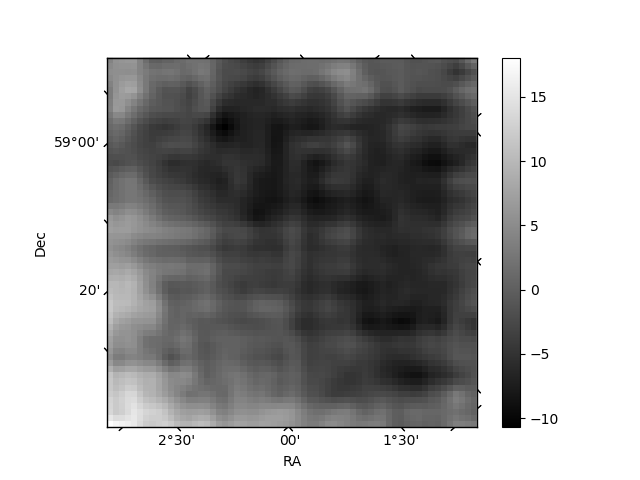
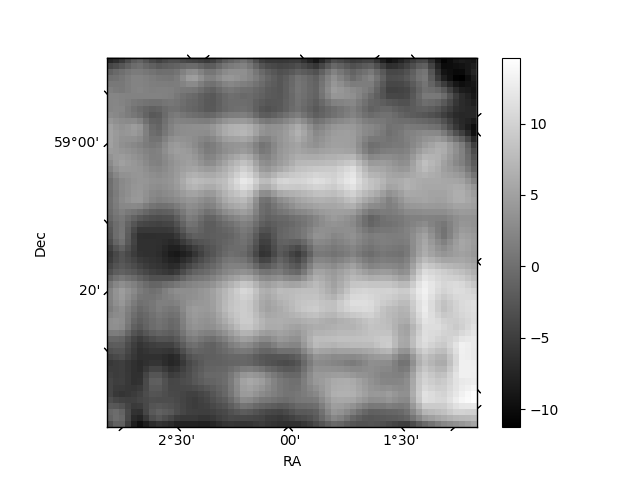
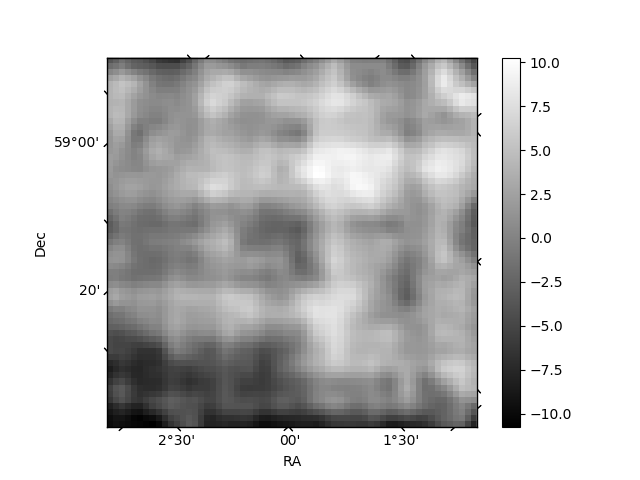
Histogram calculated using DETX and DETY for each event in the final _common_clean file
| Quadrant A | 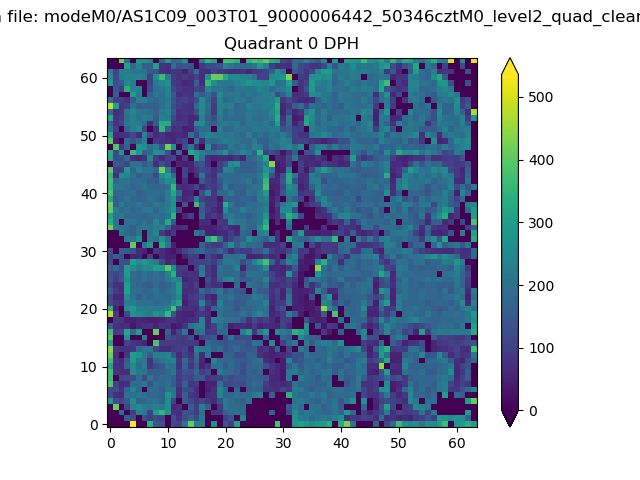 |
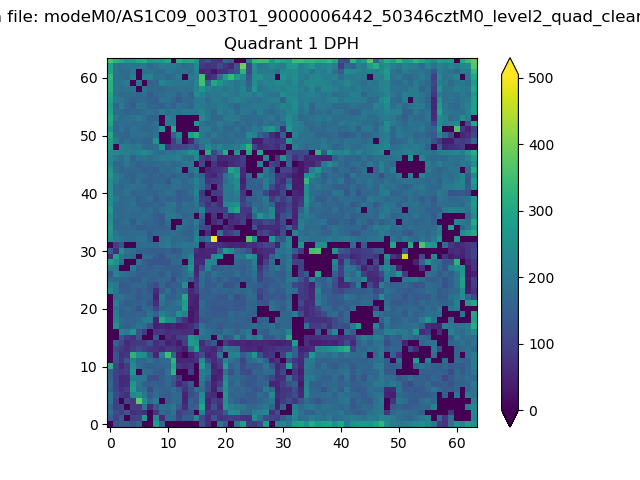 |
Quadrant B |
|---|---|---|---|
| Quadrant D |  |
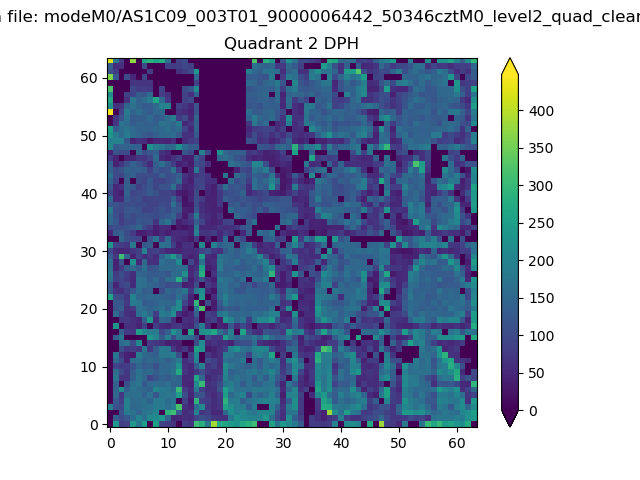 |
Quadrant C |
| Plot type | Count rate plots | Images |
|---|---|---|
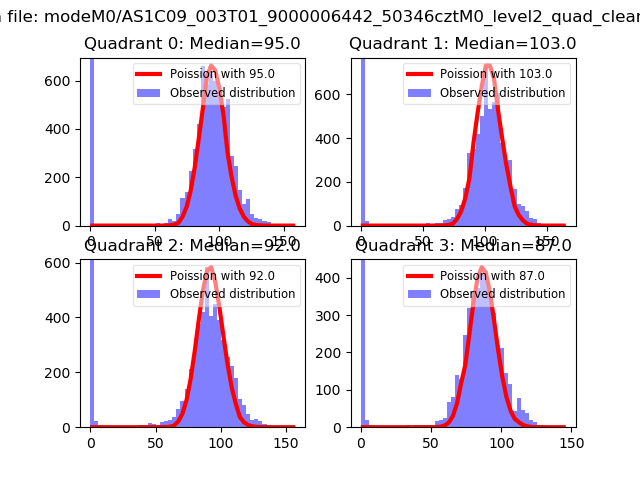
| Comparison with Poisson distribution Blue bars denote a histogram of data divided into 1 sec bins. Red curve is a Poisson curve with rate = median count rate of data. |
 |
 |
| Quadrant-wise count rates Data is divided into 100 sec bins |
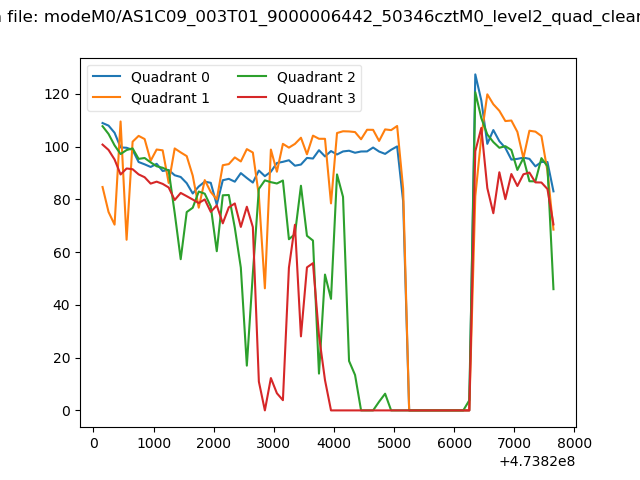 |
|
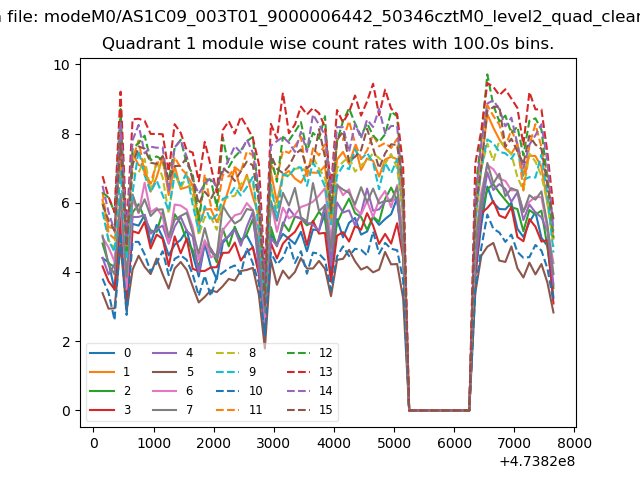
| Module-wise count rates for Quadrant A Data is divided into 100 sec bins |
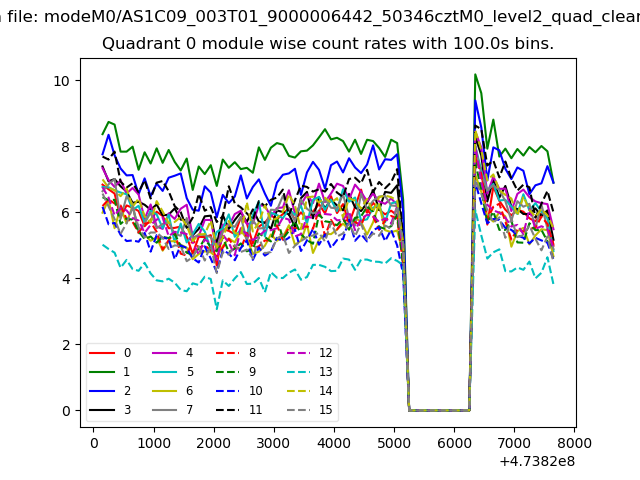 |
 |
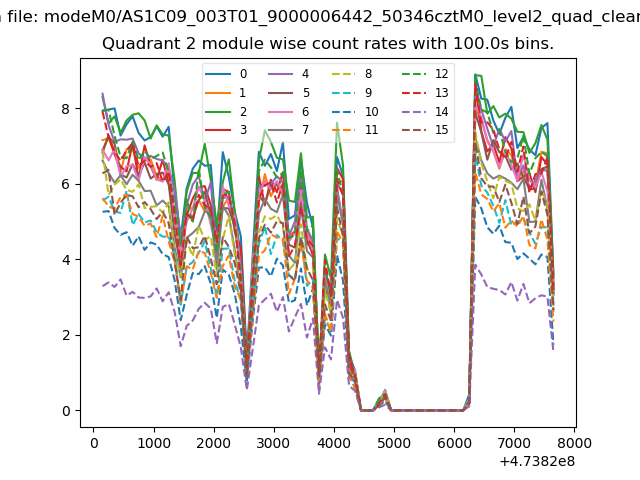
| Module-wise count rates for Quadrant B Data is divided into 100 sec bins |
 |
 |
| Module-wise count rates for Quadrant C Data is divided into 100 sec bins |
 |
 |
| Module-wise count rates for Quadrant D Data is divided into 100 sec bins |
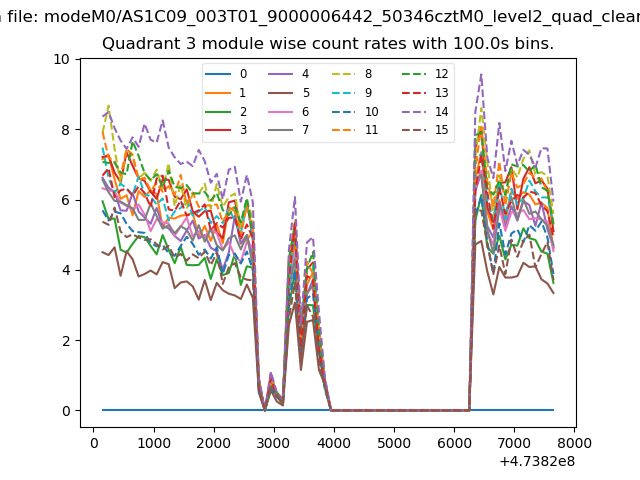 |
 |
| Parameter | Plot |
|---|---|
| CZT HV Monitor | 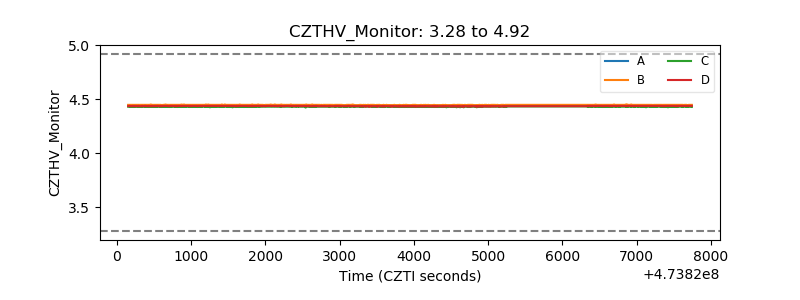 |
| D_VDD | 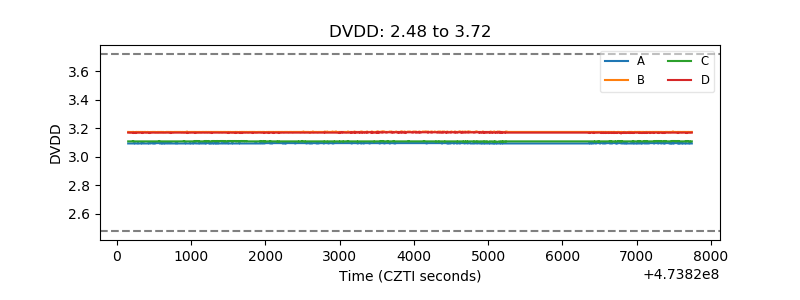 |
| Temperature 1 | 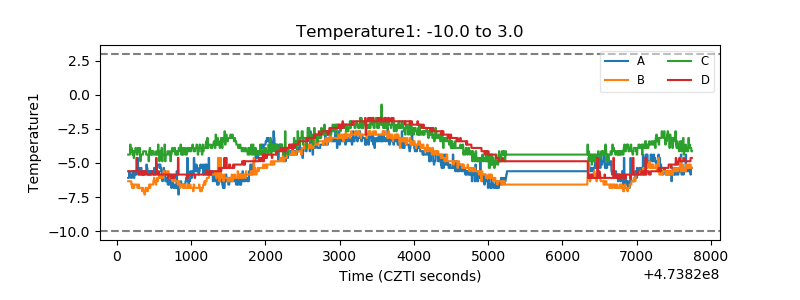 |
| Veto HV Monitor | 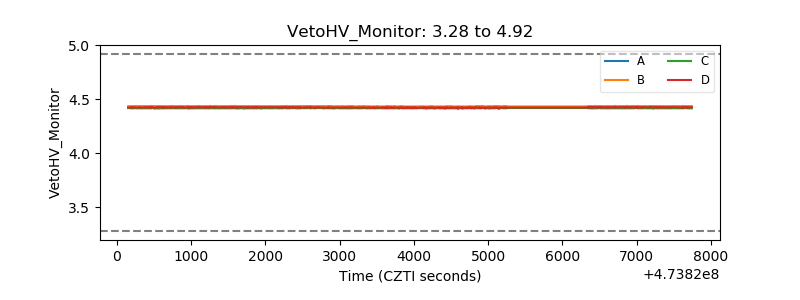 |
| Veto LLD | 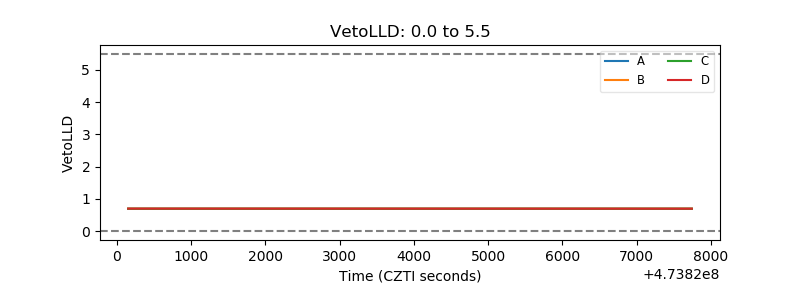 |
| Alpha Counter | 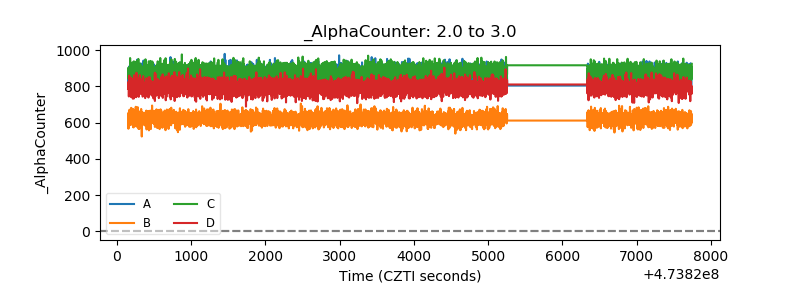 |
| _CPM_Rate | 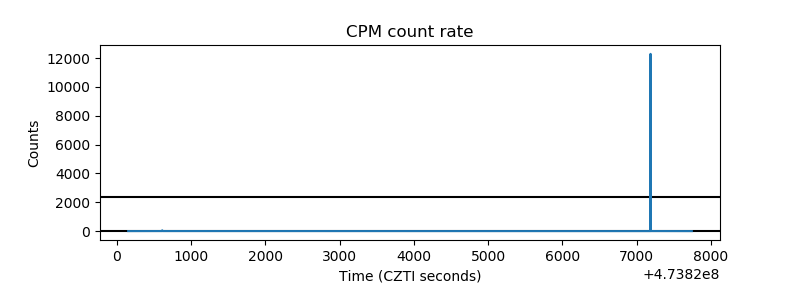 |
| CZT Counter | 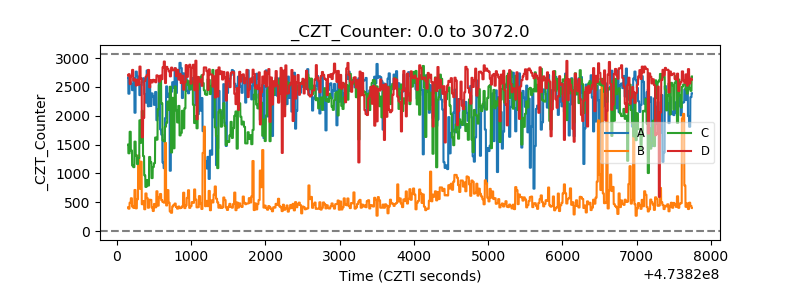 |
| +2.5 Volts monitor |  |
| +5 Volts monitor |  |
| _ROLL_ROT | 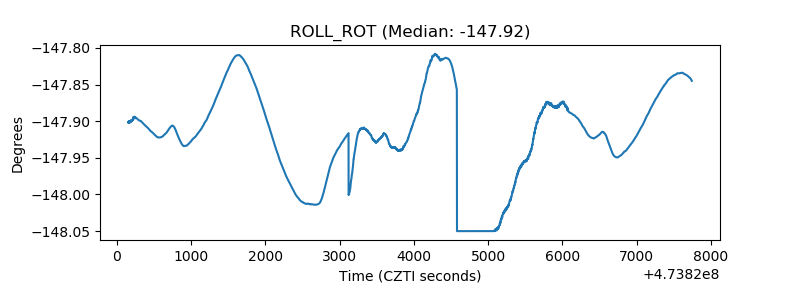 |
| _Roll_DEC | 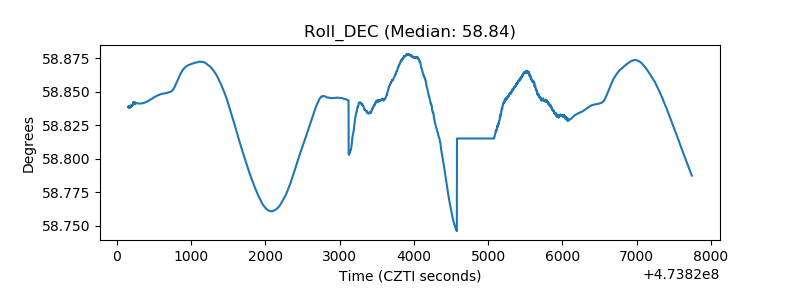 |
| _Roll_RA | 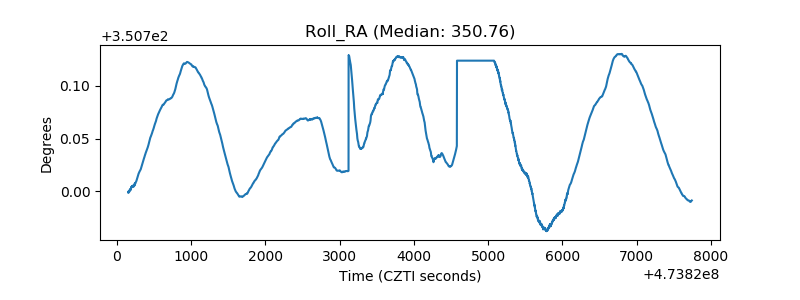 |
| Veto Counter | 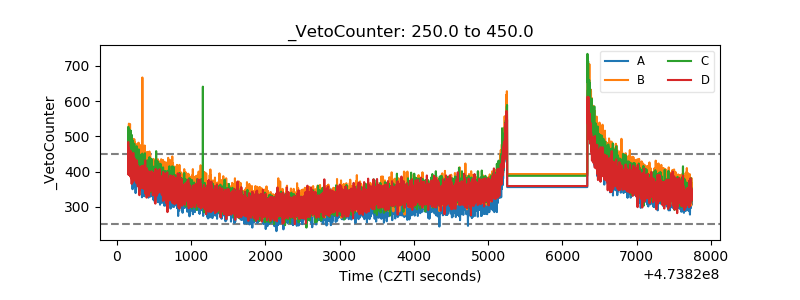 |