| Param | Original file | Final file |
|---|---|---|
| Filename | modeM0/AS1C09_003T01_9000006442_50347cztM0_level2.fits | modeM0/AS1C09_003T01_9000006442_50347cztM0_level2_quad_clean.evt |
| Size (bytes) | 792,394,560 | 83,505,600 |
| Size | 755.7 MB | 79.6 MB |
| Events in quadrant A | 5,663,544 | 563,122 |
| Events in quadrant B | 4,241,633 | 673,196 |
| Events in quadrant C | 8,099,574 | 461,085 |
| Events in quadrant D | 10,825,394 | 378,609 |
| Mode M9 | |||
|---|---|---|---|
| Quadrant | BADHDUFLAG | Total packets | Discarded packets |
| A | 0 | 11 | 0 |
| B | 0 | 12 | 0 |
| C | 0 | 12 | 0 |
| D | 0 | 12 | 0 |
| Mode M0 | |||
|---|---|---|---|
| Quadrant | BADHDUFLAG | Total packets | Discarded packets |
| A | 0 | 21182 | 2 |
| B | 0 | 17007 | 2 |
| C | 0 | 28554 | 2 |
| D | 0 | 36635 | 2 |
| Mode SS | |||
|---|---|---|---|
| Quadrant | BADHDUFLAG | Total packets | Discarded packets |
| A | 0 | 132 | 0 |
| B | 0 | 132 | 0 |
| C | 0 | 132 | 0 |
| D | 0 | 132 | 0 |
| Quadrant | Total seconds | Saturated seconds | Saturation percentage |
|---|---|---|---|
| A | 6483 | 851 | 13.126639% |
| B | 6483 | 326 | 5.028536% |
| C | 6483 | 1895 | 29.230295% |
| D | 6483 | 2513 | 38.762918% |
Noise dominated data is calculated using 1-second bins in cleaned event files. If a bin has >2000 counts, and if more than 50% of those come from <1% of pixels, then it is considered to be noise-dominated and hence unusable.
| Quadrant | # 1 sec bins | Bins with >0 counts | Bins with >2000 counts | High rate bins dominated by noise | Noise dominated (total time) | Noise dominated (detector-on time) | Marked lightcurve |
|---|---|---|---|---|---|---|---|
| A | 7627 | 6482 | 769 | 769 | 10.08% | 11.86% | 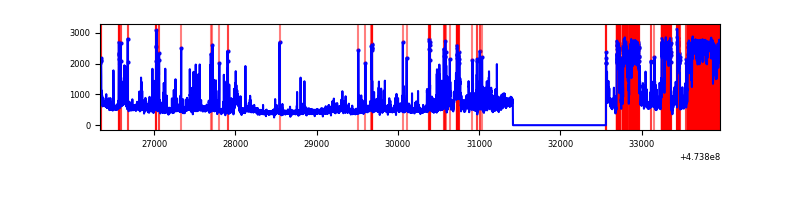 |
| B | 7628 | 6483 | 185 | 185 | 2.43% | 2.85% | 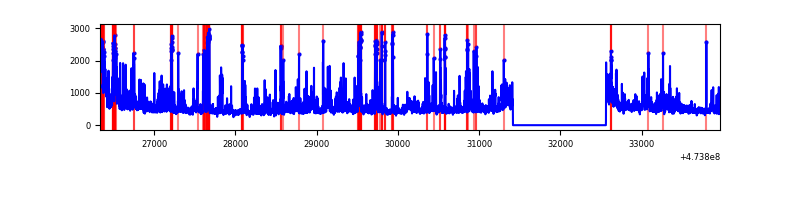 |
| C | 7628 | 6483 | 1660 | 1660 | 21.76% | 25.61% | 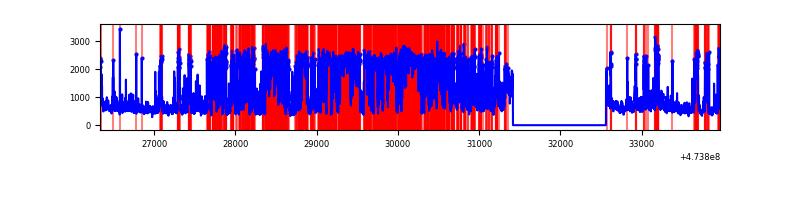 |
| D | 7628 | 6483 | 2726 | 2726 | 35.74% | 42.05% | 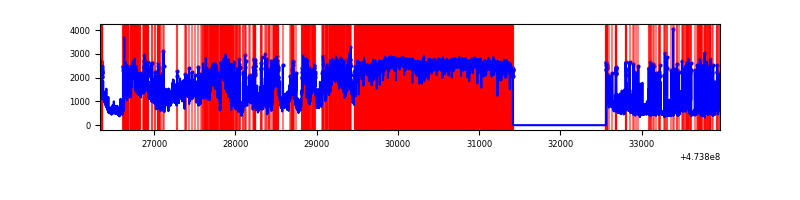 |
Top three noisy pixels from each quadrant. If the there are fewer than three noisy pixels in the level2.evt file, extra rows are filled as -1
| Pixel properties | Quadrant properties | ||||||
|---|---|---|---|---|---|---|---|
| Quadrant | DetID | PixID | Counts | Sigma | Mean | Median | Sigma |
| A | 7 | 206 | 1692424 | 10229.95 | 670 | 657 | 165.4 |
| A | 4 | 3 | 254592 | 1535.52 | 670 | 657 | 165.4 |
| A | 10 | 253 | 198004 | 1193.34 | 670 | 657 | 165.4 |
| B | 1 | 238 | 399929 | 2698.42 | 694 | 671 | 148.0 |
| B | 8 | 128 | 185308 | 1247.88 | 694 | 671 | 148.0 |
| B | 10 | 44 | 172586 | 1161.9 | 694 | 671 | 148.0 |
| C | 0 | 208 | 3767104 | 21773.0 | 601 | 596 | 173.0 |
| C | 15 | 199 | 248986 | 1435.86 | 601 | 596 | 173.0 |
| C | 1 | 3 | 185303 | 1067.73 | 601 | 596 | 173.0 |
| D | 7 | 61 | 5036151 | 31593.8 | 558 | 540 | 159.4 |
| D | 2 | 165 | 1040594 | 6525.38 | 558 | 540 | 159.4 |
| D | 7 | 126 | 389947 | 2443.17 | 558 | 540 | 159.4 |
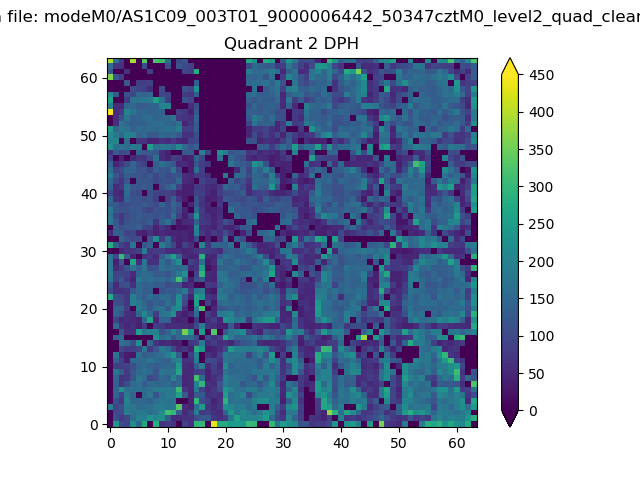
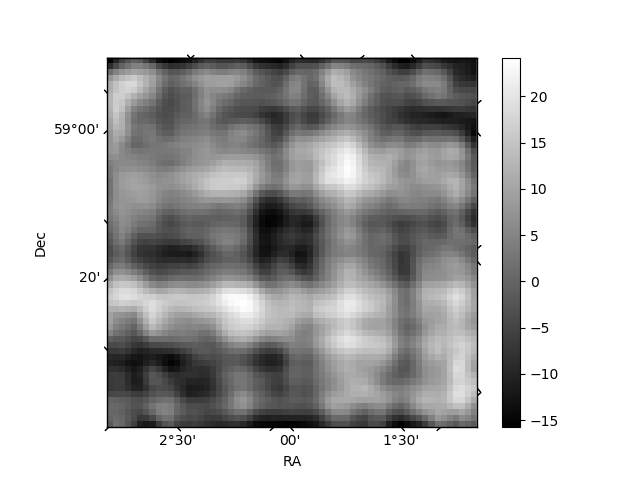
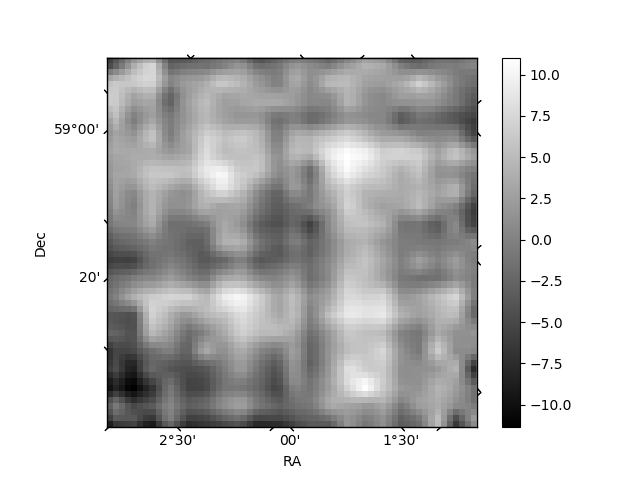
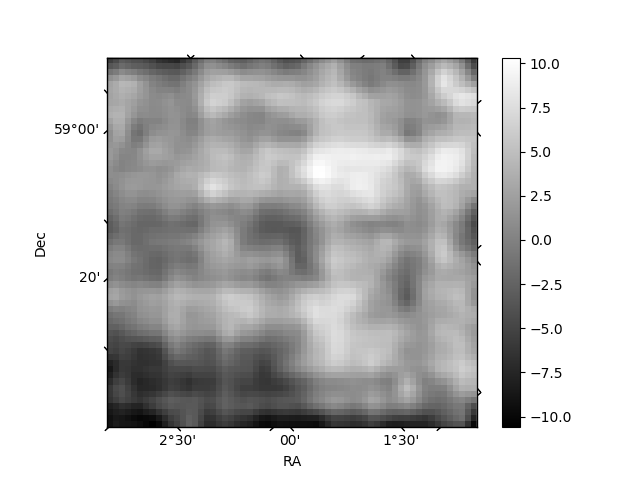
Histogram calculated using DETX and DETY for each event in the final _common_clean file
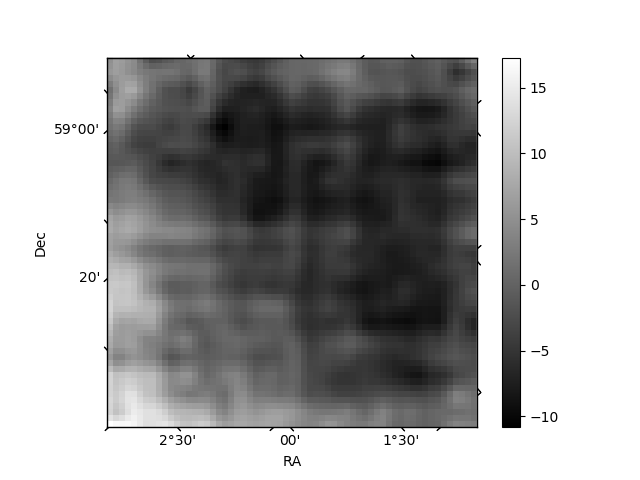
| Quadrant A | 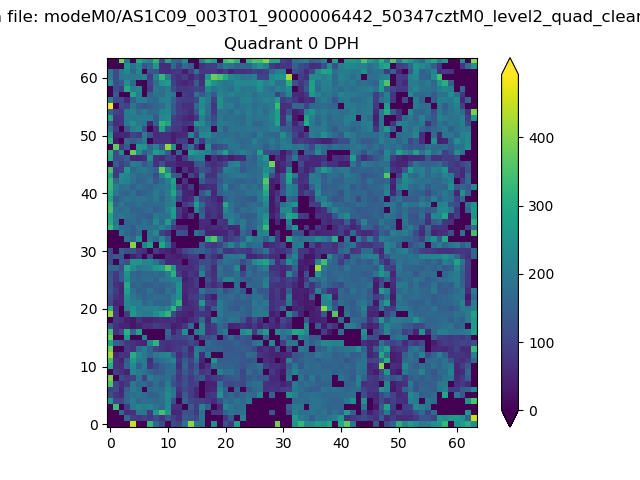 |
 |
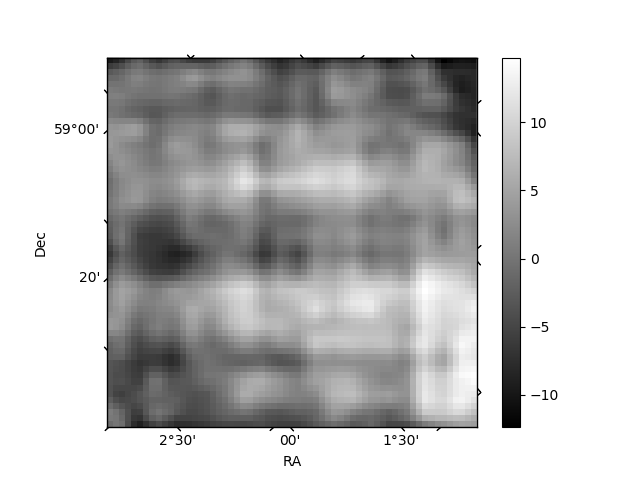
Quadrant B |
|---|---|---|---|
| Quadrant D | 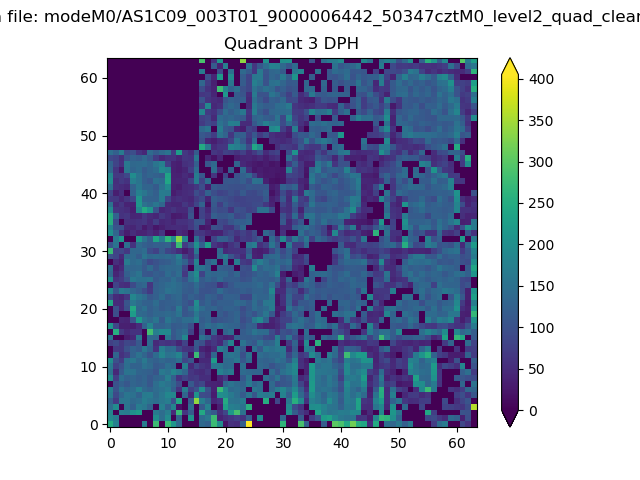 |
 |
Quadrant C |
| Plot type | Count rate plots | Images |
|---|---|---|
| Comparison with Poisson distribution Blue bars denote a histogram of data divided into 1 sec bins. Red curve is a Poisson curve with rate = median count rate of data. |
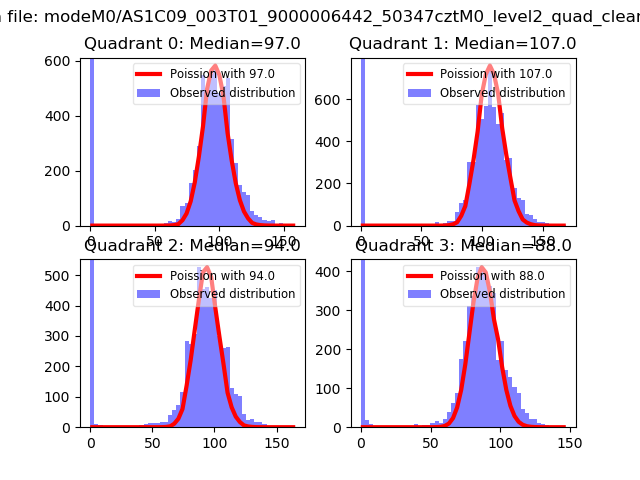 |
 |
| Quadrant-wise count rates Data is divided into 100 sec bins |
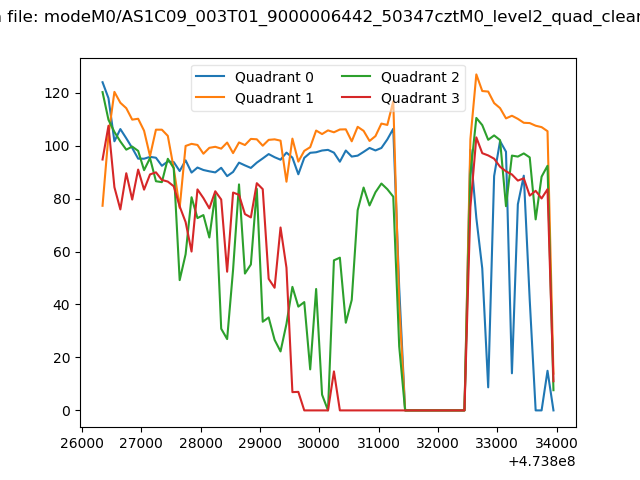 |
|
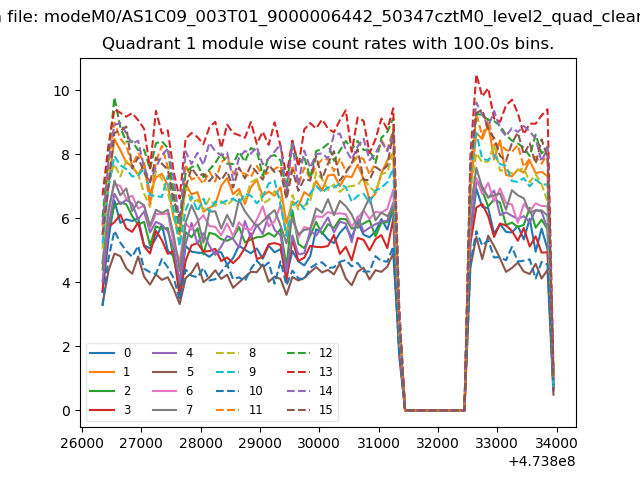
| Module-wise count rates for Quadrant A Data is divided into 100 sec bins |
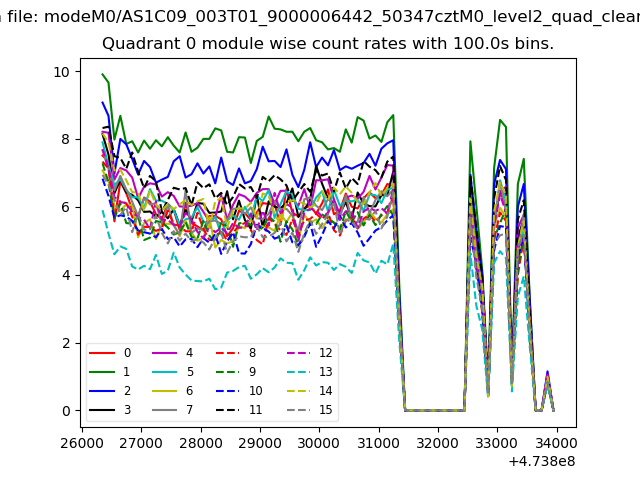 |
 |
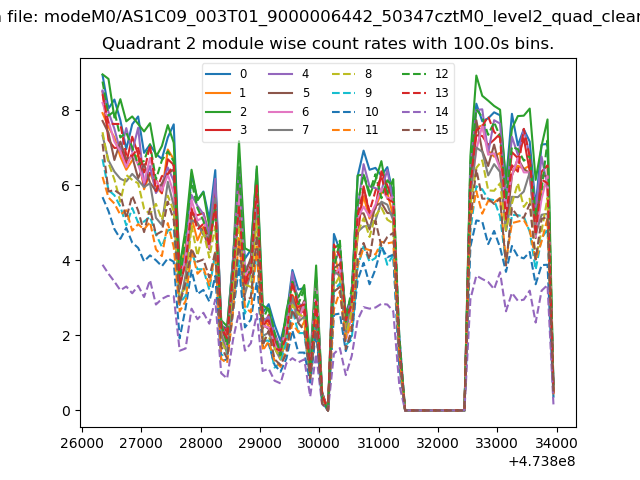
| Module-wise count rates for Quadrant B Data is divided into 100 sec bins |
 |
 |
| Module-wise count rates for Quadrant C Data is divided into 100 sec bins |
 |
 |
| Module-wise count rates for Quadrant D Data is divided into 100 sec bins |
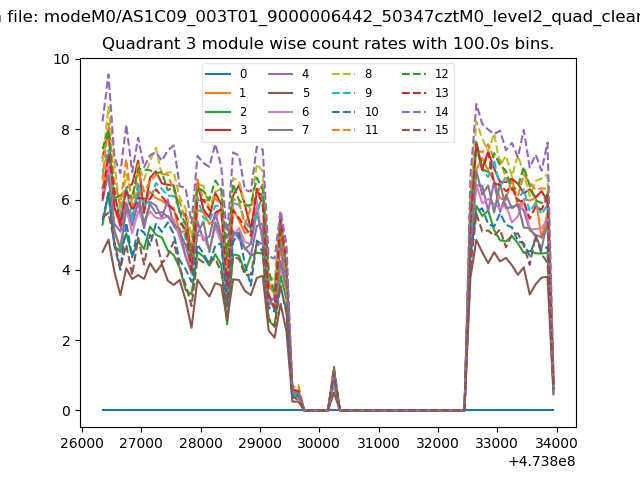 |
 |
| Parameter | Plot |
|---|---|
| CZT HV Monitor | 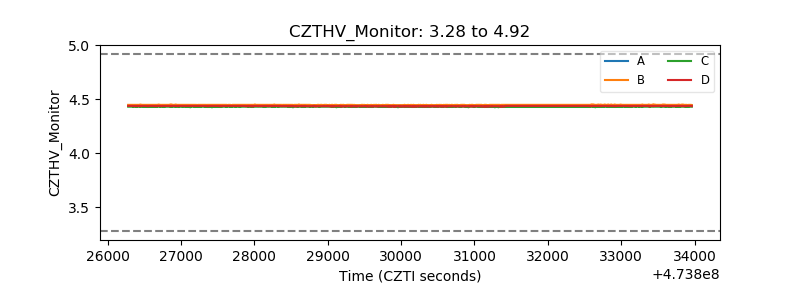 |
| D_VDD | 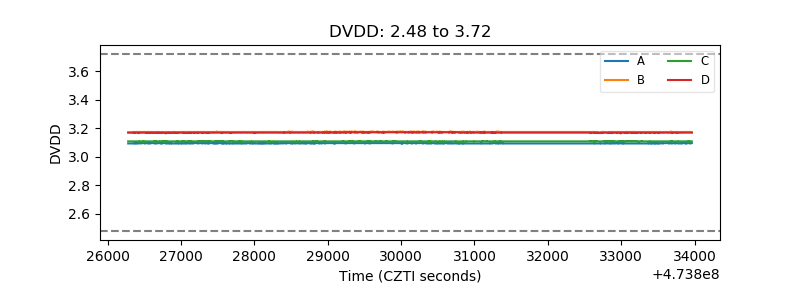 |
| Temperature 1 | 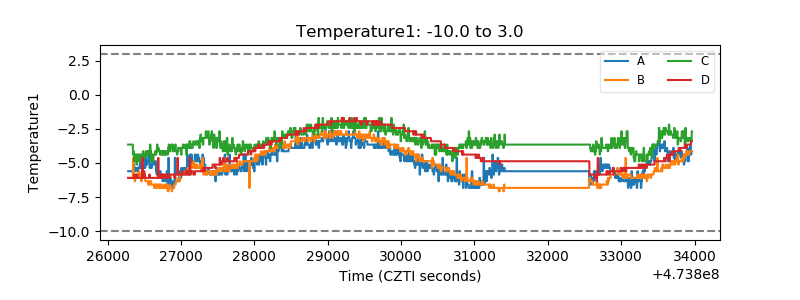 |
| Veto HV Monitor | 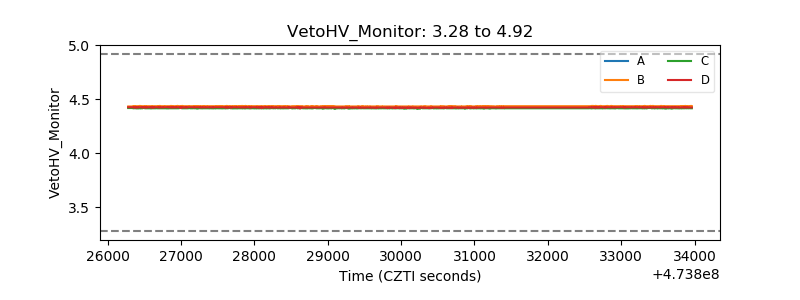 |
| Veto LLD | 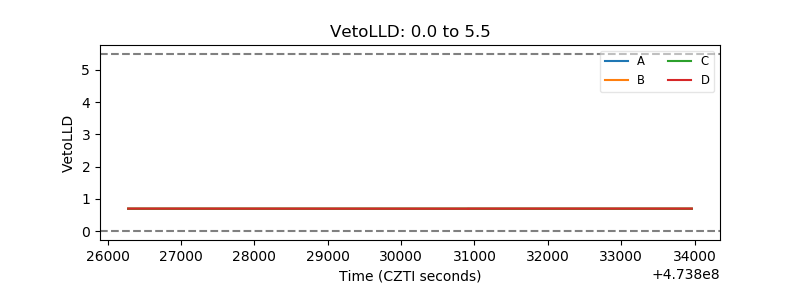 |
| Alpha Counter | 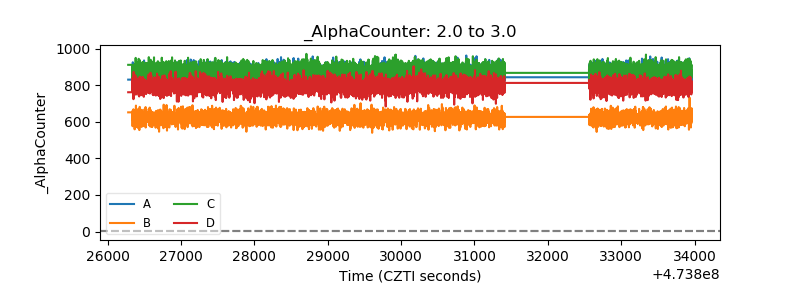 |
| _CPM_Rate | 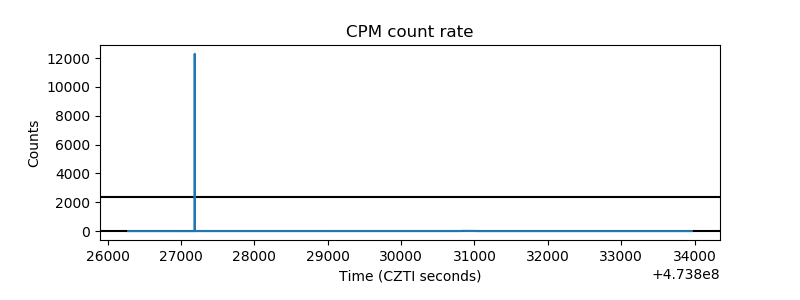 |
| CZT Counter | 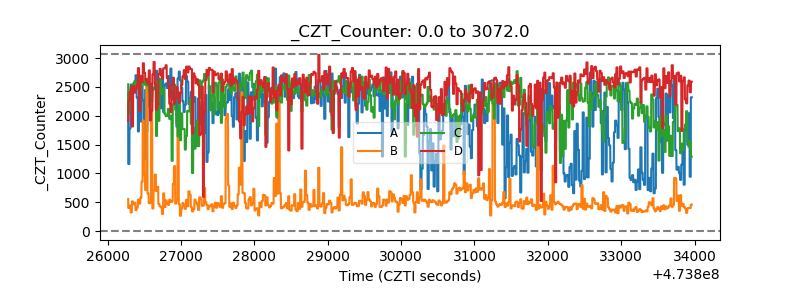 |
| +2.5 Volts monitor | 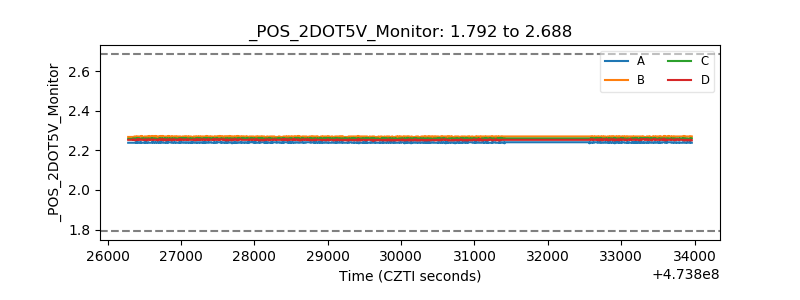 |
| +5 Volts monitor |  |
| _ROLL_ROT | 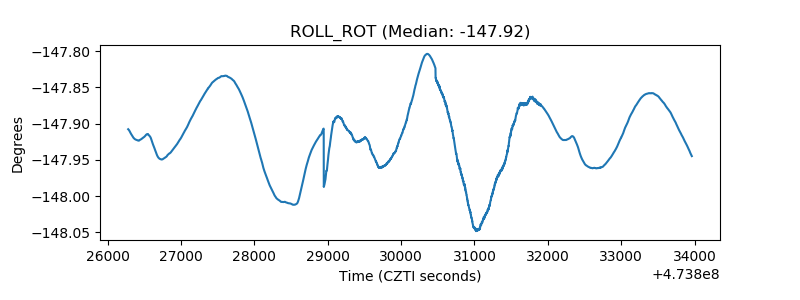 |
| _Roll_DEC | 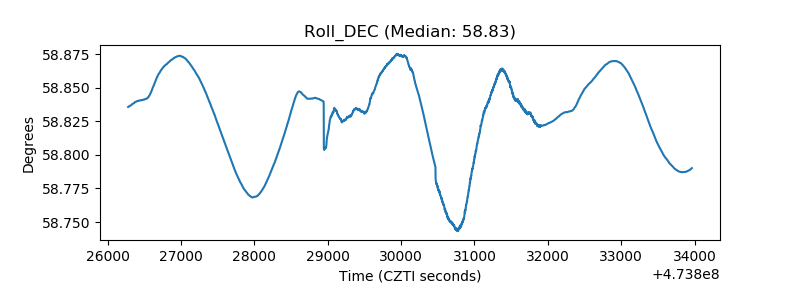 |
| _Roll_RA | 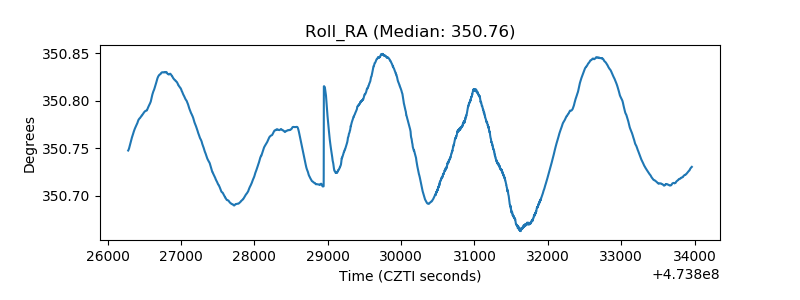 |
| Veto Counter | 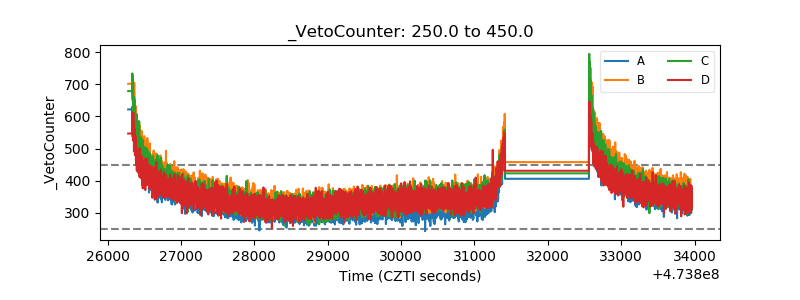 |