| Param | Original file | Final file |
|---|---|---|
| Filename | modeM0/AS1C09_003T01_9000006442_50350cztM0_level2.fits | modeM0/AS1C09_003T01_9000006442_50350cztM0_level2_quad_clean.evt |
| Size (bytes) | 819,383,040 | 74,540,160 |
| Size | 781.4 MB | 71.1 MB |
| Events in quadrant A | 5,050,384 | 549,557 |
| Events in quadrant B | 4,913,594 | 602,471 |
| Events in quadrant C | 10,564,325 | 310,460 |
| Events in quadrant D | 9,330,151 | 366,986 |
| Mode M9 | |||
|---|---|---|---|
| Quadrant | BADHDUFLAG | Total packets | Discarded packets |
| A | 0 | 8 | 0 |
| B | 0 | 8 | 0 |
| C | 0 | 8 | 0 |
| D | 0 | 8 | 0 |
| Mode M0 | |||
|---|---|---|---|
| Quadrant | BADHDUFLAG | Total packets | Discarded packets |
| A | 0 | 19107 | 1 |
| B | 0 | 18762 | 1 |
| C | 0 | 35567 | 1 |
| D | 0 | 32017 | 5 |
| Mode SS | |||
|---|---|---|---|
| Quadrant | BADHDUFLAG | Total packets | Discarded packets |
| A | 0 | 126 | 0 |
| B | 0 | 126 | 0 |
| C | 0 | 126 | 0 |
| D | 0 | 126 | 0 |
| Quadrant | Total seconds | Saturated seconds | Saturation percentage |
|---|---|---|---|
| A | 6112 | 474 | 7.755236% |
| B | 6112 | 424 | 6.937173% |
| C | 6112 | 3040 | 49.738220% |
| D | 6112 | 1975 | 32.313482% |
Noise dominated data is calculated using 1-second bins in cleaned event files. If a bin has >2000 counts, and if more than 50% of those come from <1% of pixels, then it is considered to be noise-dominated and hence unusable.
| Quadrant | # 1 sec bins | Bins with >0 counts | Bins with >2000 counts | High rate bins dominated by noise | Noise dominated (total time) | Noise dominated (detector-on time) | Marked lightcurve |
|---|---|---|---|---|---|---|---|
| A | 6972 | 6112 | 312 | 312 | 4.48% | 5.10% | 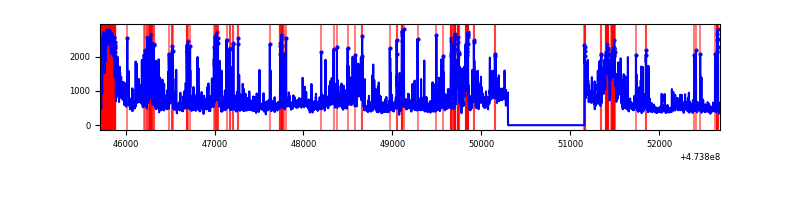 |
| B | 6972 | 6112 | 259 | 259 | 3.71% | 4.24% | 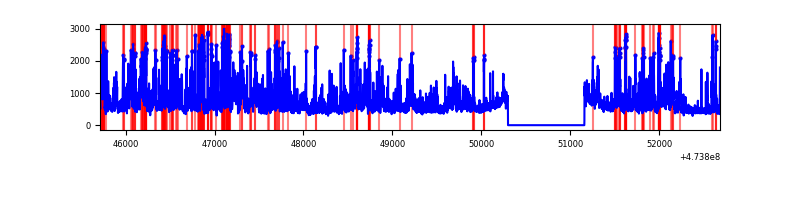 |
| C | 6971 | 6111 | 2915 | 2915 | 41.82% | 47.70% | 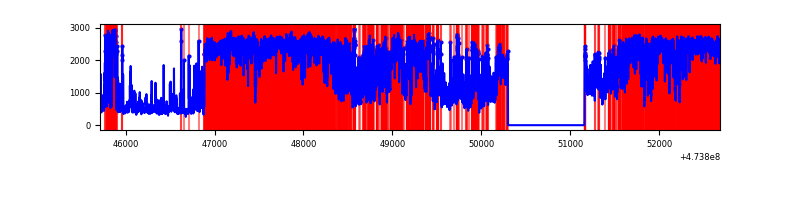 |
| D | 6971 | 6111 | 2074 | 2074 | 29.75% | 33.94% | 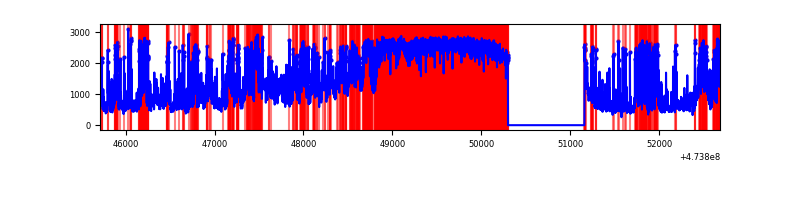 |
Top three noisy pixels from each quadrant. If the there are fewer than three noisy pixels in the level2.evt file, extra rows are filled as -1
| Pixel properties | Quadrant properties | ||||||
|---|---|---|---|---|---|---|---|
| Quadrant | DetID | PixID | Counts | Sigma | Mean | Median | Sigma |
| A | 7 | 206 | 1254527 | 7896.15 | 641 | 625 | 158.8 |
| A | 3 | 130 | 282584 | 1775.57 | 641 | 625 | 158.8 |
| A | 4 | 3 | 280646 | 1763.37 | 641 | 625 | 158.8 |
| B | 4 | 170 | 633965 | 4626.0 | 637 | 614 | 136.9 |
| B | 1 | 238 | 521921 | 3807.63 | 637 | 614 | 136.9 |
| B | 10 | 44 | 288711 | 2104.26 | 637 | 614 | 136.9 |
| C | 15 | 230 | 6282558 | 44674.59 | 494 | 491 | 140.6 |
| C | 13 | 3 | 535877 | 3807.37 | 494 | 491 | 140.6 |
| C | 15 | 232 | 381643 | 2710.54 | 494 | 491 | 140.6 |
| D | 7 | 61 | 4015153 | 26511.8 | 534 | 517 | 151.4 |
| D | 6 | 42 | 754401 | 4978.49 | 534 | 517 | 151.4 |
| D | 2 | 175 | 368176 | 2427.94 | 534 | 517 | 151.4 |
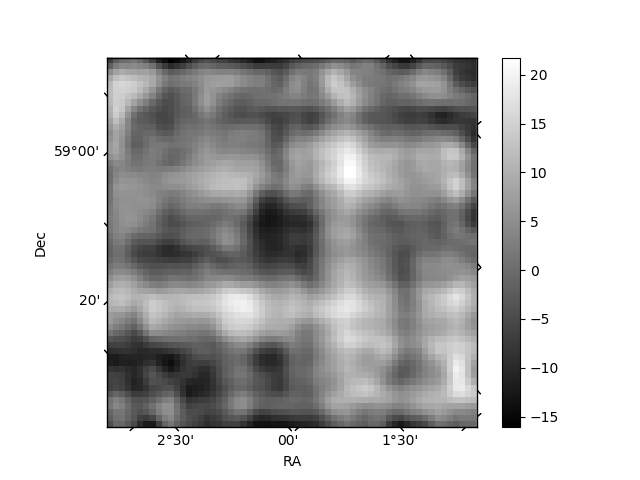
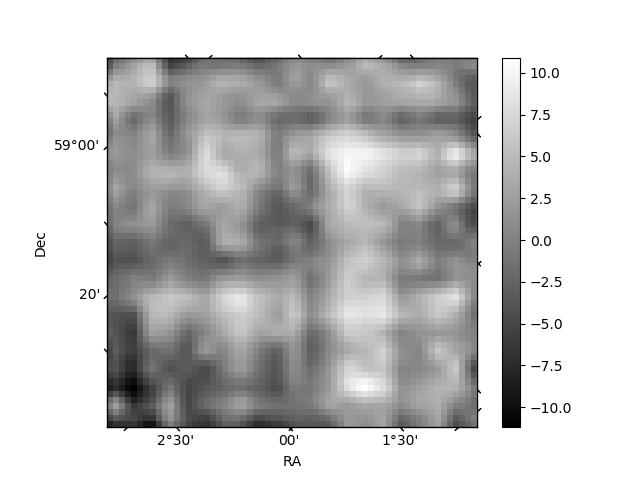
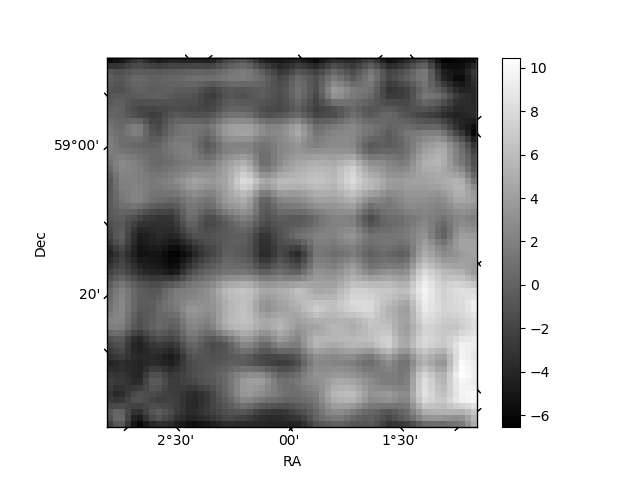
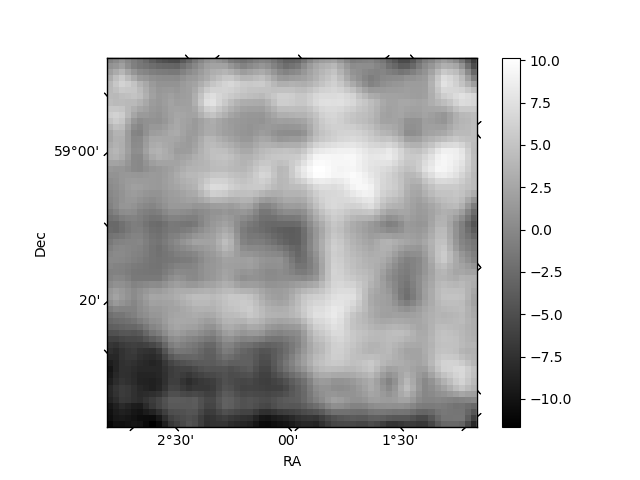
Histogram calculated using DETX and DETY for each event in the final _common_clean file
| Quadrant A | 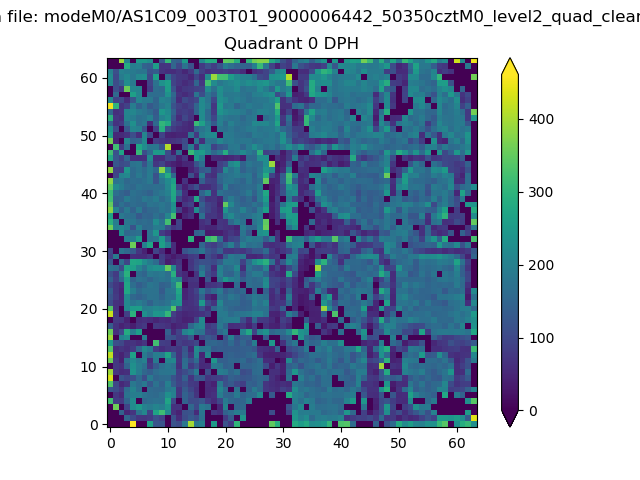 |
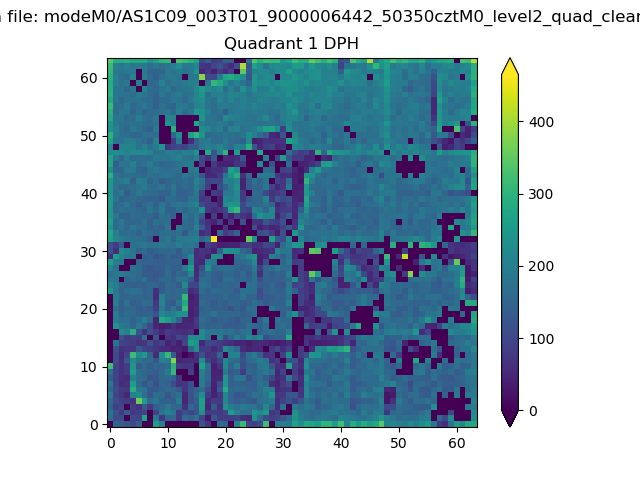 |
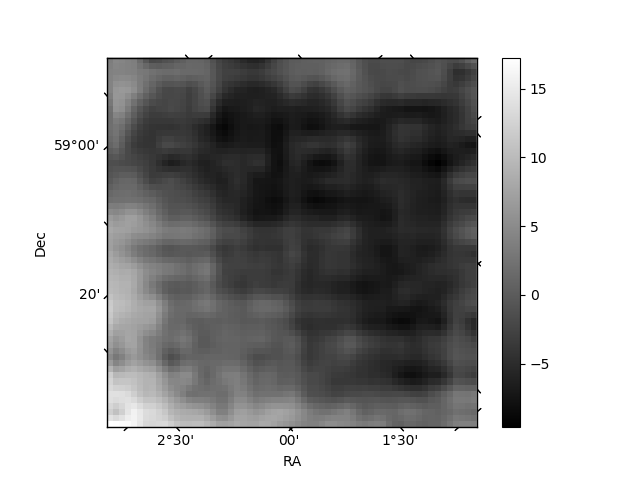
Quadrant B |
|---|---|---|---|
| Quadrant D | 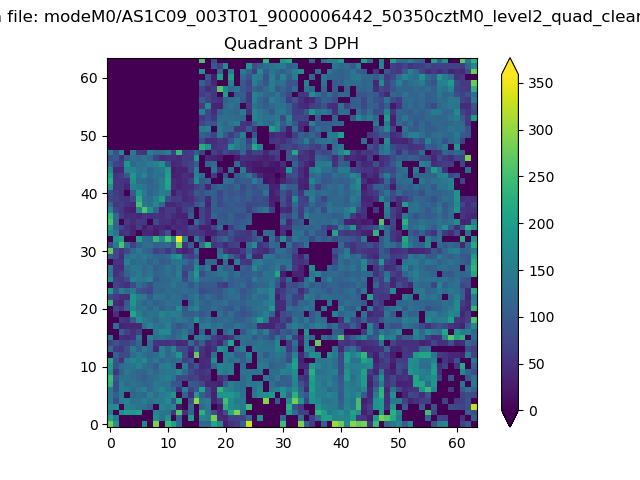 |
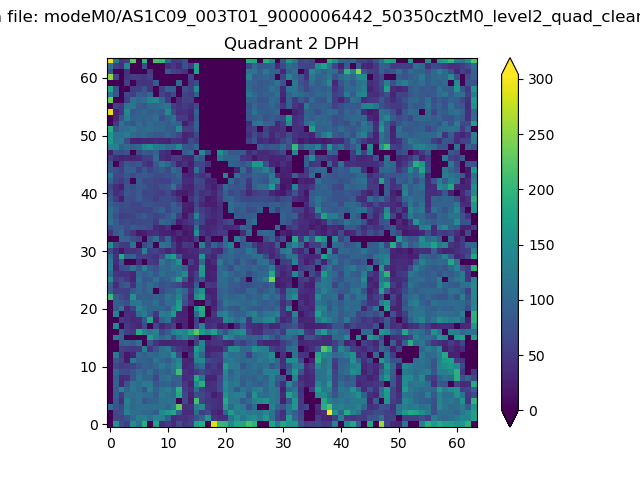 |
Quadrant C |
| Plot type | Count rate plots | Images |
|---|---|---|
| Comparison with Poisson distribution Blue bars denote a histogram of data divided into 1 sec bins. Red curve is a Poisson curve with rate = median count rate of data. |
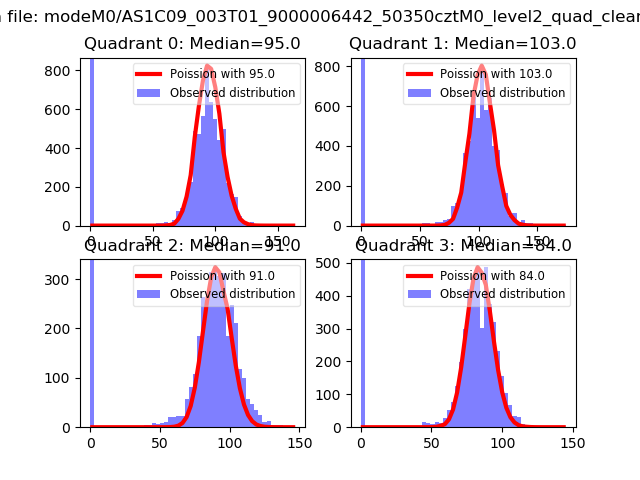 |
 |
| Quadrant-wise count rates Data is divided into 100 sec bins |
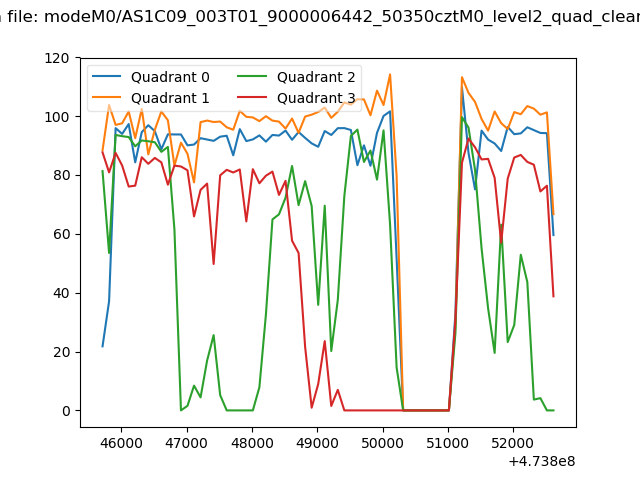 |
|
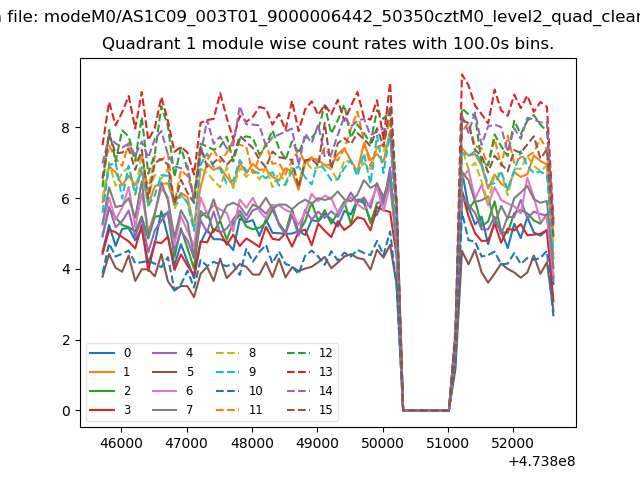
| Module-wise count rates for Quadrant A Data is divided into 100 sec bins |
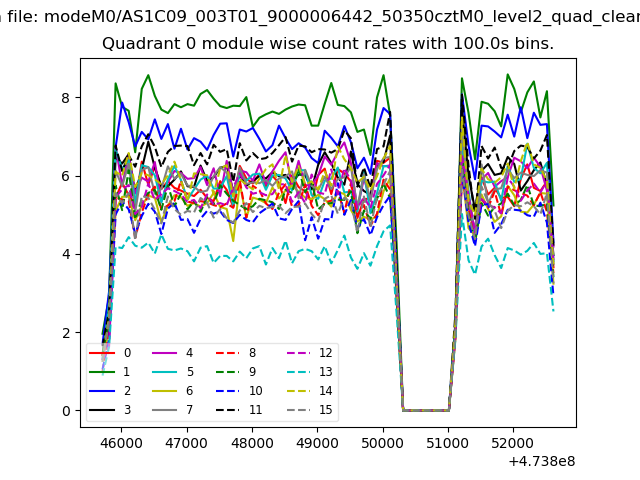 |
 |
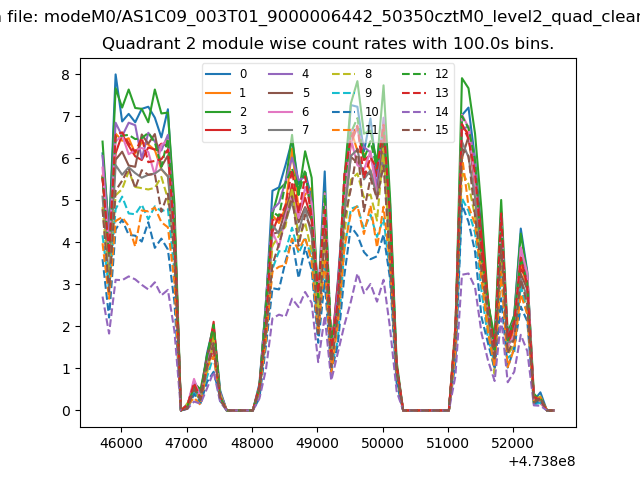
| Module-wise count rates for Quadrant B Data is divided into 100 sec bins |
 |
 |
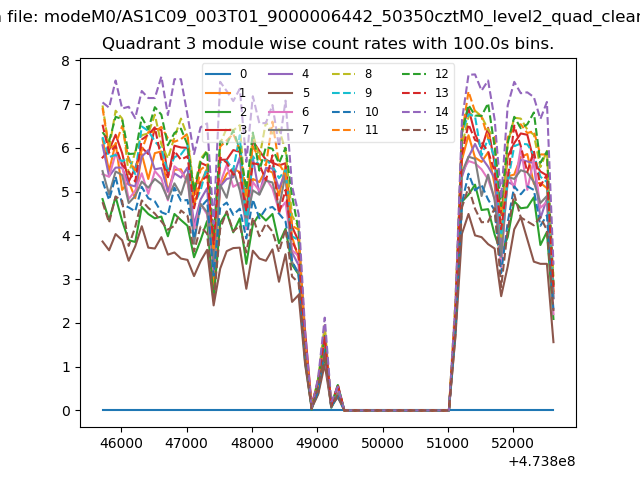
| Module-wise count rates for Quadrant C Data is divided into 100 sec bins |
 |
 |
| Module-wise count rates for Quadrant D Data is divided into 100 sec bins |
 |
 |
| Parameter | Plot |
|---|---|
| CZT HV Monitor | 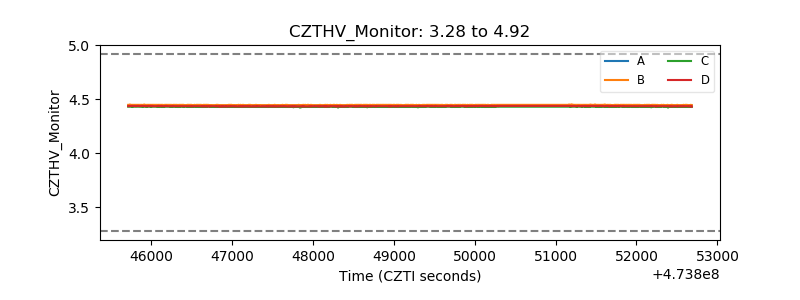 |
| D_VDD | 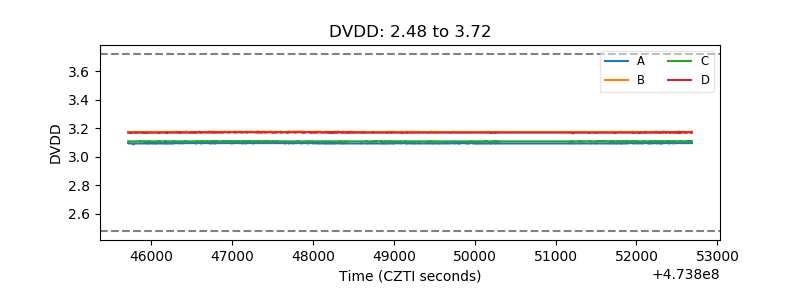 |
| Temperature 1 | 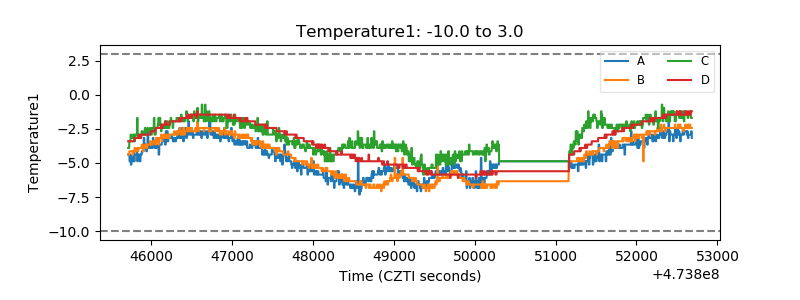 |
| Veto HV Monitor | 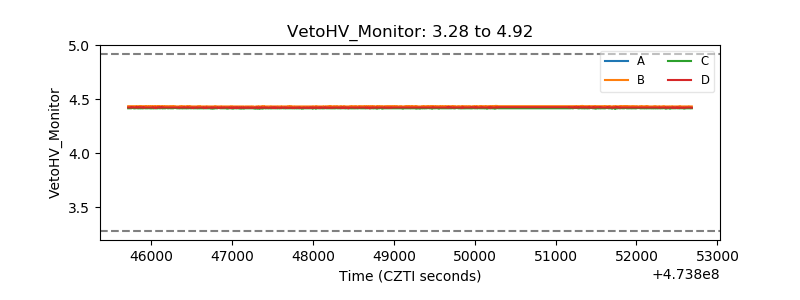 |
| Veto LLD | 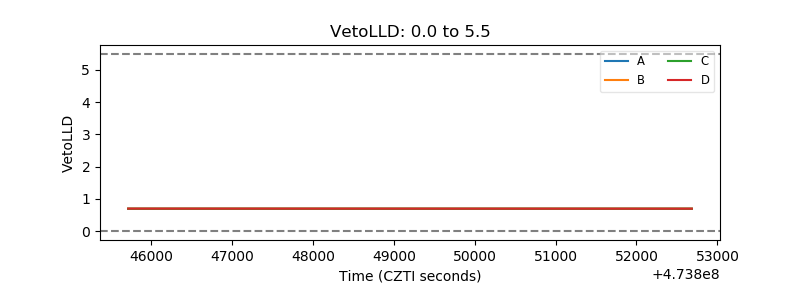 |
| Alpha Counter | 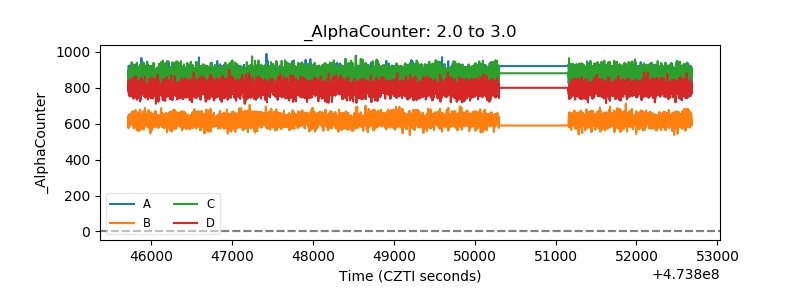 |
| _CPM_Rate | 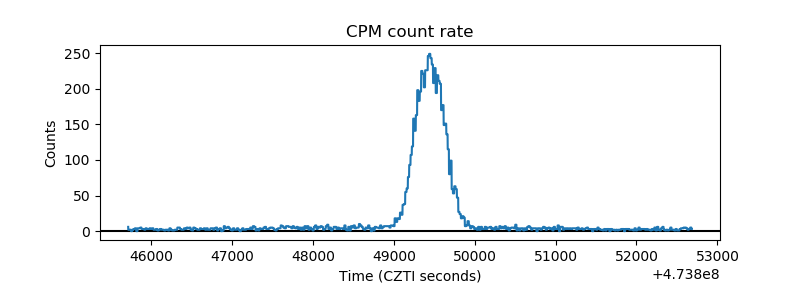 |
| CZT Counter | 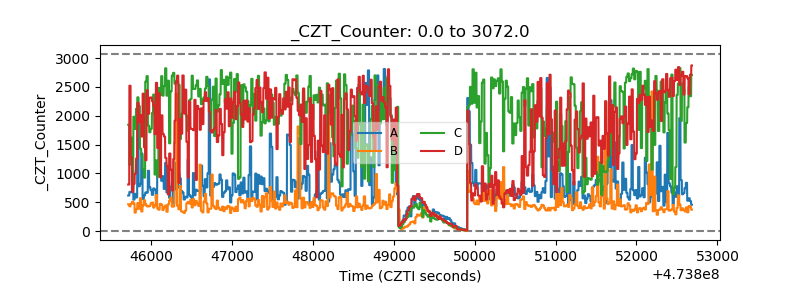 |
| +2.5 Volts monitor |  |
| +5 Volts monitor |  |
| _ROLL_ROT | 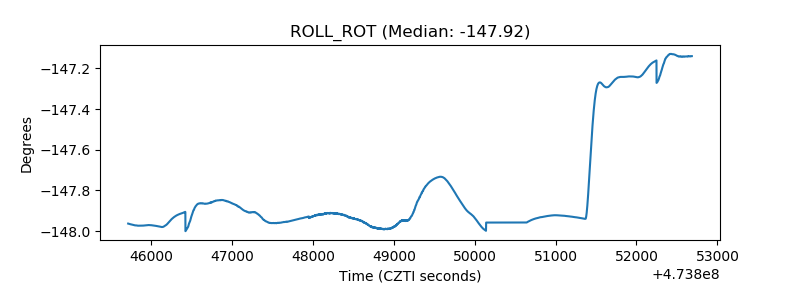 |
| _Roll_DEC | 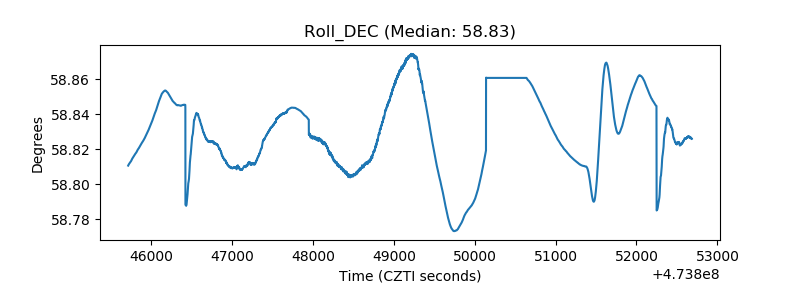 |
| _Roll_RA | 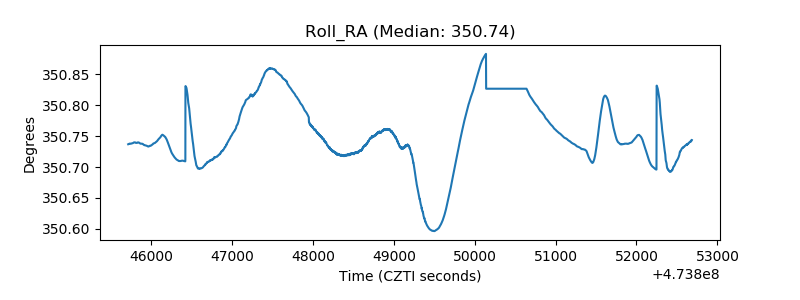 |
| Veto Counter | 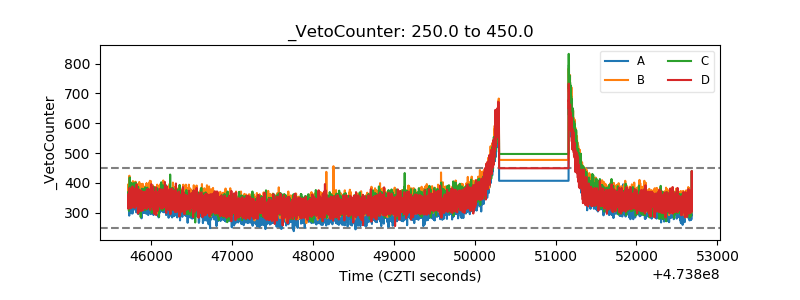 |