| Param | Original file | Final file |
|---|---|---|
| Filename | modeM0/AS1C09_003T01_9000006442_50352cztM0_level2.fits | modeM0/AS1C09_003T01_9000006442_50352cztM0_level2_quad_clean.evt |
| Size (bytes) | 1,043,634,240 | 75,329,280 |
| Size | 995.3 MB | 71.8 MB |
| Events in quadrant A | 5,727,764 | 640,781 |
| Events in quadrant B | 5,303,123 | 684,144 |
| Events in quadrant C | 11,575,792 | 430,946 |
| Events in quadrant D | 15,477,109 | 31,111 |
| Mode M0 | |||
|---|---|---|---|
| Quadrant | BADHDUFLAG | Total packets | Discarded packets |
| A | 0 | 21754 | 0 |
| B | 0 | 20607 | 0 |
| C | 0 | 39298 | 0 |
| D | 0 | 50808 | 4 |
| Mode SS | |||
|---|---|---|---|
| Quadrant | BADHDUFLAG | Total packets | Discarded packets |
| A | 0 | 142 | 0 |
| B | 0 | 142 | 0 |
| C | 0 | 142 | 0 |
| D | 0 | 142 | 0 |
| Quadrant | Total seconds | Saturated seconds | Saturation percentage |
|---|---|---|---|
| A | 7087 | 390 | 5.503034% |
| B | 7087 | 467 | 6.589530% |
| C | 7087 | 2722 | 38.408353% |
| D | 7086 | 6788 | 95.794524% |
Noise dominated data is calculated using 1-second bins in cleaned event files. If a bin has >2000 counts, and if more than 50% of those come from <1% of pixels, then it is considered to be noise-dominated and hence unusable.
| Quadrant | # 1 sec bins | Bins with >0 counts | Bins with >2000 counts | High rate bins dominated by noise | Noise dominated (total time) | Noise dominated (detector-on time) | Marked lightcurve |
|---|---|---|---|---|---|---|---|
| A | 7087 | 7087 | 359 | 359 | 5.07% | 5.07% | 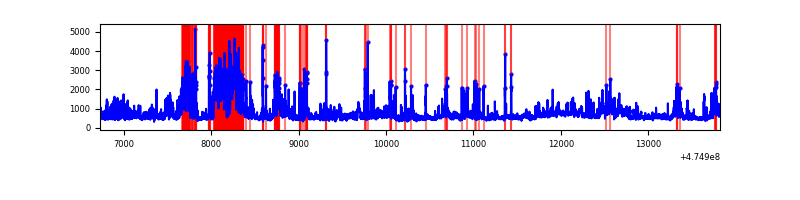 |
| B | 7087 | 7087 | 260 | 260 | 3.67% | 3.67% | 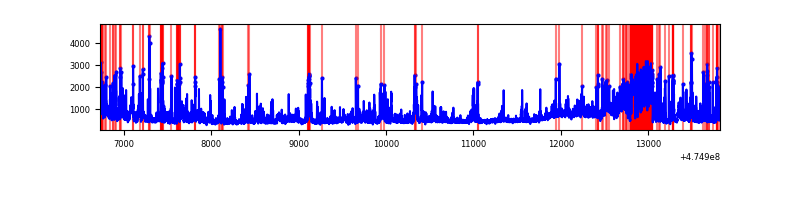 |
| C | 7087 | 7087 | 2492 | 2492 | 35.16% | 35.16% | 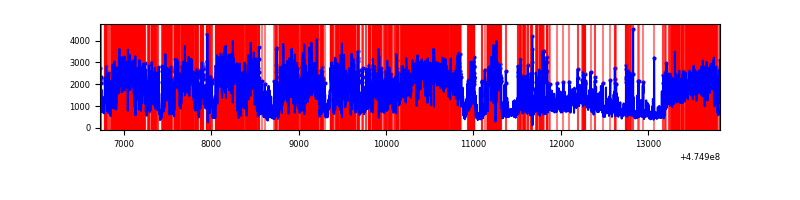 |
| D | 7085 | 7081 | 4709 | 4709 | 66.46% | 66.50% | 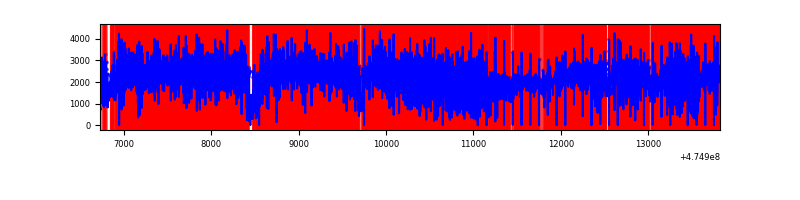 |
Top three noisy pixels from each quadrant. If the there are fewer than three noisy pixels in the level2.evt file, extra rows are filled as -1
| Pixel properties | Quadrant properties | ||||||
|---|---|---|---|---|---|---|---|
| Quadrant | DetID | PixID | Counts | Sigma | Mean | Median | Sigma |
| A | 3 | 231 | 716467 | 3887.69 | 748 | 730 | 184.1 |
| A | 10 | 253 | 508968 | 2760.61 | 748 | 730 | 184.1 |
| A | 4 | 3 | 360270 | 1952.92 | 748 | 730 | 184.1 |
| B | 4 | 170 | 1086320 | 6905.53 | 739 | 717 | 157.2 |
| B | 5 | 172 | 280194 | 1777.75 | 739 | 717 | 157.2 |
| B | 0 | 200 | 188832 | 1196.6 | 739 | 717 | 157.2 |
| C | 15 | 230 | 3040438 | 17005.75 | 648 | 645 | 178.8 |
| C | 15 | 232 | 2591577 | 14494.65 | 648 | 645 | 178.8 |
| C | 15 | 196 | 596041 | 3330.87 | 648 | 645 | 178.8 |
| D | 7 | 61 | 10605673 | 144160.22 | 251 | 241 | 73.6 |
| D | 3 | 12 | 1979298 | 26901.43 | 251 | 241 | 73.6 |
| D | 15 | 108 | 264355 | 3590.12 | 251 | 241 | 73.6 |
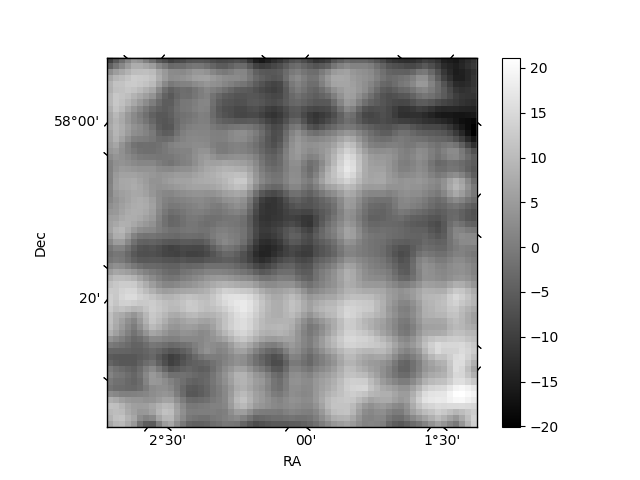
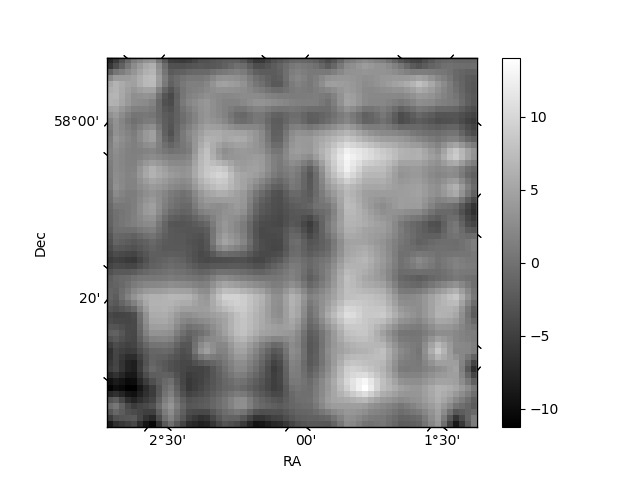
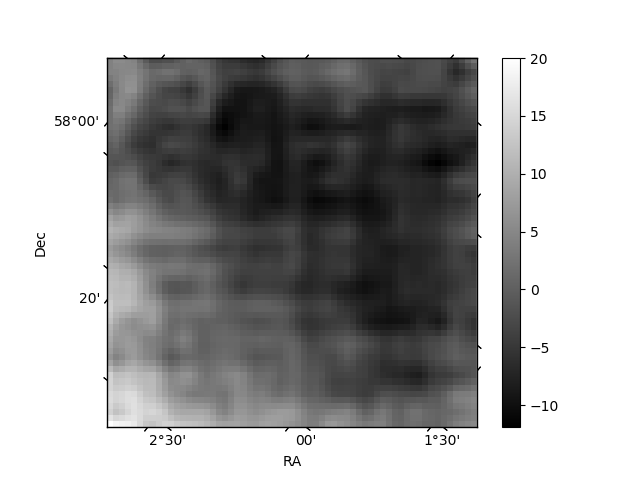
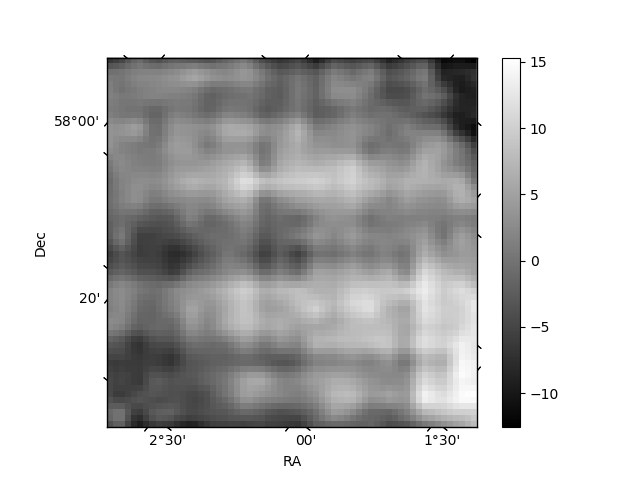
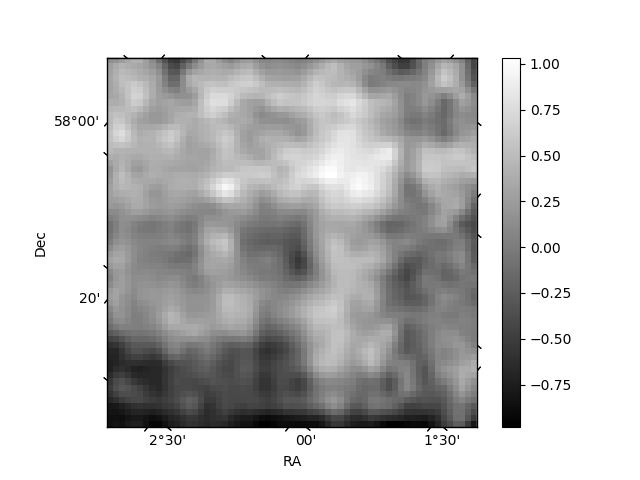
Histogram calculated using DETX and DETY for each event in the final _common_clean file
| Quadrant A | 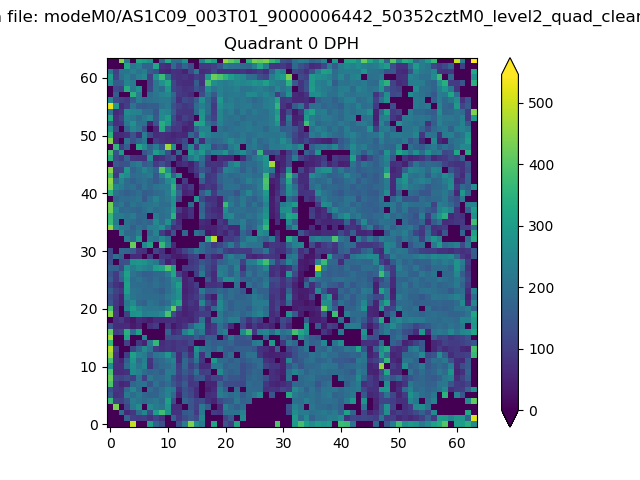 |
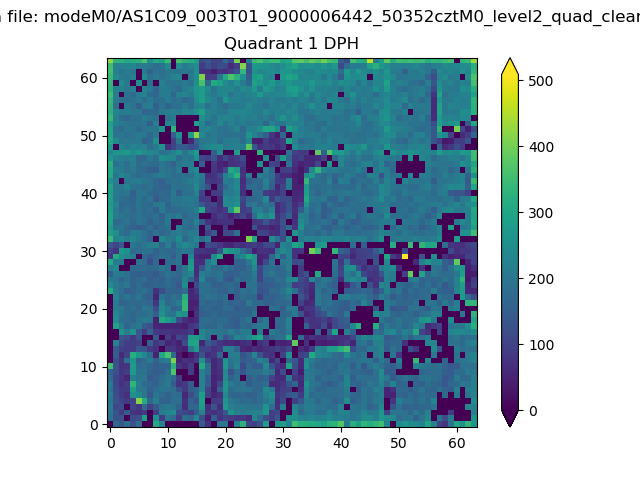 |
Quadrant B |
|---|---|---|---|
| Quadrant D | 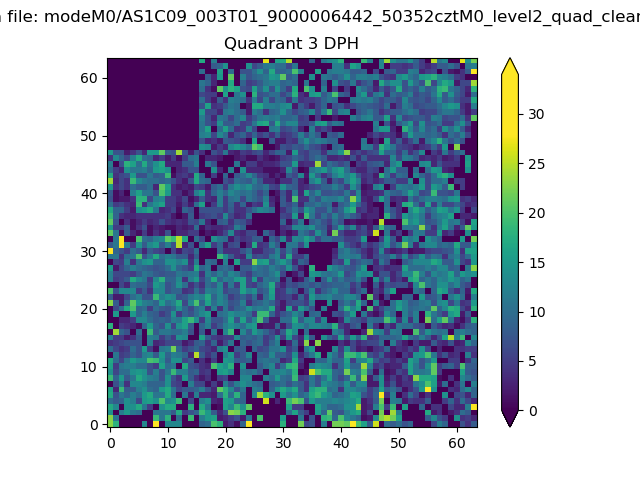 |
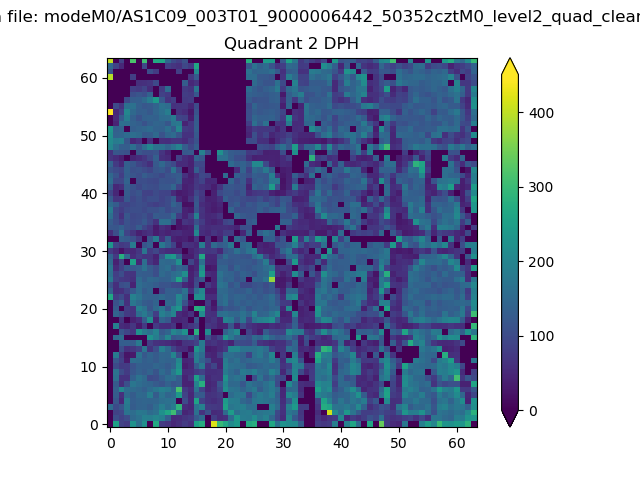 |
Quadrant C |
| Plot type | Count rate plots | Images |
|---|---|---|
| Comparison with Poisson distribution Blue bars denote a histogram of data divided into 1 sec bins. Red curve is a Poisson curve with rate = median count rate of data. |
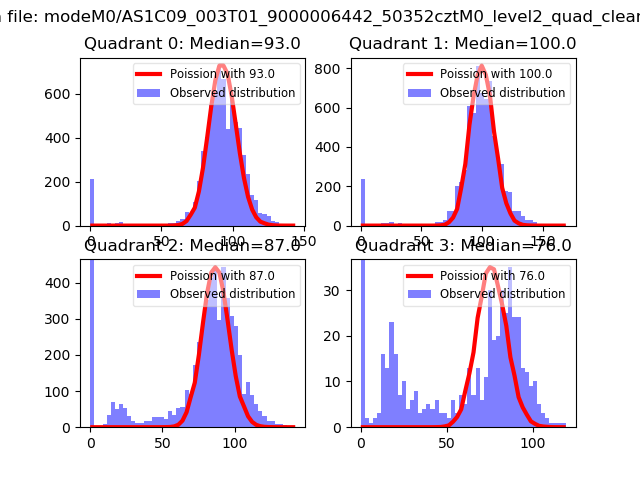 |
 |
| Quadrant-wise count rates Data is divided into 100 sec bins |
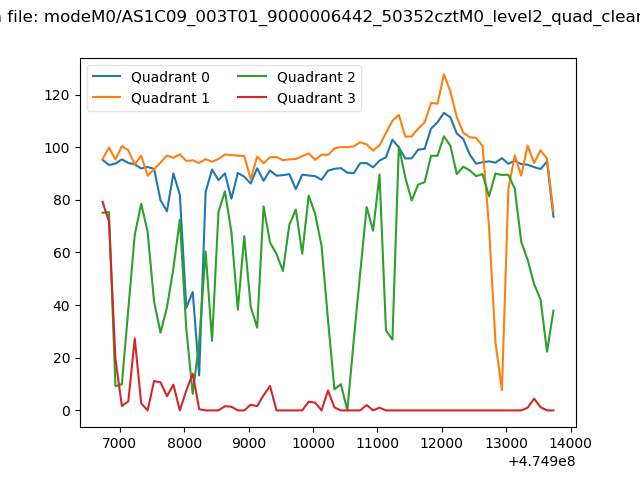 |
|
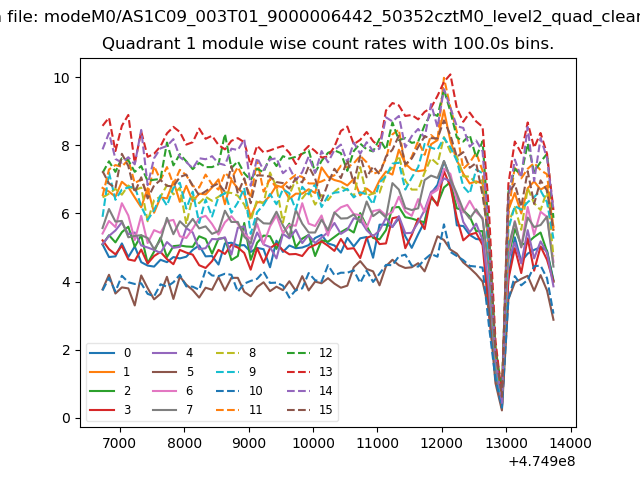
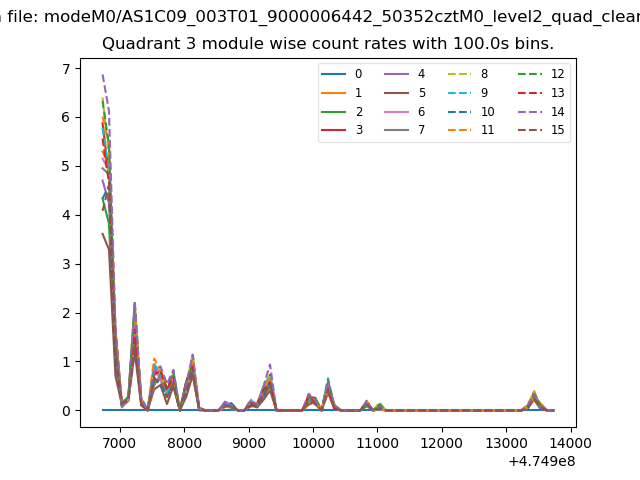
| Module-wise count rates for Quadrant A Data is divided into 100 sec bins |
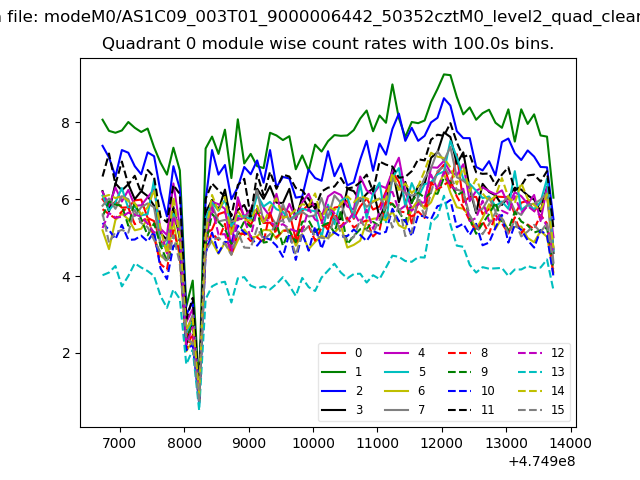 |
 |
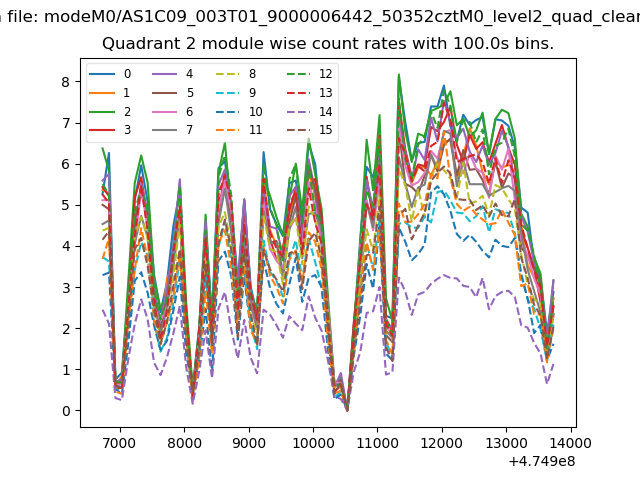
| Module-wise count rates for Quadrant B Data is divided into 100 sec bins |
 |
 |
| Module-wise count rates for Quadrant C Data is divided into 100 sec bins |
 |
 |
| Module-wise count rates for Quadrant D Data is divided into 100 sec bins |
 |
 |
| Parameter | Plot |
|---|---|
| CZT HV Monitor | 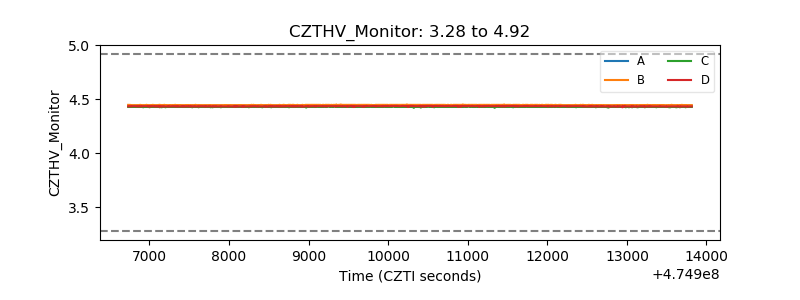 |
| D_VDD | 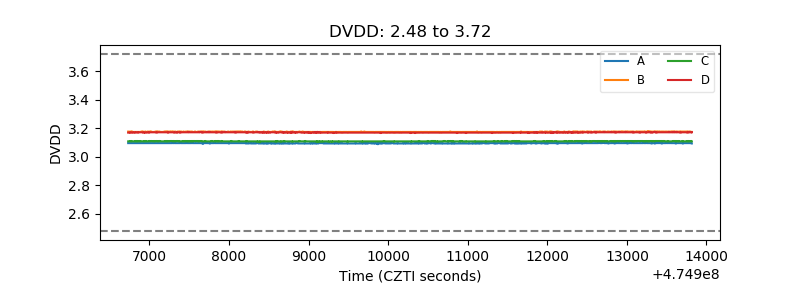 |
| Temperature 1 | 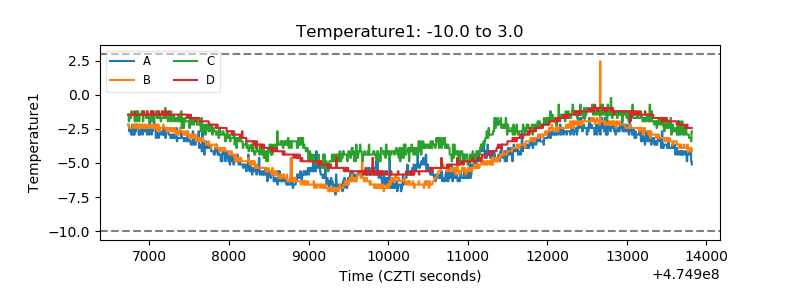 |
| Veto HV Monitor | 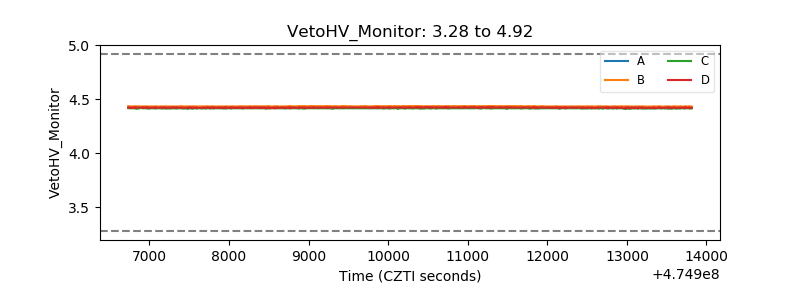 |
| Veto LLD | 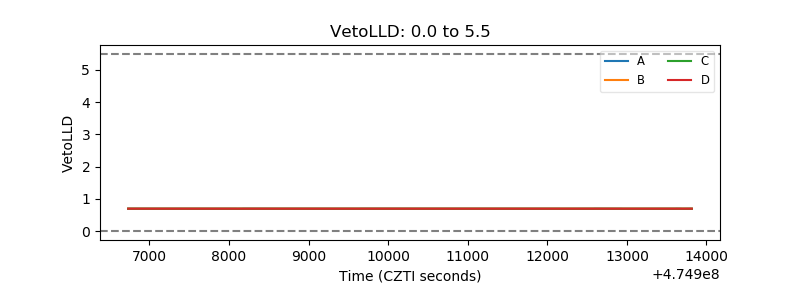 |
| Alpha Counter | 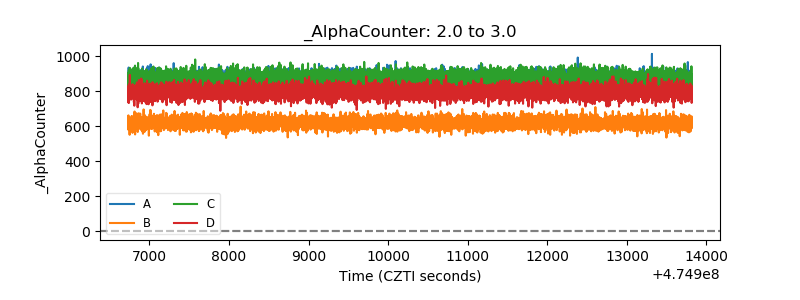 |
| _CPM_Rate | 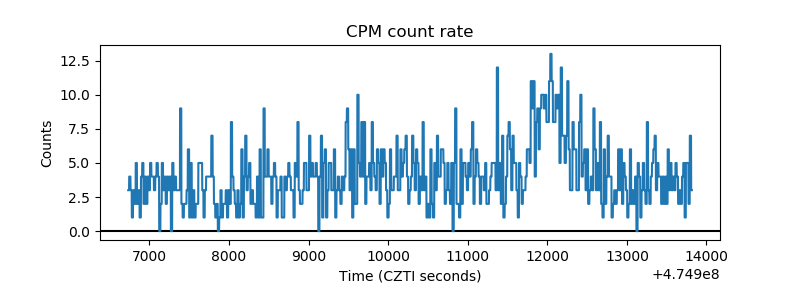 |
| CZT Counter | 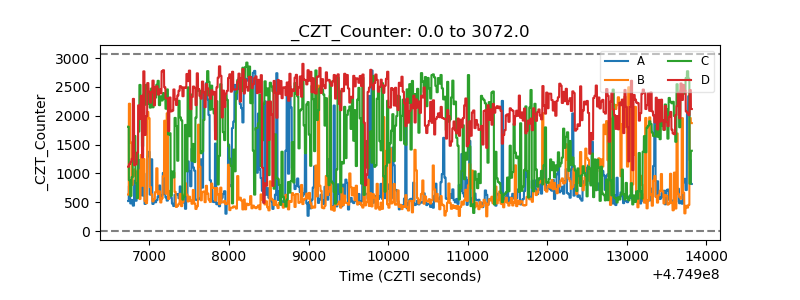 |
| +2.5 Volts monitor | 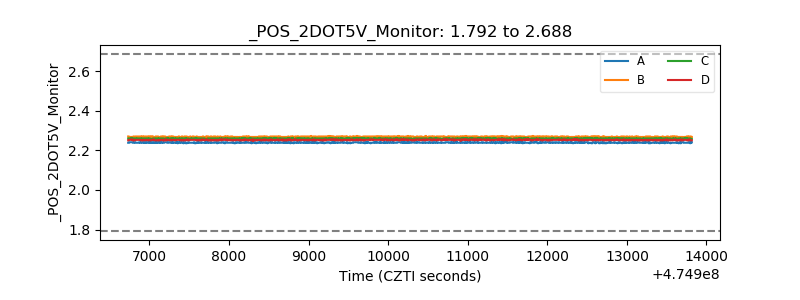 |
| +5 Volts monitor |  |
| _ROLL_ROT | 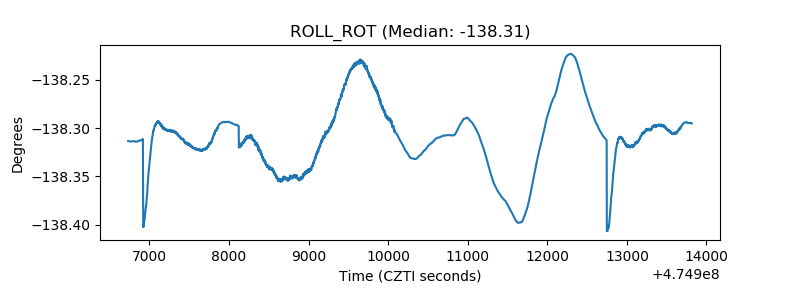 |
| _Roll_DEC | 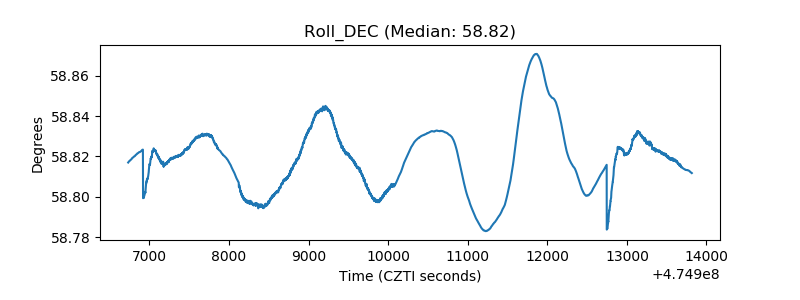 |
| _Roll_RA | 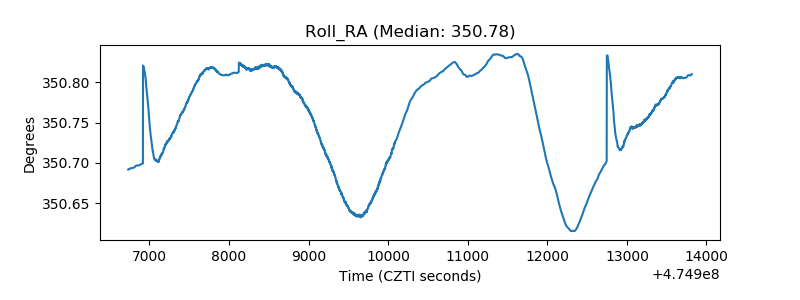 |
| Veto Counter | 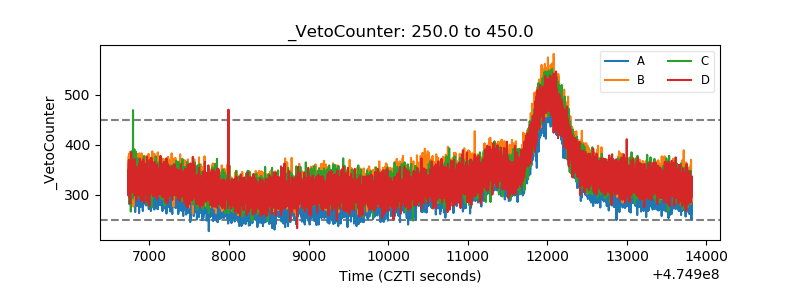 |