| Param | Original file | Final file |
|---|---|---|
| Filename | modeM0/AS1C09_003T01_9000006442_50357cztM0_level2.fits | modeM0/AS1C09_003T01_9000006442_50357cztM0_level2_quad_clean.evt |
| Size (bytes) | 3,835,296,000 | 236,934,720 |
| Size | 3.6 GB | 226.0 MB |
| Events in quadrant A | 17,572,589 | 2,224,793 |
| Events in quadrant B | 35,825,942 | 1,495,246 |
| Events in quadrant C | 39,430,962 | 1,231,154 |
| Events in quadrant D | 47,276,113 | 548,418 |
| Mode M9 | |||
|---|---|---|---|
| Quadrant | BADHDUFLAG | Total packets | Discarded packets |
| A | 0 | 15 | 0 |
| B | 0 | 15 | 0 |
| C | 0 | 15 | 0 |
| D | 0 | 15 | 0 |
| Mode M0 | |||
|---|---|---|---|
| Quadrant | BADHDUFLAG | Total packets | Discarded packets |
| A | 0 | 68667 | 3 |
| B | 0 | 123366 | 3 |
| C | 0 | 134007 | 3 |
| D | 0 | 157053 | 3 |
| Mode SS | |||
|---|---|---|---|
| Quadrant | BADHDUFLAG | Total packets | Discarded packets |
| A | 0 | 496 | 0 |
| B | 0 | 496 | 0 |
| C | 0 | 496 | 0 |
| D | 0 | 496 | 0 |
| Quadrant | Total seconds | Saturated seconds | Saturation percentage |
|---|---|---|---|
| A | 24281 | 616 | 2.536963% |
| B | 24281 | 9061 | 37.317244% |
| C | 24281 | 10439 | 42.992463% |
| D | 24282 | 18185 | 74.890866% |
Noise dominated data is calculated using 1-second bins in cleaned event files. If a bin has >2000 counts, and if more than 50% of those come from <1% of pixels, then it is considered to be noise-dominated and hence unusable.
| Quadrant | # 1 sec bins | Bins with >0 counts | Bins with >2000 counts | High rate bins dominated by noise | Noise dominated (total time) | Noise dominated (detector-on time) | Marked lightcurve |
|---|---|---|---|---|---|---|---|
| A | 25936 | 24284 | 440 | 440 | 1.70% | 1.81% | 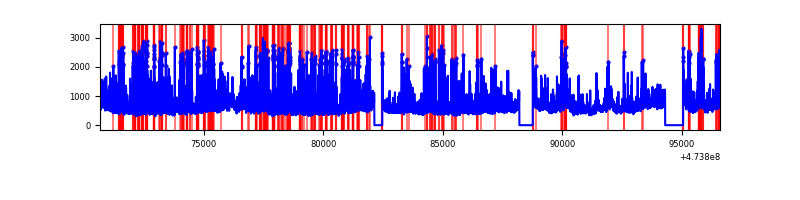 |
| B | 25936 | 24284 | 7254 | 7254 | 27.97% | 29.87% | 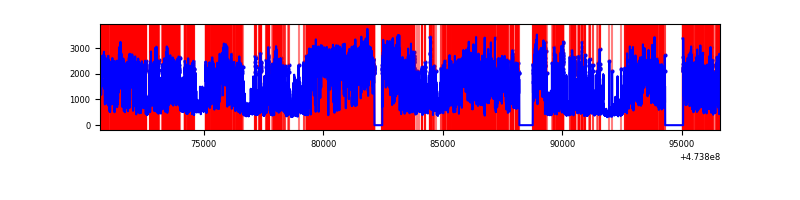 |
| C | 25936 | 24284 | 9619 | 9619 | 37.09% | 39.61% | 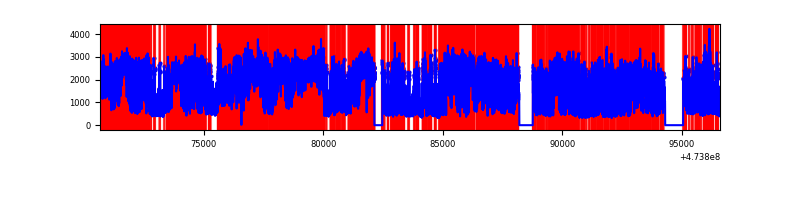 |
| D | 25937 | 24285 | 14299 | 14299 | 55.13% | 58.88% | 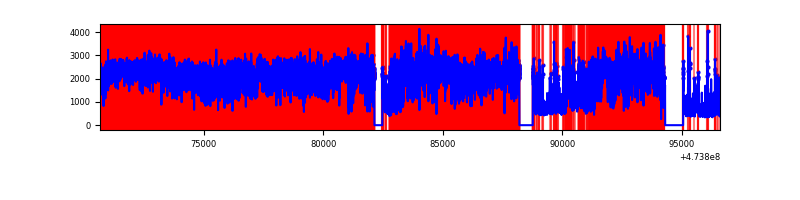 |
Top three noisy pixels from each quadrant. If the there are fewer than three noisy pixels in the level2.evt file, extra rows are filled as -1
| Pixel properties | Quadrant properties | ||||||
|---|---|---|---|---|---|---|---|
| Quadrant | DetID | PixID | Counts | Sigma | Mean | Median | Sigma |
| A | 4 | 3 | 1814542 | 2826.3 | 2582 | 2519 | 641.1 |
| A | 4 | 156 | 1083330 | 1685.79 | 2582 | 2519 | 641.1 |
| A | 10 | 253 | 611694 | 950.16 | 2582 | 2519 | 641.1 |
| B | 4 | 170 | 18531403 | 41250.64 | 2137 | 2064 | 449.2 |
| B | 10 | 44 | 3293122 | 7326.66 | 2137 | 2064 | 449.2 |
| B | 10 | 43 | 1573944 | 3499.37 | 2137 | 2064 | 449.2 |
| C | 15 | 127 | 7615868 | 13089.81 | 2039 | 2026 | 581.7 |
| C | 15 | 230 | 5924596 | 10182.16 | 2039 | 2026 | 581.7 |
| C | 15 | 148 | 1983523 | 3406.61 | 2039 | 2026 | 581.7 |
| D | 7 | 61 | 30652878 | 77521.73 | 1259 | 1201 | 395.4 |
| D | 7 | 126 | 2277993 | 5758.28 | 1259 | 1201 | 395.4 |
| D | 12 | 6 | 1441077 | 3641.62 | 1259 | 1201 | 395.4 |
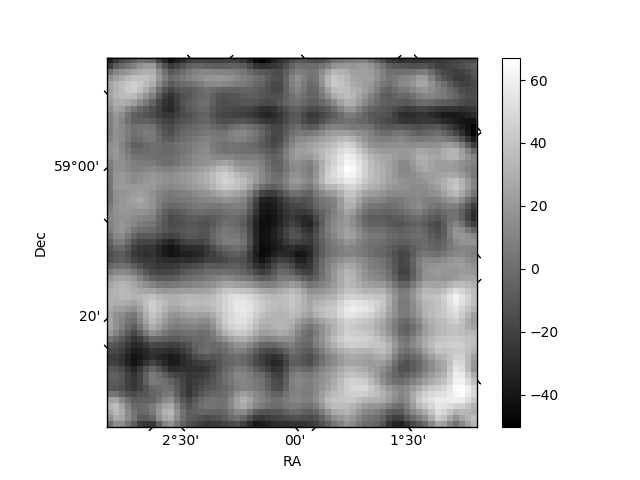
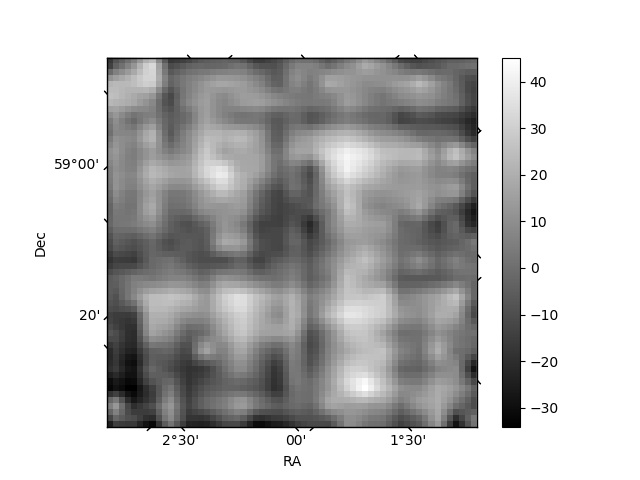
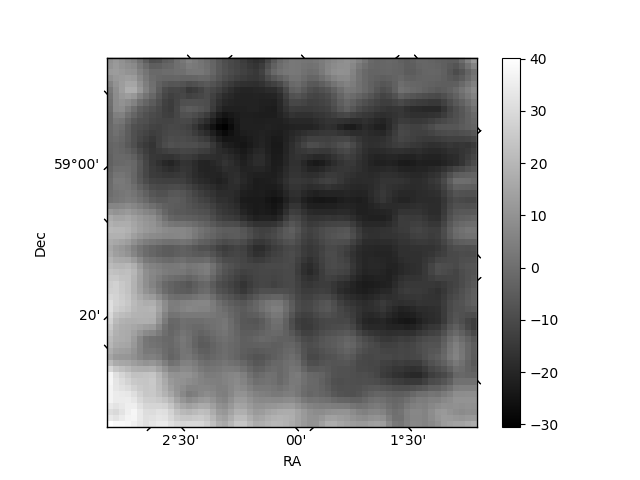
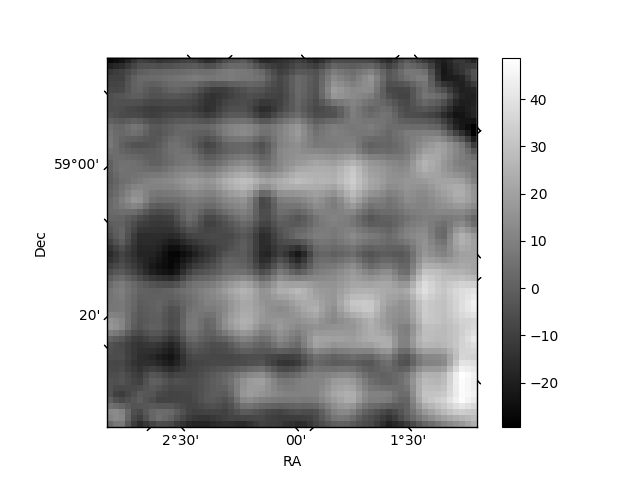
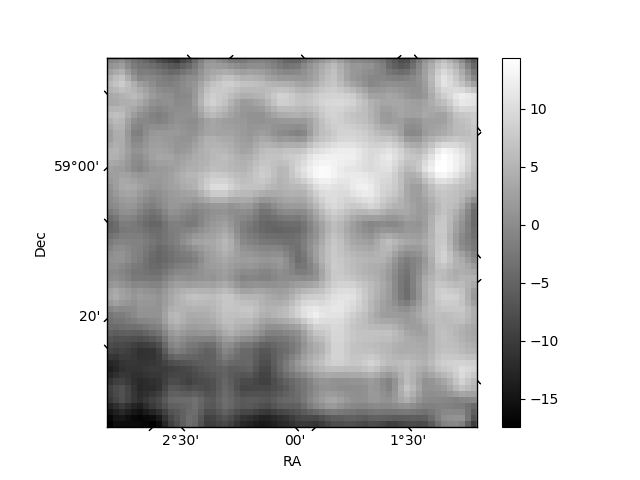
Histogram calculated using DETX and DETY for each event in the final _common_clean file
| Quadrant A | 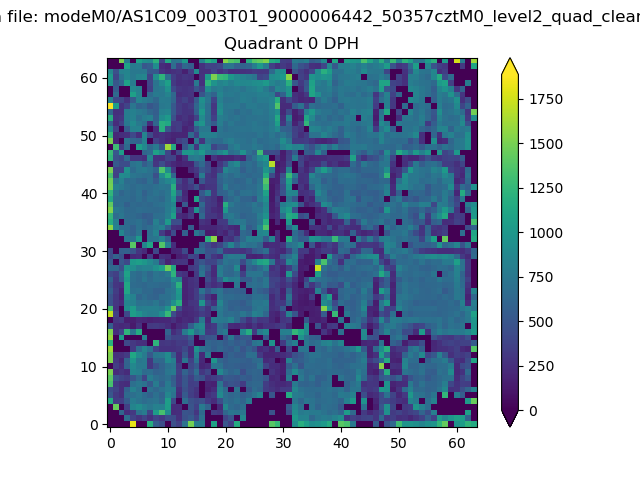 |
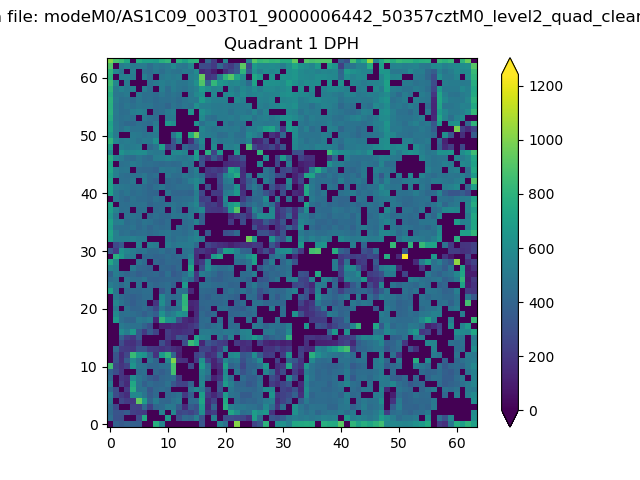 |
Quadrant B |
|---|---|---|---|
| Quadrant D |  |
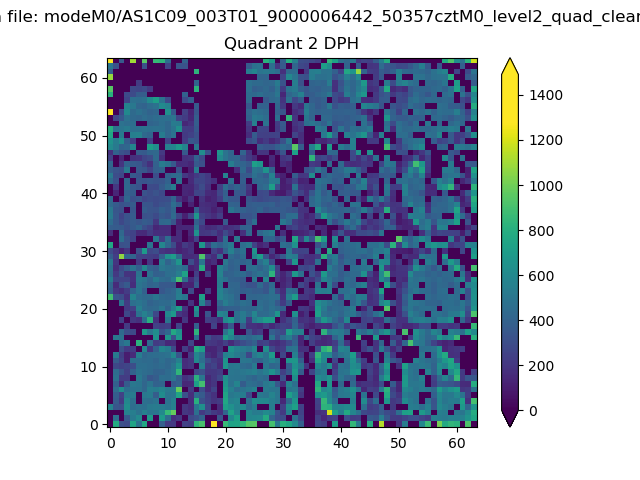 |
Quadrant C |
| Plot type | Count rate plots | Images |
|---|---|---|
| Comparison with Poisson distribution Blue bars denote a histogram of data divided into 1 sec bins. Red curve is a Poisson curve with rate = median count rate of data. |
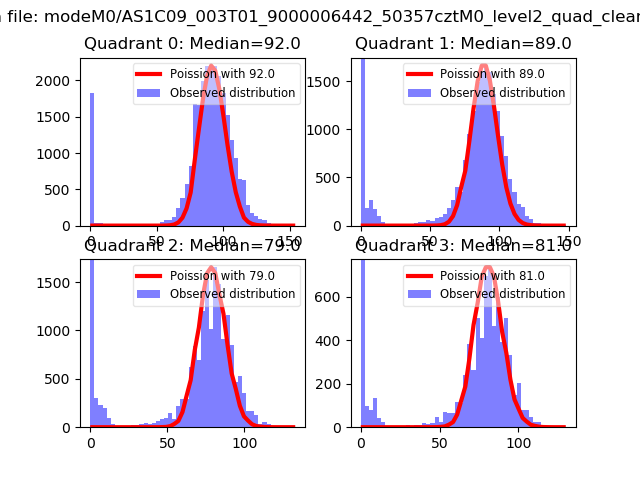 |
 |
| Quadrant-wise count rates Data is divided into 100 sec bins |
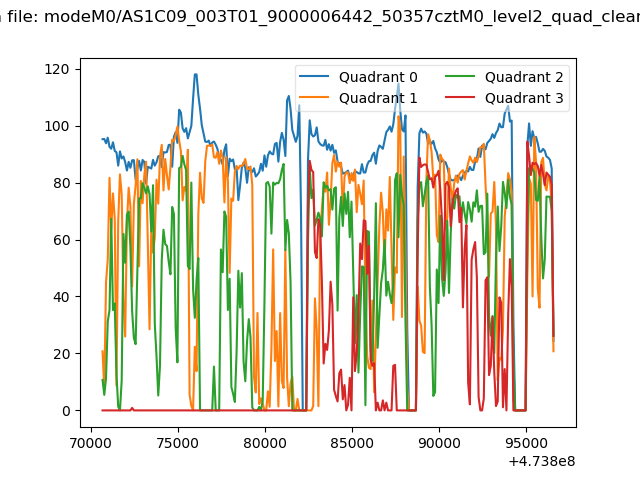 |
|
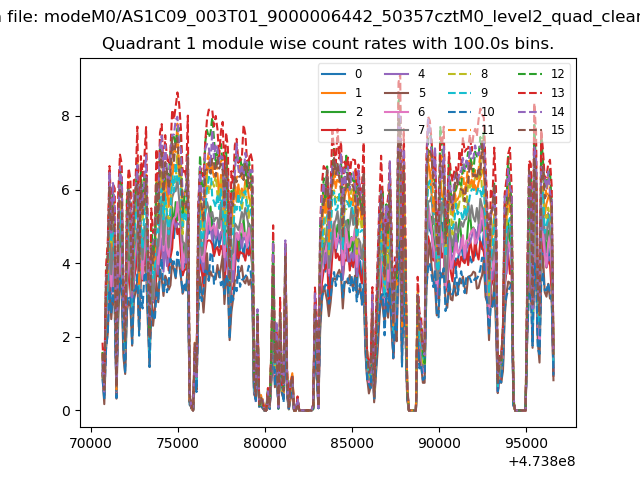
| Module-wise count rates for Quadrant A Data is divided into 100 sec bins |
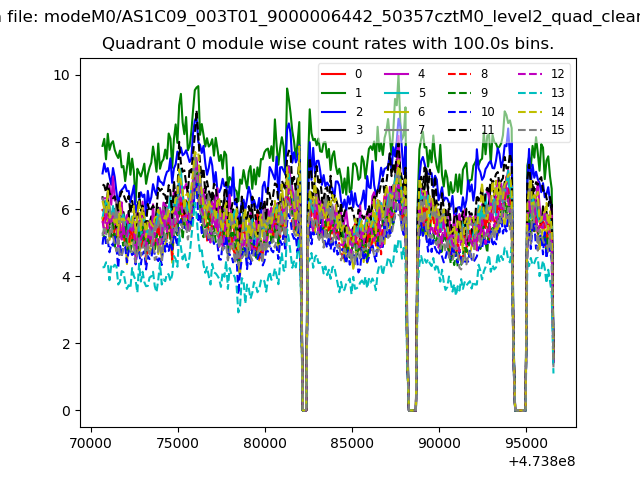 |
 |
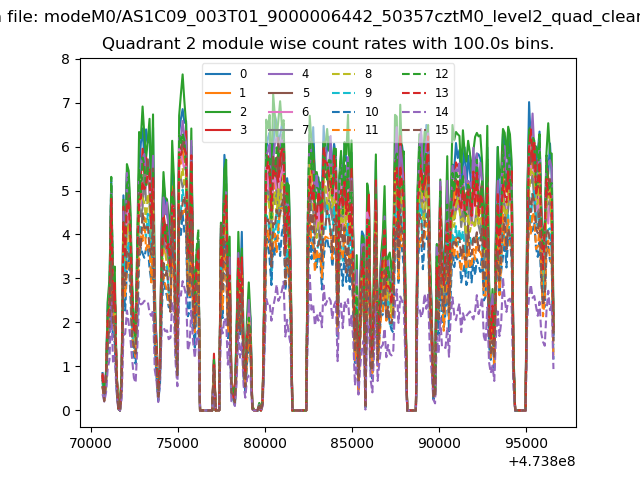
| Module-wise count rates for Quadrant B Data is divided into 100 sec bins |
 |
 |
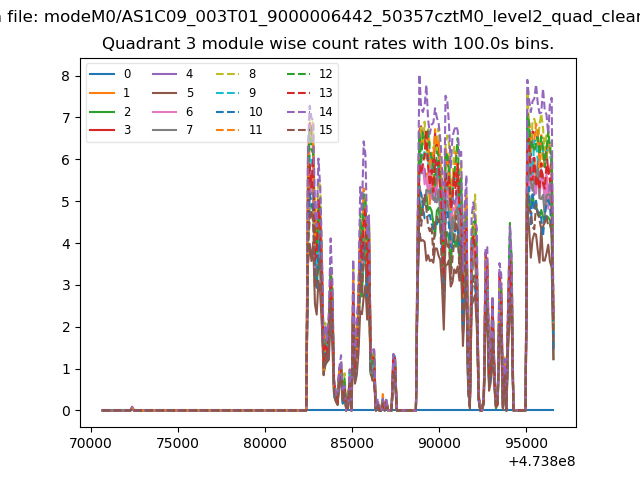
| Module-wise count rates for Quadrant C Data is divided into 100 sec bins |
 |
 |
| Module-wise count rates for Quadrant D Data is divided into 100 sec bins |
 |
 |
| Parameter | Plot |
|---|---|
| CZT HV Monitor | 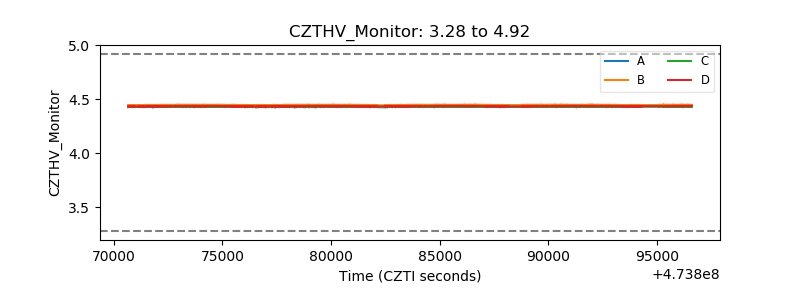 |
| D_VDD | 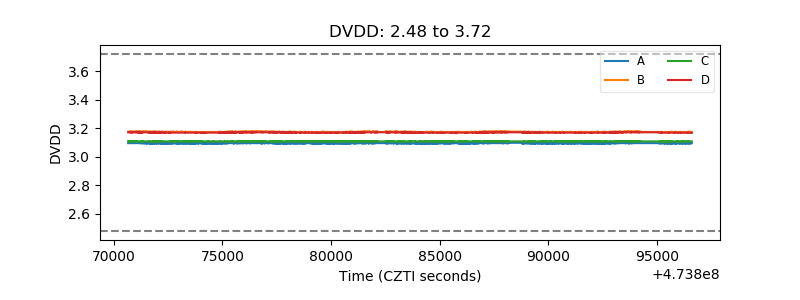 |
| Temperature 1 | 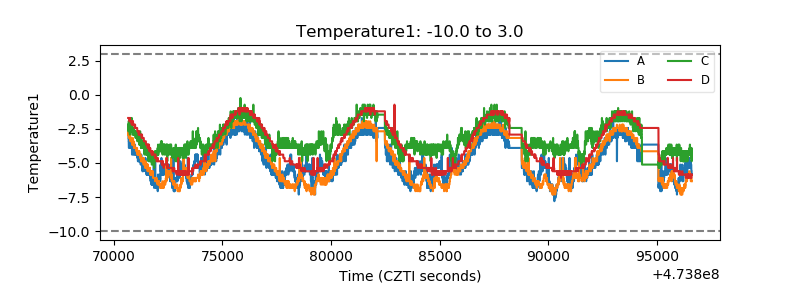 |
| Veto HV Monitor |  |
| Veto LLD | 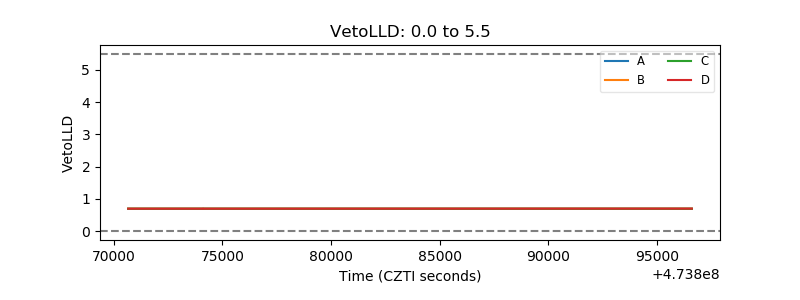 |
| Alpha Counter | 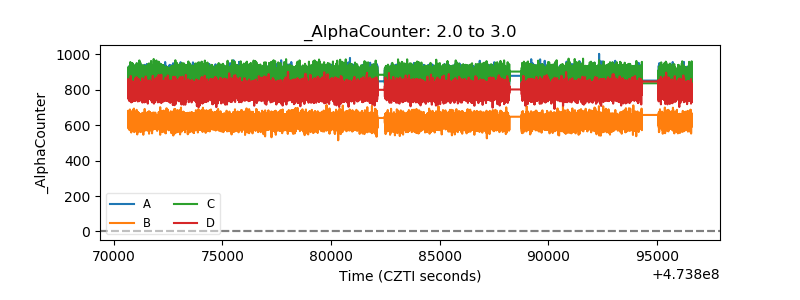 |
| _CPM_Rate | 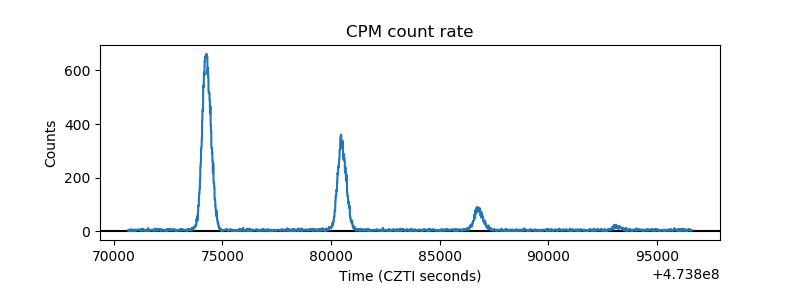 |
| CZT Counter | 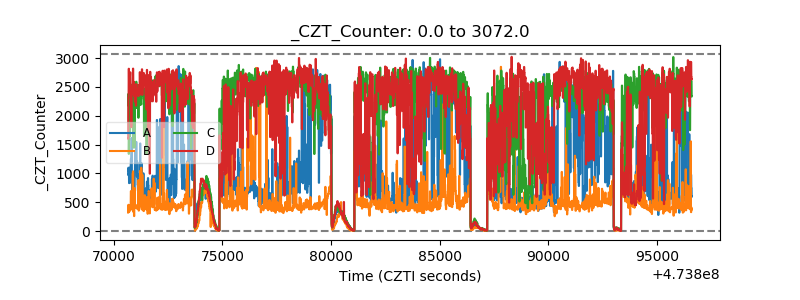 |
| +2.5 Volts monitor |  |
| +5 Volts monitor | 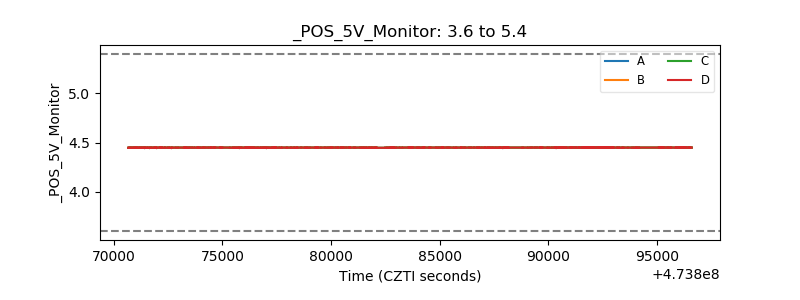 |
| _ROLL_ROT | 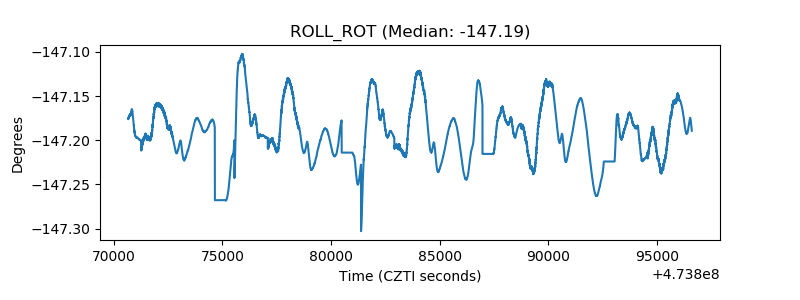 |
| _Roll_DEC | 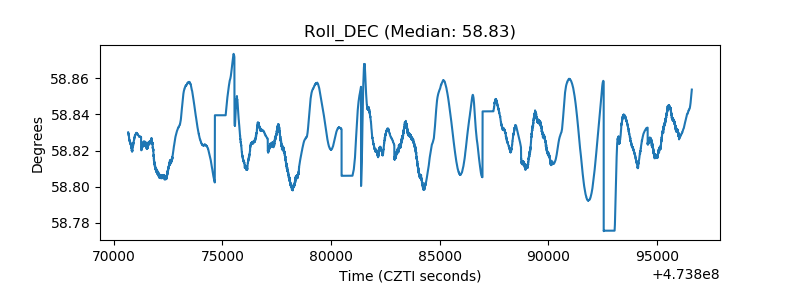 |
| _Roll_RA | 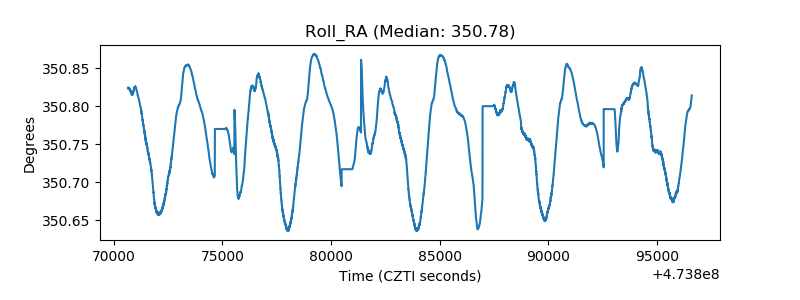 |
| Veto Counter | 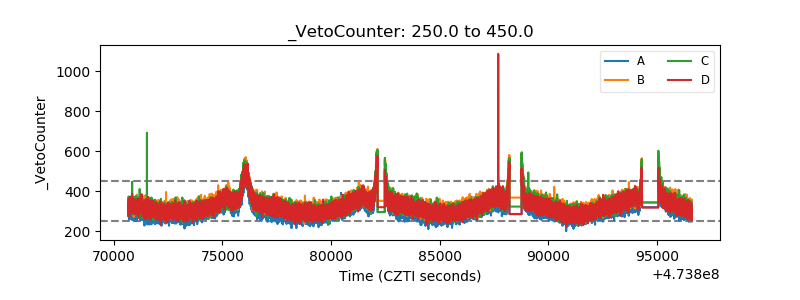 |