| Param | Original file | Final file |
|---|---|---|
| Filename | modeM0/AS1C09_003T01_9000006442_50358cztM0_level2.fits | modeM0/AS1C09_003T01_9000006442_50358cztM0_level2_quad_clean.evt |
| Size (bytes) | 873,866,880 | 81,584,640 |
| Size | 833.4 MB | 77.8 MB |
| Events in quadrant A | 5,308,140 | 584,281 |
| Events in quadrant B | 9,194,748 | 557,973 |
| Events in quadrant C | 8,861,506 | 447,082 |
| Events in quadrant D | 8,473,894 | 419,859 |
| Mode M9 | |||
|---|---|---|---|
| Quadrant | BADHDUFLAG | Total packets | Discarded packets |
| A | 0 | 9 | 0 |
| B | 0 | 9 | 0 |
| C | 0 | 9 | 0 |
| D | 0 | 9 | 0 |
| Mode M0 | |||
|---|---|---|---|
| Quadrant | BADHDUFLAG | Total packets | Discarded packets |
| A | 0 | 20633 | 1 |
| B | 0 | 31983 | 1 |
| C | 0 | 30931 | 1 |
| D | 0 | 29697 | 2 |
| Mode SS | |||
|---|---|---|---|
| Quadrant | BADHDUFLAG | Total packets | Discarded packets |
| A | 0 | 134 | 0 |
| B | 0 | 134 | 0 |
| C | 0 | 134 | 0 |
| D | 0 | 134 | 0 |
| Quadrant | Total seconds | Saturated seconds | Saturation percentage |
|---|---|---|---|
| A | 6605 | 337 | 5.102195% |
| B | 6606 | 1467 | 22.207084% |
| C | 6606 | 1893 | 28.655767% |
| D | 6605 | 1823 | 27.600303% |
Noise dominated data is calculated using 1-second bins in cleaned event files. If a bin has >2000 counts, and if more than 50% of those come from <1% of pixels, then it is considered to be noise-dominated and hence unusable.
| Quadrant | # 1 sec bins | Bins with >0 counts | Bins with >2000 counts | High rate bins dominated by noise | Noise dominated (total time) | Noise dominated (detector-on time) | Marked lightcurve |
|---|---|---|---|---|---|---|---|
| A | 7500 | 6606 | 241 | 241 | 3.21% | 3.65% | 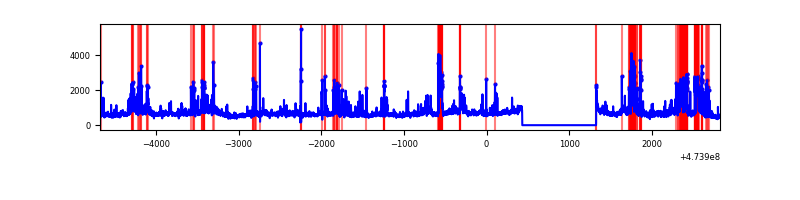 |
| B | 7501 | 6607 | 958 | 958 | 12.77% | 14.50% | 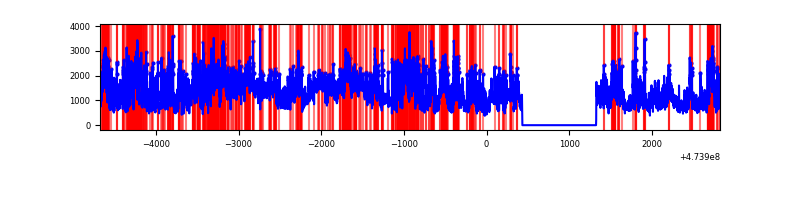 |
| C | 7501 | 6607 | 1447 | 1447 | 19.29% | 21.90% | 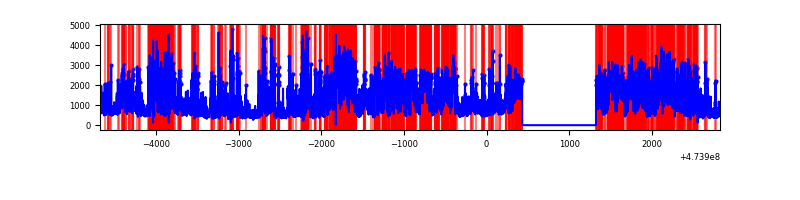 |
| D | 7500 | 6606 | 1642 | 1642 | 21.89% | 24.86% | 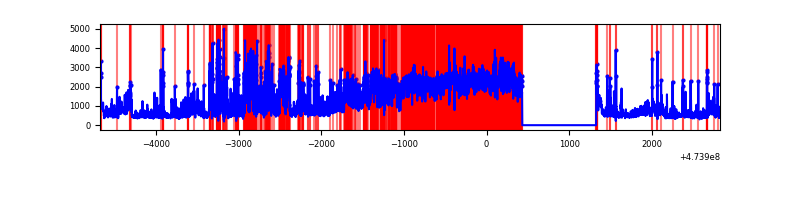 |
Top three noisy pixels from each quadrant. If the there are fewer than three noisy pixels in the level2.evt file, extra rows are filled as -1
| Pixel properties | Quadrant properties | ||||||
|---|---|---|---|---|---|---|---|
| Quadrant | DetID | PixID | Counts | Sigma | Mean | Median | Sigma |
| A | 4 | 3 | 1047107 | 6138.86 | 686 | 669 | 170.5 |
| A | 7 | 206 | 491407 | 2878.88 | 686 | 669 | 170.5 |
| A | 7 | 221 | 209957 | 1227.77 | 686 | 669 | 170.5 |
| B | 4 | 170 | 4378779 | 30970.52 | 655 | 632 | 141.4 |
| B | 10 | 44 | 1371563 | 9697.81 | 655 | 632 | 141.4 |
| B | 10 | 43 | 348080 | 2457.81 | 655 | 632 | 141.4 |
| C | 15 | 230 | 3285429 | 19441.77 | 599 | 593 | 169.0 |
| C | 15 | 232 | 907288 | 5366.4 | 599 | 593 | 169.0 |
| C | 5 | 65 | 427090 | 2524.28 | 599 | 593 | 169.0 |
| D | 7 | 61 | 2987333 | 17624.83 | 604 | 585 | 169.5 |
| D | 2 | 14 | 573718 | 3382.06 | 604 | 585 | 169.5 |
| D | 3 | 12 | 545023 | 3212.73 | 604 | 585 | 169.5 |
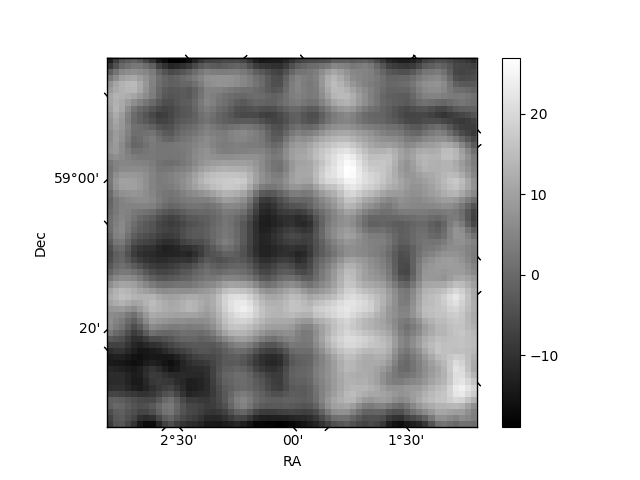
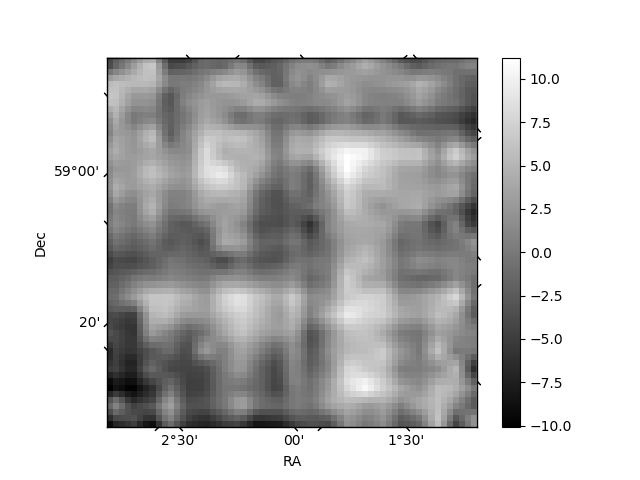
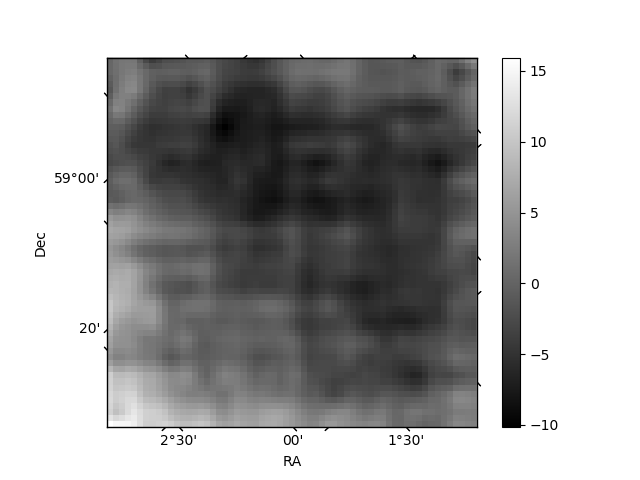
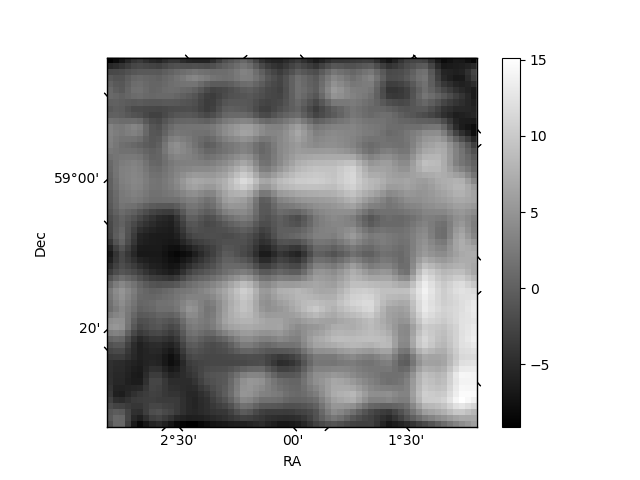
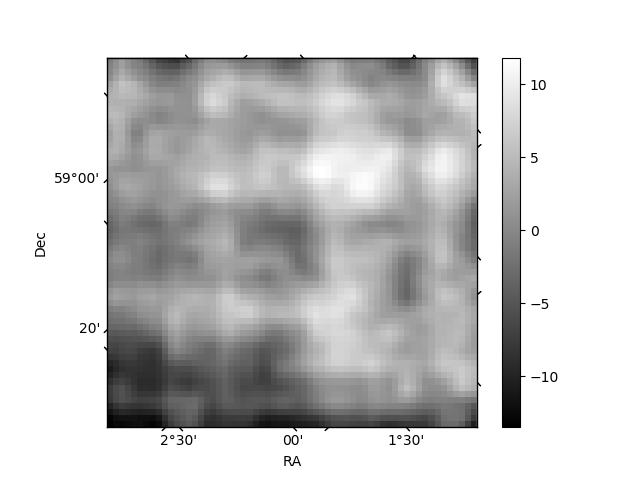
Histogram calculated using DETX and DETY for each event in the final _common_clean file
| Quadrant A | 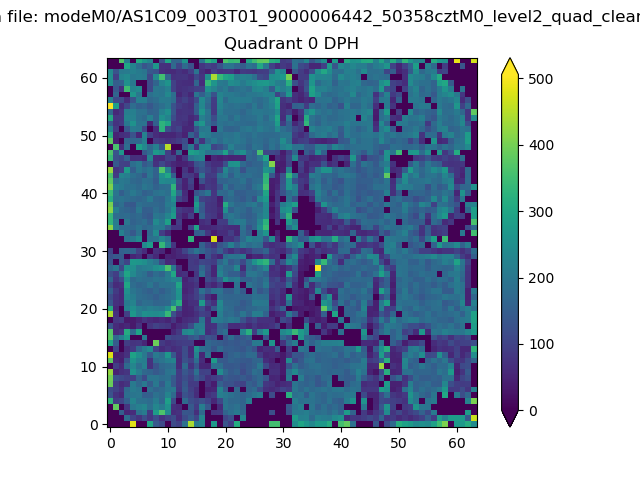 |
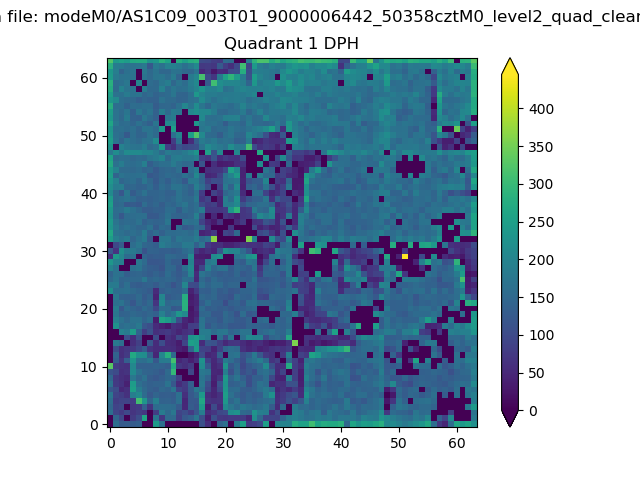 |
Quadrant B |
|---|---|---|---|
| Quadrant D | 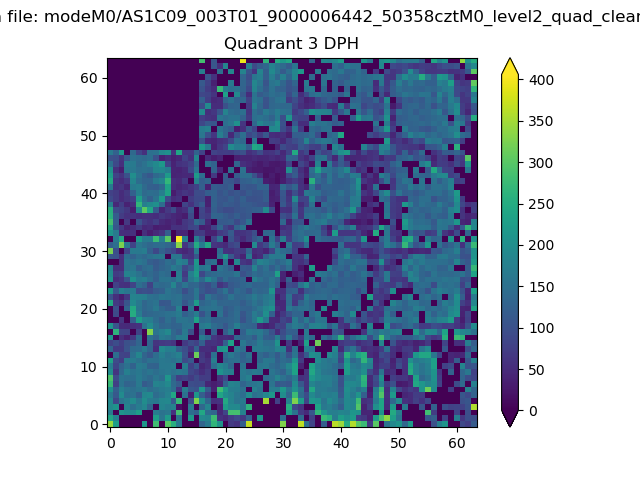 |
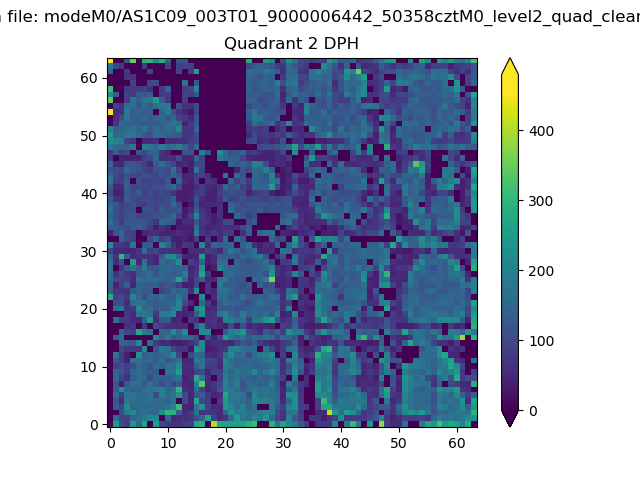 |
Quadrant C |
| Plot type | Count rate plots | Images |
|---|---|---|
| Comparison with Poisson distribution Blue bars denote a histogram of data divided into 1 sec bins. Red curve is a Poisson curve with rate = median count rate of data. |
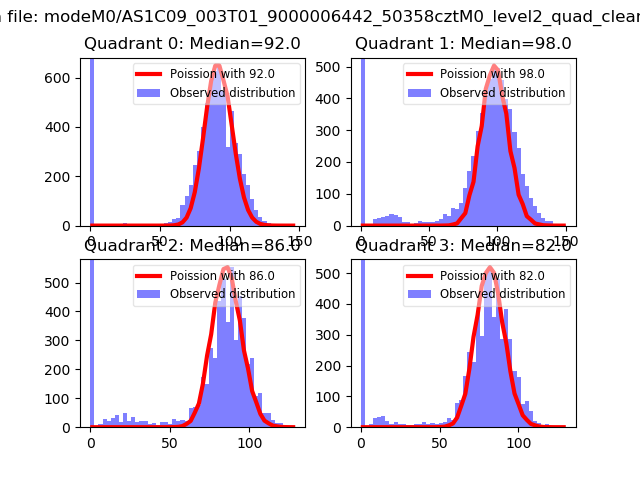 |
 |
| Quadrant-wise count rates Data is divided into 100 sec bins |
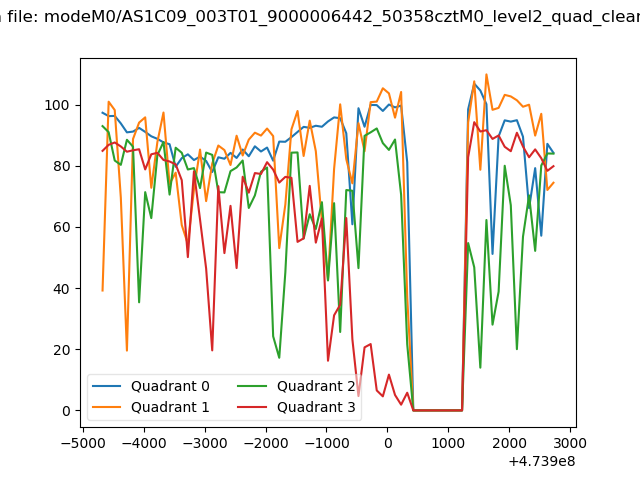 |
|
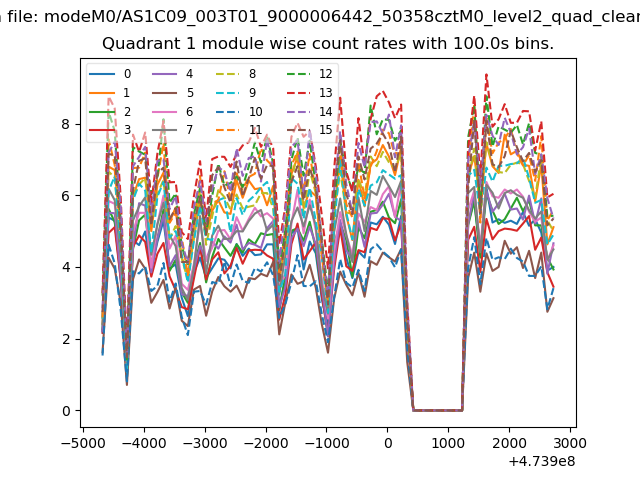
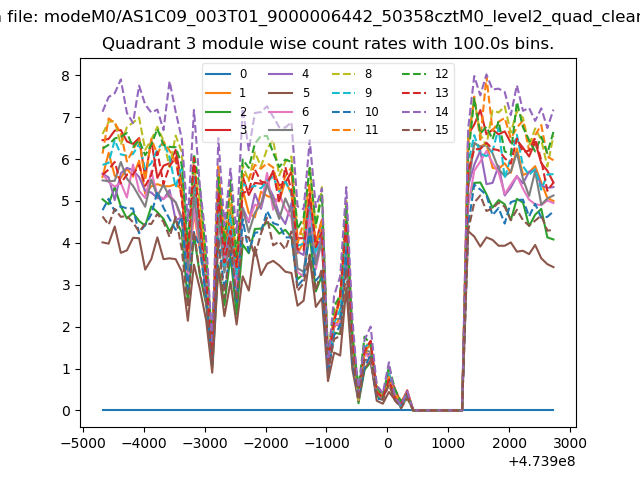
| Module-wise count rates for Quadrant A Data is divided into 100 sec bins |
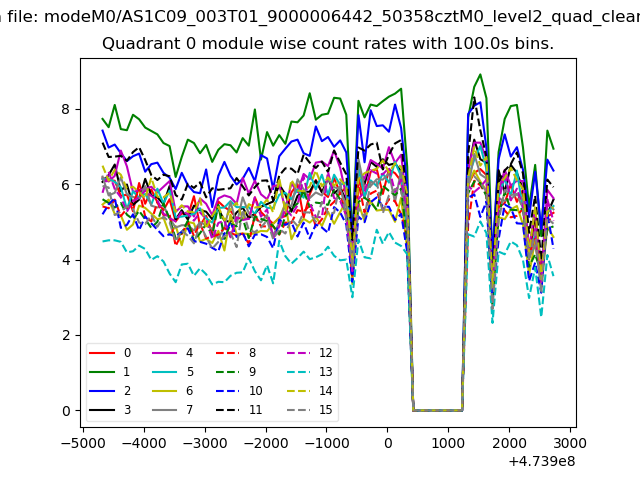 |
 |
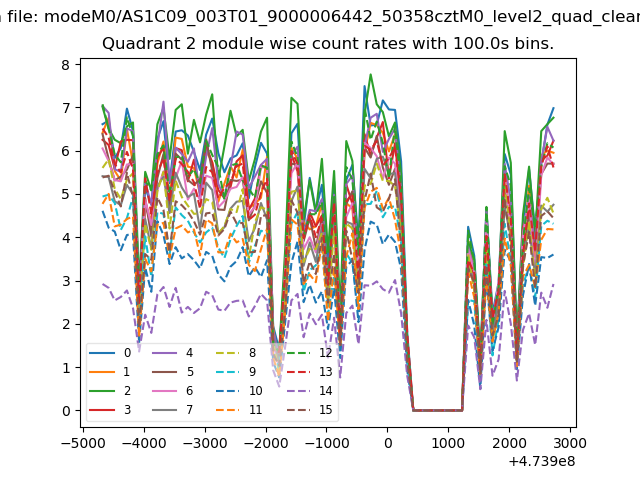
| Module-wise count rates for Quadrant B Data is divided into 100 sec bins |
 |
 |
| Module-wise count rates for Quadrant C Data is divided into 100 sec bins |
 |
 |
| Module-wise count rates for Quadrant D Data is divided into 100 sec bins |
 |
 |
| Parameter | Plot |
|---|---|
| CZT HV Monitor | 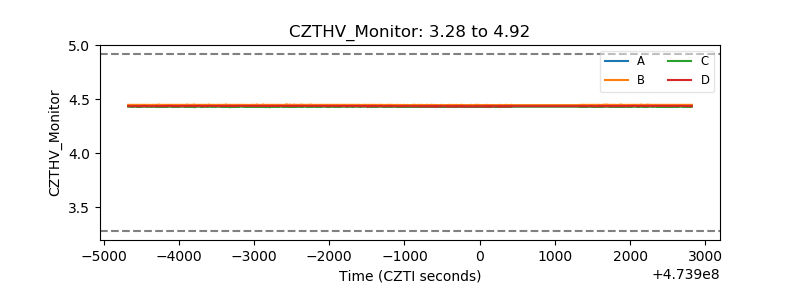 |
| D_VDD | 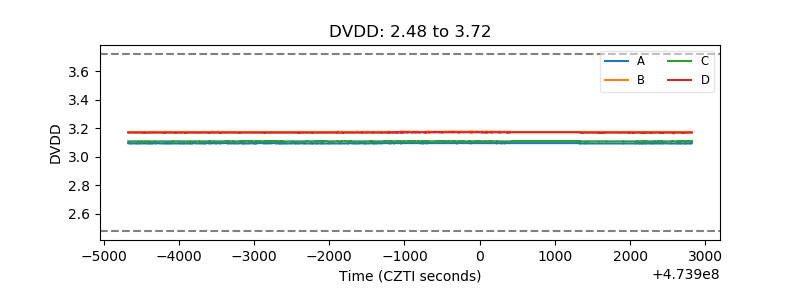 |
| Temperature 1 | 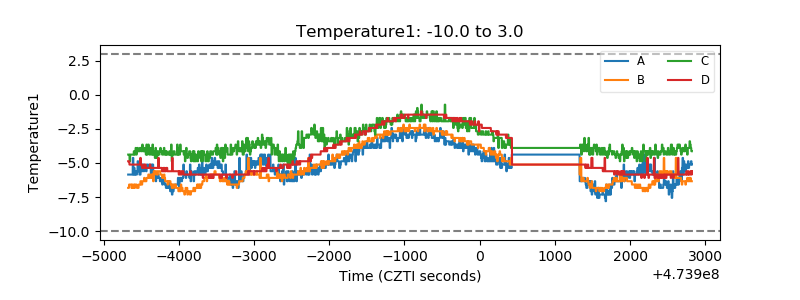 |
| Veto HV Monitor |  |
| Veto LLD | 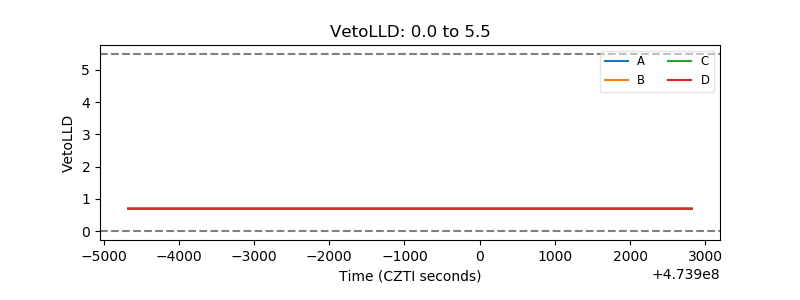 |
| Alpha Counter | 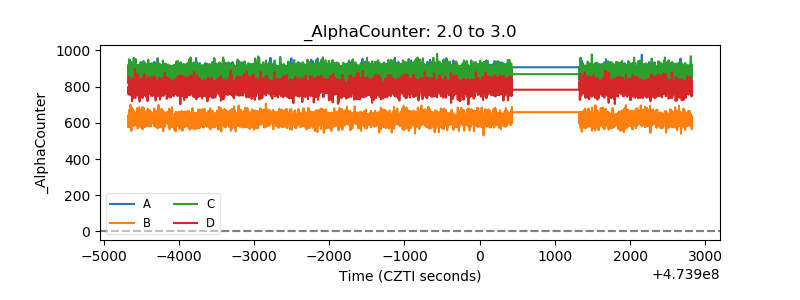 |
| _CPM_Rate | 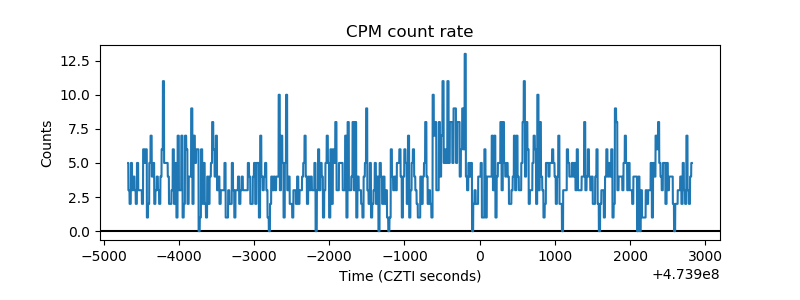 |
| CZT Counter | 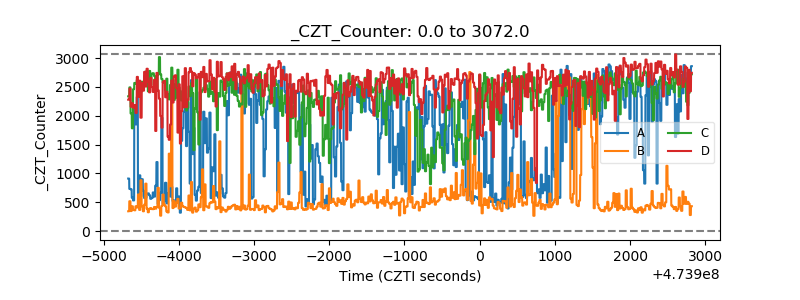 |
| +2.5 Volts monitor |  |
| +5 Volts monitor |  |
| _ROLL_ROT | 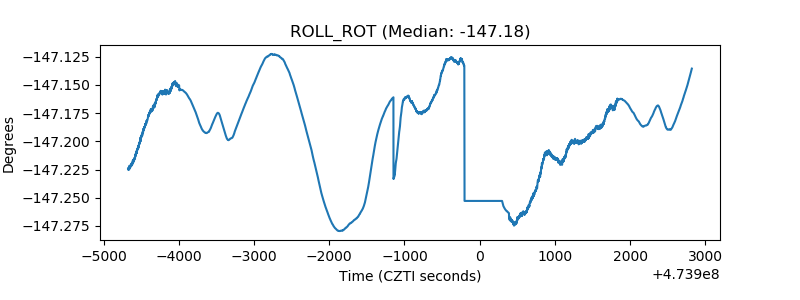 |
| _Roll_DEC | 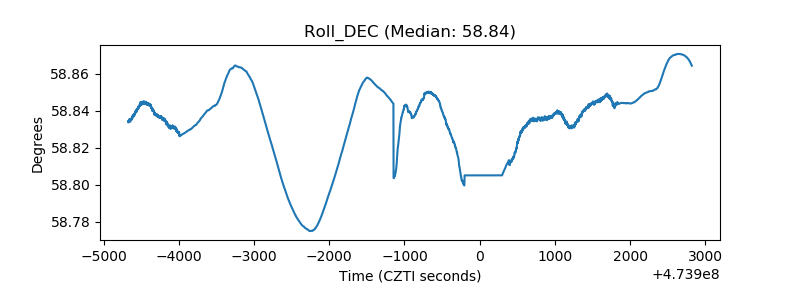 |
| _Roll_RA | 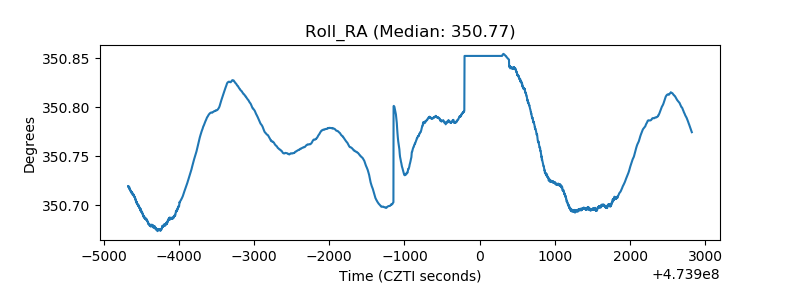 |
| Veto Counter | 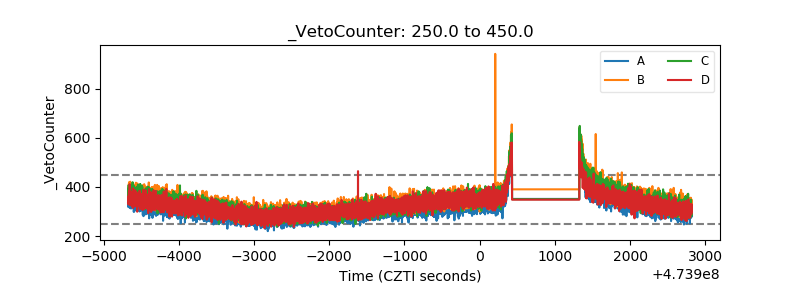 |