| Param | Original file | Final file |
|---|---|---|
| Filename | modeM0/AS1C09_003T01_9000006442_50360cztM0_level2.fits | modeM0/AS1C09_003T01_9000006442_50360cztM0_level2_quad_clean.evt |
| Size (bytes) | 895,487,040 | 79,539,840 |
| Size | 854.0 MB | 75.9 MB |
| Events in quadrant A | 5,506,403 | 600,402 |
| Events in quadrant B | 8,506,047 | 564,929 |
| Events in quadrant C | 10,331,191 | 365,331 |
| Events in quadrant D | 8,295,408 | 417,508 |
| Mode M9 | |||
|---|---|---|---|
| Quadrant | BADHDUFLAG | Total packets | Discarded packets |
| A | 0 | 11 | 0 |
| B | 0 | 11 | 0 |
| C | 0 | 11 | 0 |
| D | 0 | 11 | 0 |
| Mode M0 | |||
|---|---|---|---|
| Quadrant | BADHDUFLAG | Total packets | Discarded packets |
| A | 0 | 21009 | 2 |
| B | 0 | 29892 | 2 |
| C | 0 | 35175 | 2 |
| D | 0 | 29135 | 2 |
| Mode SS | |||
|---|---|---|---|
| Quadrant | BADHDUFLAG | Total packets | Discarded packets |
| A | 0 | 134 | 0 |
| B | 0 | 134 | 0 |
| C | 0 | 134 | 0 |
| D | 0 | 134 | 0 |
| Quadrant | Total seconds | Saturated seconds | Saturation percentage |
|---|---|---|---|
| A | 6590 | 302 | 4.582701% |
| B | 6591 | 1457 | 22.105902% |
| C | 6591 | 2953 | 44.803520% |
| D | 6591 | 1944 | 29.494766% |
Noise dominated data is calculated using 1-second bins in cleaned event files. If a bin has >2000 counts, and if more than 50% of those come from <1% of pixels, then it is considered to be noise-dominated and hence unusable.
| Quadrant | # 1 sec bins | Bins with >0 counts | Bins with >2000 counts | High rate bins dominated by noise | Noise dominated (total time) | Noise dominated (detector-on time) | Marked lightcurve |
|---|---|---|---|---|---|---|---|
| A | 7625 | 6591 | 225 | 225 | 2.95% | 3.41% | 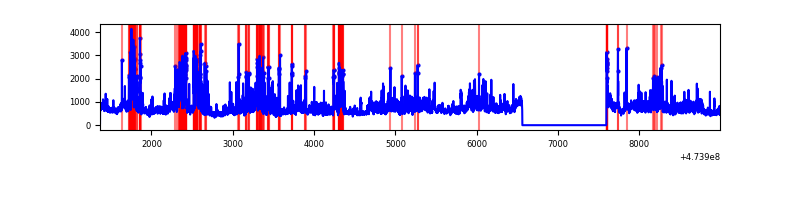 |
| B | 7626 | 6592 | 999 | 999 | 13.10% | 15.15% | 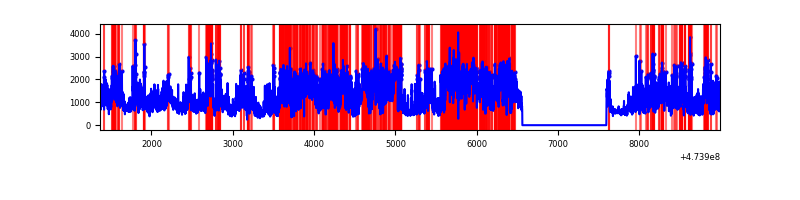 |
| C | 7626 | 6592 | 2073 | 2073 | 27.18% | 31.45% | 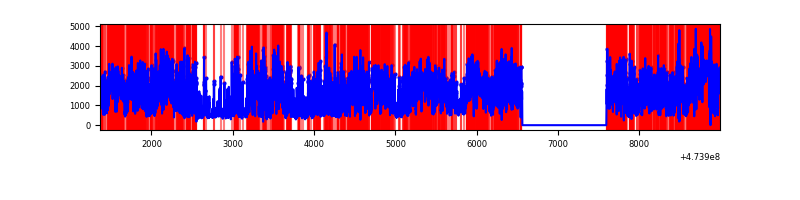 |
| D | 7626 | 6592 | 1815 | 1815 | 23.80% | 27.53% | 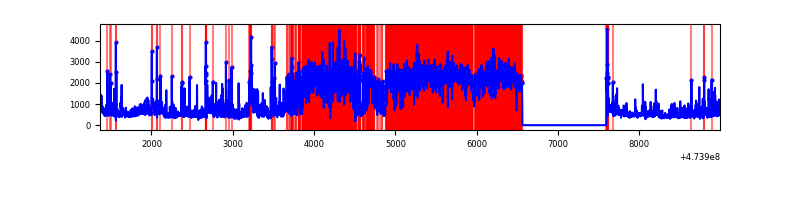 |
Top three noisy pixels from each quadrant. If the there are fewer than three noisy pixels in the level2.evt file, extra rows are filled as -1
| Pixel properties | Quadrant properties | ||||||
|---|---|---|---|---|---|---|---|
| Quadrant | DetID | PixID | Counts | Sigma | Mean | Median | Sigma |
| A | 4 | 3 | 797801 | 4554.74 | 697 | 680 | 175.0 |
| A | 7 | 206 | 632639 | 3611.01 | 697 | 680 | 175.0 |
| A | 10 | 253 | 258030 | 1470.5 | 697 | 680 | 175.0 |
| B | 4 | 170 | 3806257 | 26715.4 | 665 | 641 | 142.5 |
| B | 10 | 44 | 1001658 | 7027.13 | 665 | 641 | 142.5 |
| B | 4 | 206 | 298636 | 2091.92 | 665 | 641 | 142.5 |
| C | 15 | 230 | 5440381 | 35282.18 | 545 | 540 | 154.2 |
| C | 15 | 232 | 1088886 | 7058.89 | 545 | 540 | 154.2 |
| C | 0 | 208 | 285340 | 1847.18 | 545 | 540 | 154.2 |
| D | 7 | 61 | 4070651 | 24244.7 | 601 | 580 | 167.9 |
| D | 12 | 6 | 261212 | 1552.54 | 601 | 580 | 167.9 |
| D | 6 | 42 | 150815 | 894.92 | 601 | 580 | 167.9 |
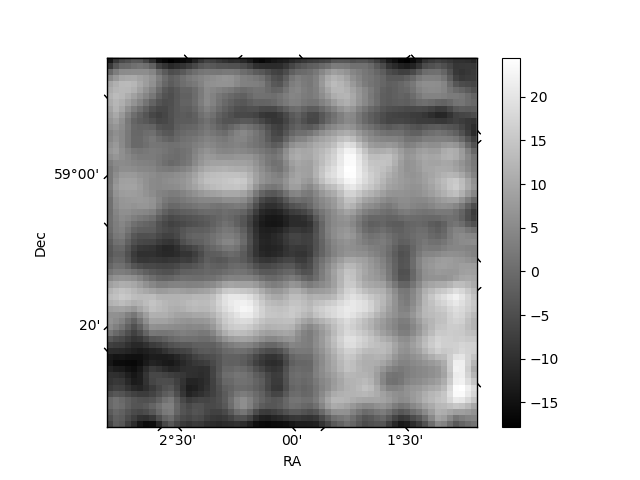
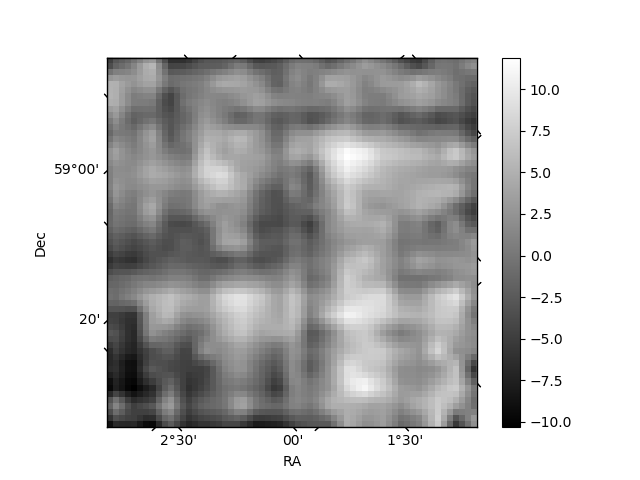
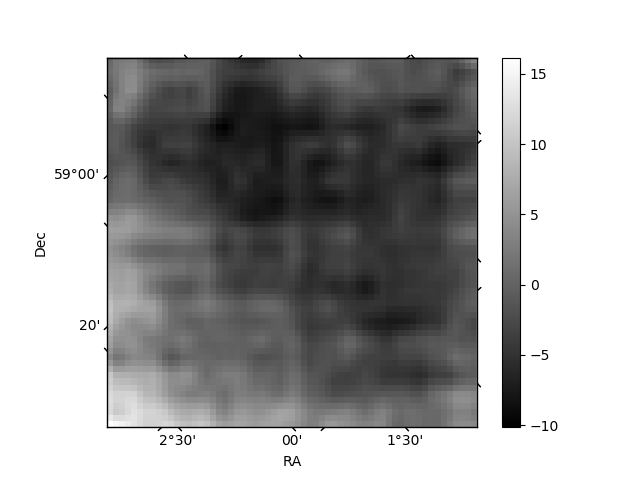
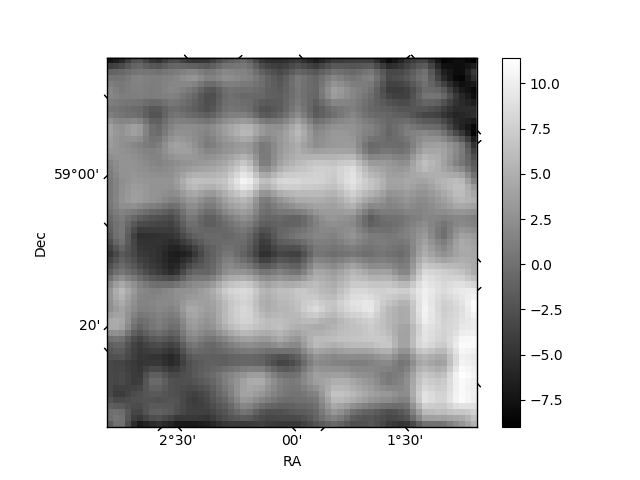
Histogram calculated using DETX and DETY for each event in the final _common_clean file
| Quadrant A | 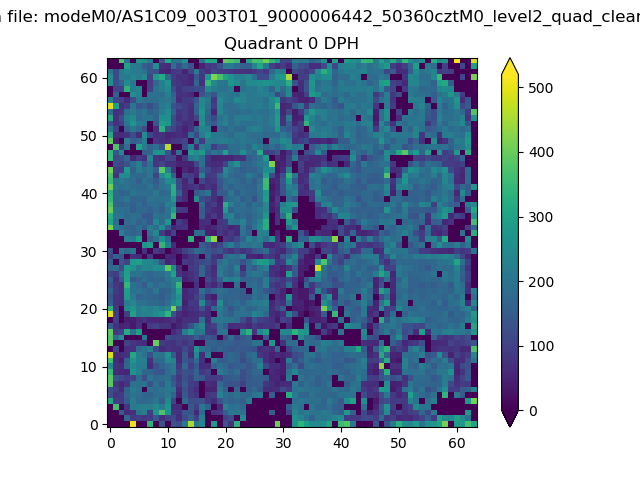 |
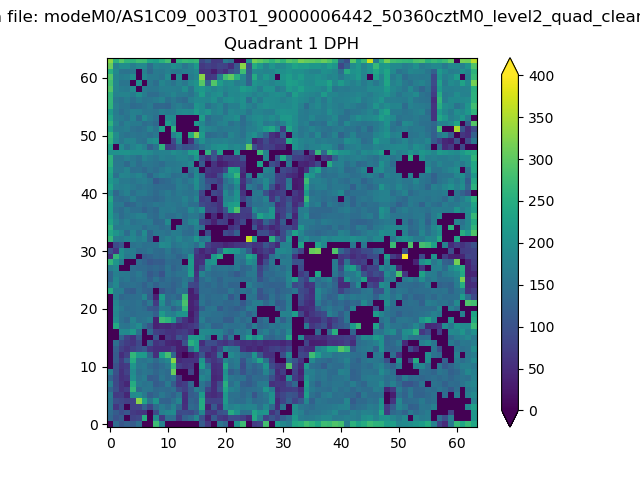 |
Quadrant B |
|---|---|---|---|
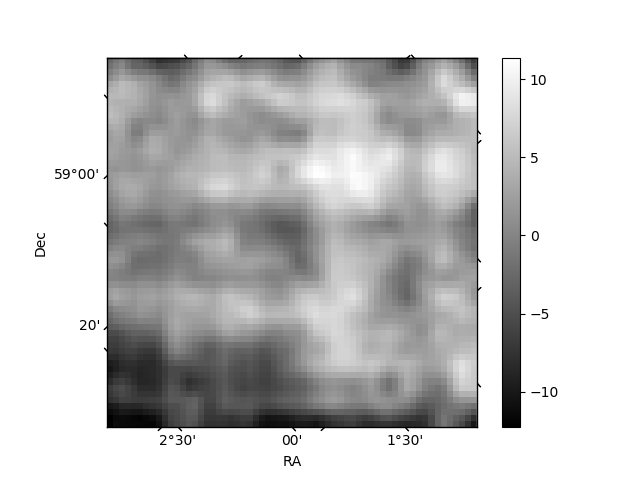
| Quadrant D | 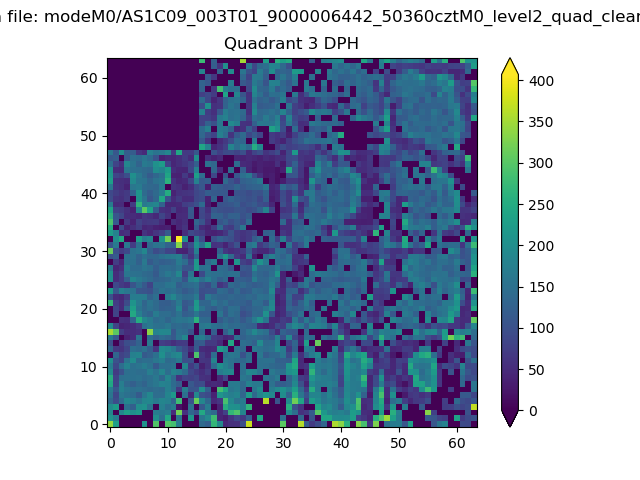 |
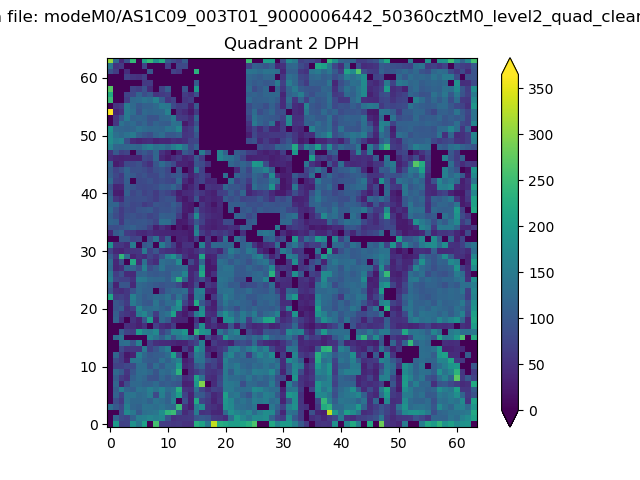 |
Quadrant C |
| Plot type | Count rate plots | Images |
|---|---|---|
| Comparison with Poisson distribution Blue bars denote a histogram of data divided into 1 sec bins. Red curve is a Poisson curve with rate = median count rate of data. |
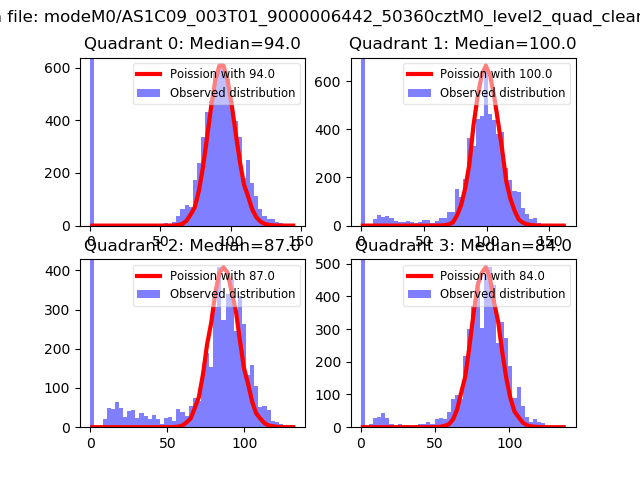 |
 |
| Quadrant-wise count rates Data is divided into 100 sec bins |
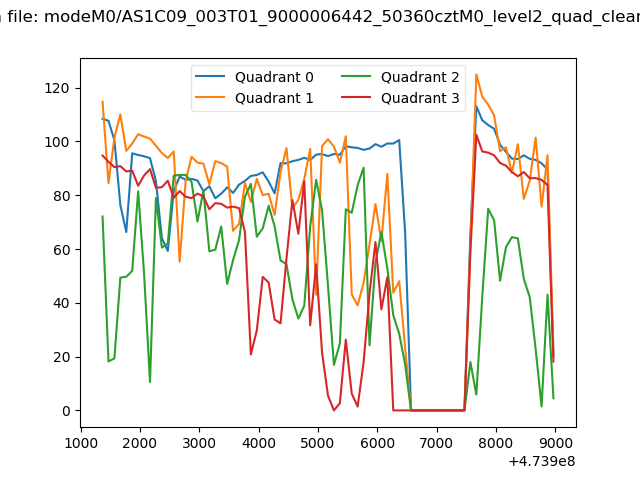 |
|
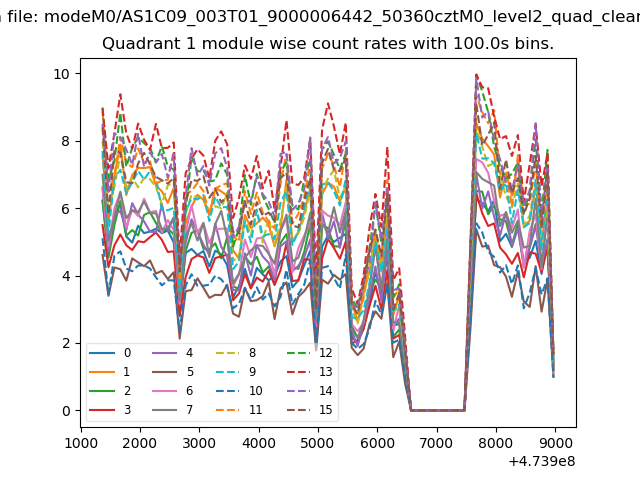
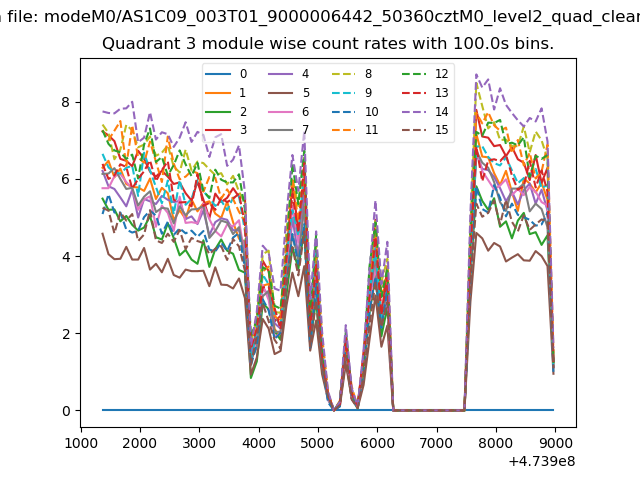
| Module-wise count rates for Quadrant A Data is divided into 100 sec bins |
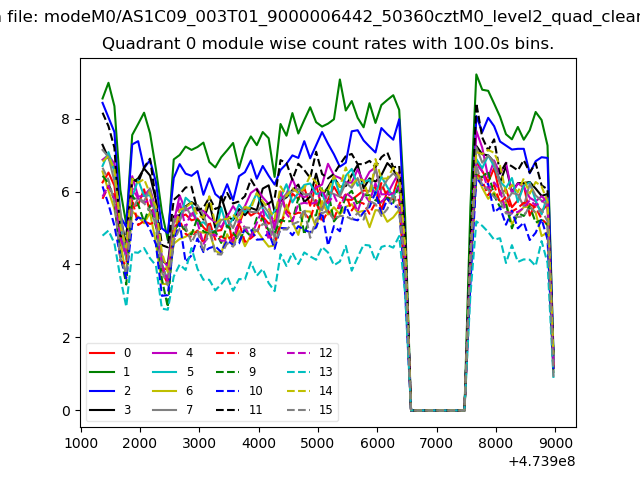 |
 |
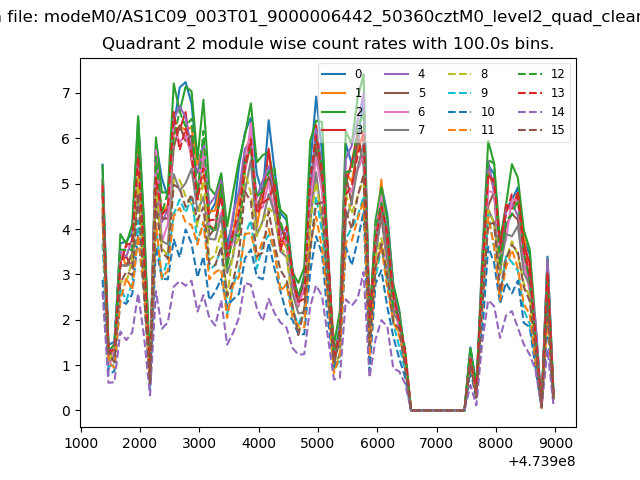
| Module-wise count rates for Quadrant B Data is divided into 100 sec bins |
 |
 |
| Module-wise count rates for Quadrant C Data is divided into 100 sec bins |
 |
 |
| Module-wise count rates for Quadrant D Data is divided into 100 sec bins |
 |
 |
| Parameter | Plot |
|---|---|
| CZT HV Monitor | 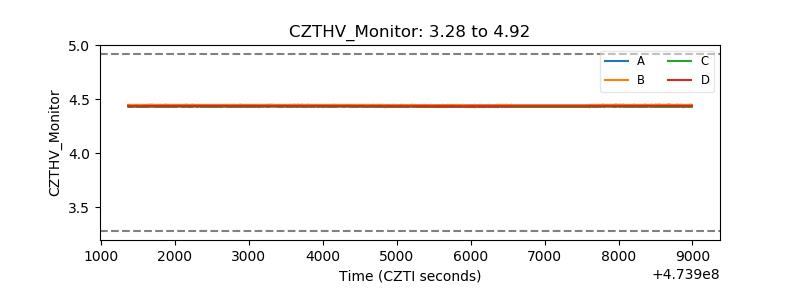 |
| D_VDD | 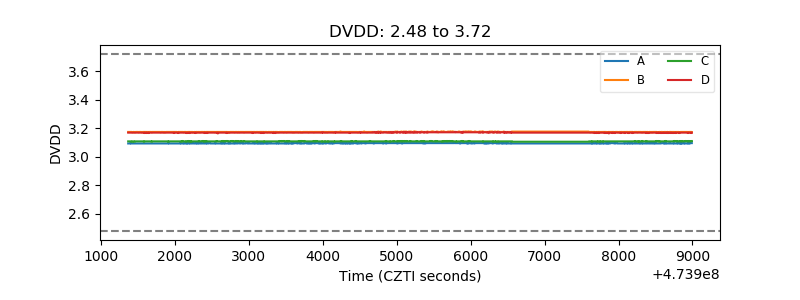 |
| Temperature 1 | 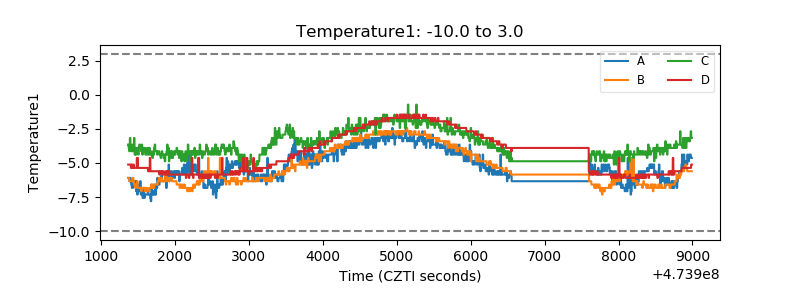 |
| Veto HV Monitor | 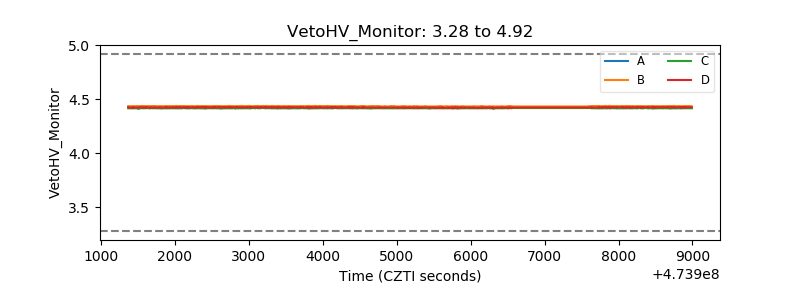 |
| Veto LLD | 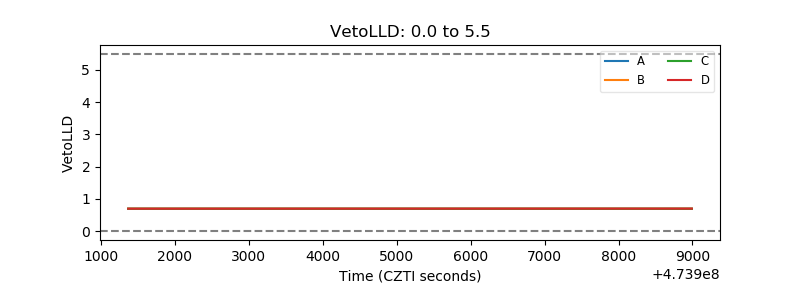 |
| Alpha Counter | 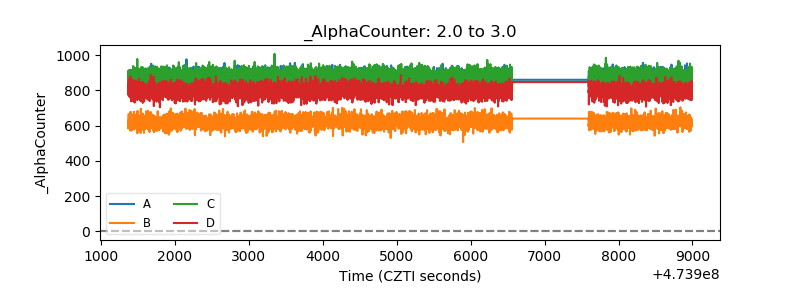 |
| _CPM_Rate | 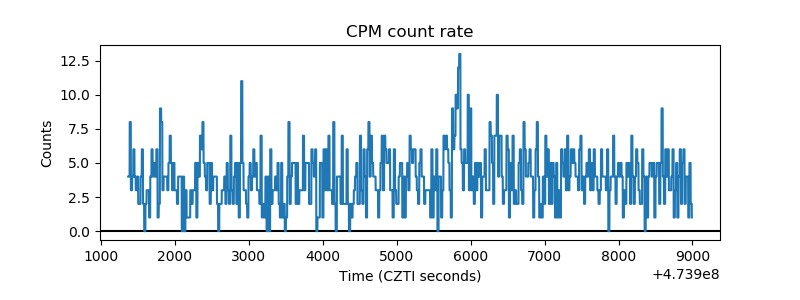 |
| CZT Counter | 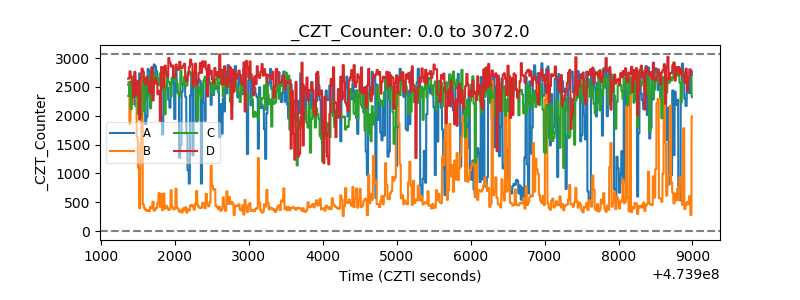 |
| +2.5 Volts monitor |  |
| +5 Volts monitor | 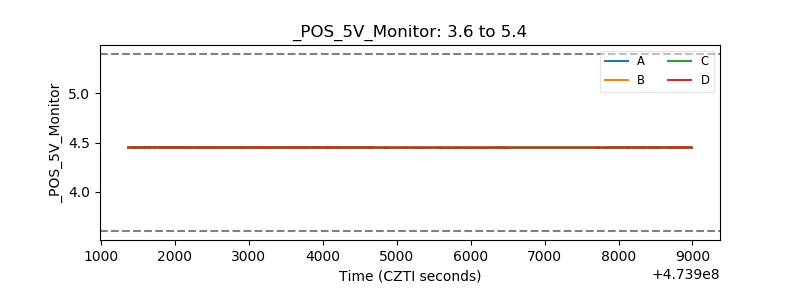 |
| _ROLL_ROT | 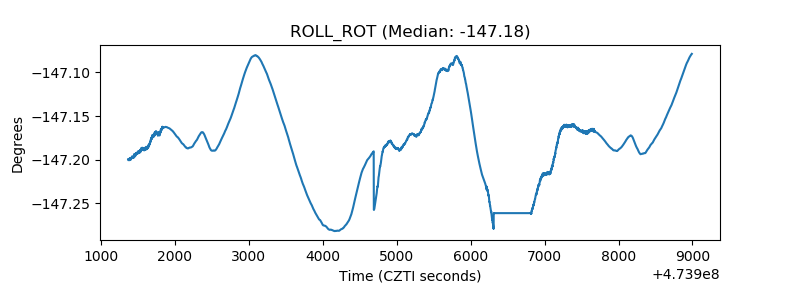 |
| _Roll_DEC | 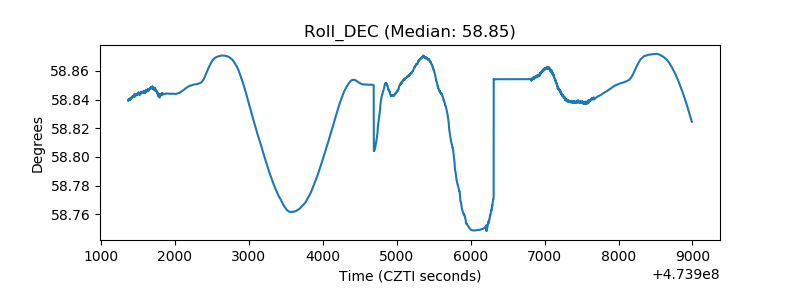 |
| _Roll_RA | 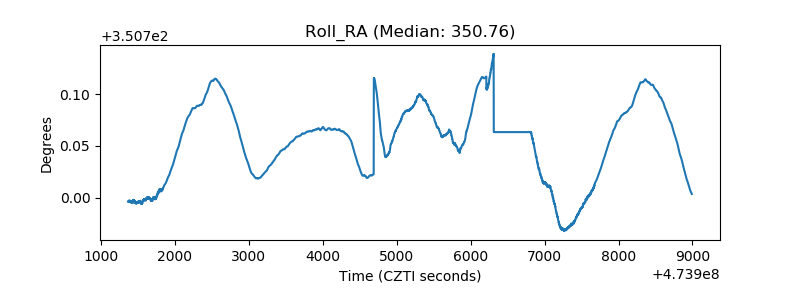 |
| Veto Counter | 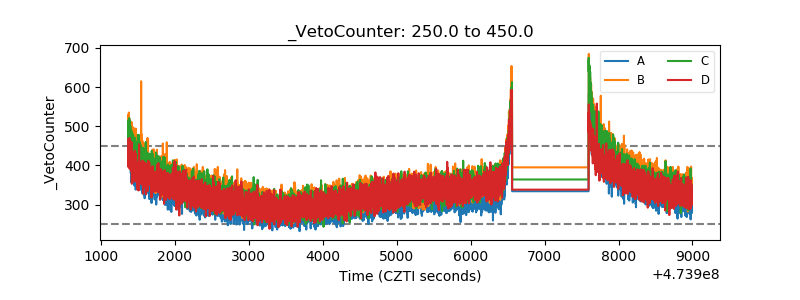 |