| Param | Original file | Final file |
|---|---|---|
| Filename | modeM0/AS1C09_003T01_9000006442_50364cztM0_level2.fits | modeM0/AS1C09_003T01_9000006442_50364cztM0_level2_quad_clean.evt |
| Size (bytes) | 774,227,520 | 77,209,920 |
| Size | 738.4 MB | 73.6 MB |
| Events in quadrant A | 4,048,363 | 583,384 |
| Events in quadrant B | 8,000,721 | 508,371 |
| Events in quadrant C | 6,157,409 | 510,989 |
| Events in quadrant D | 9,973,707 | 302,527 |
| Mode M9 | |||
|---|---|---|---|
| Quadrant | BADHDUFLAG | Total packets | Discarded packets |
| A | 0 | 9 | 0 |
| B | 0 | 9 | 0 |
| C | 0 | 9 | 0 |
| D | 0 | 9 | 0 |
| Mode M0 | |||
|---|---|---|---|
| Quadrant | BADHDUFLAG | Total packets | Discarded packets |
| A | 0 | 16028 | 1 |
| B | 0 | 28084 | 1 |
| C | 0 | 22596 | 2 |
| D | 0 | 33829 | 1 |
| Mode SS | |||
|---|---|---|---|
| Quadrant | BADHDUFLAG | Total packets | Discarded packets |
| A | 0 | 126 | 0 |
| B | 0 | 126 | 0 |
| C | 0 | 126 | 0 |
| D | 0 | 126 | 0 |
| Quadrant | Total seconds | Saturated seconds | Saturation percentage |
|---|---|---|---|
| A | 6191 | 264 | 4.264255% |
| B | 6191 | 1649 | 26.635439% |
| C | 6191 | 826 | 13.341948% |
| D | 6191 | 2937 | 47.439832% |
Noise dominated data is calculated using 1-second bins in cleaned event files. If a bin has >2000 counts, and if more than 50% of those come from <1% of pixels, then it is considered to be noise-dominated and hence unusable.
| Quadrant | # 1 sec bins | Bins with >0 counts | Bins with >2000 counts | High rate bins dominated by noise | Noise dominated (total time) | Noise dominated (detector-on time) | Marked lightcurve |
|---|---|---|---|---|---|---|---|
| A | 7106 | 6192 | 106 | 106 | 1.49% | 1.71% | 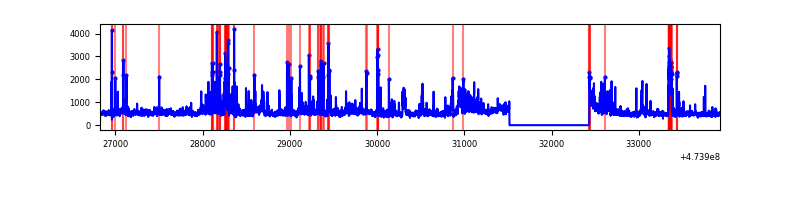 |
| B | 7106 | 6192 | 1072 | 1072 | 15.09% | 17.31% | 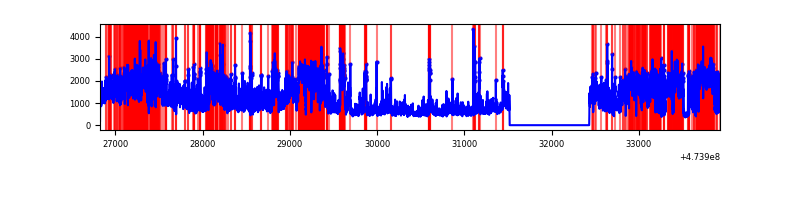 |
| C | 7106 | 6192 | 577 | 577 | 8.12% | 9.32% | 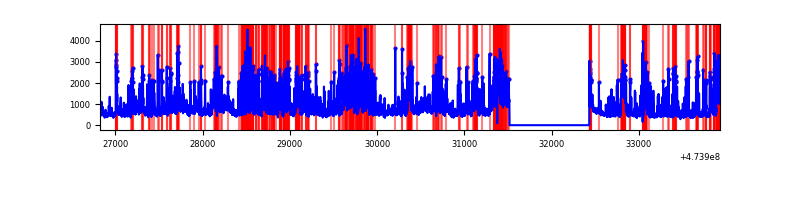 |
| D | 7106 | 6192 | 2429 | 2429 | 34.18% | 39.23% | 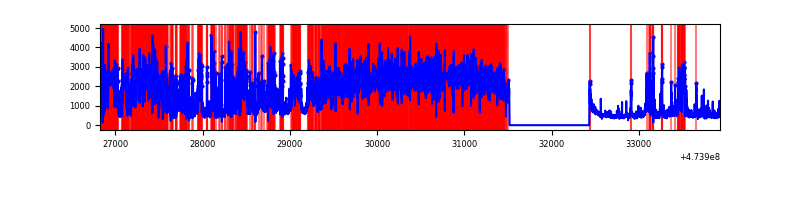 |
Top three noisy pixels from each quadrant. If the there are fewer than three noisy pixels in the level2.evt file, extra rows are filled as -1
| Pixel properties | Quadrant properties | ||||||
|---|---|---|---|---|---|---|---|
| Quadrant | DetID | PixID | Counts | Sigma | Mean | Median | Sigma |
| A | 8 | 248 | 258382 | 1550.52 | 669 | 652 | 166.2 |
| A | 4 | 3 | 193735 | 1161.6 | 669 | 652 | 166.2 |
| A | 3 | 14 | 145718 | 872.73 | 669 | 652 | 166.2 |
| B | 4 | 170 | 3798687 | 29204.51 | 613 | 591 | 130.1 |
| B | 12 | 0 | 420454 | 3228.43 | 613 | 591 | 130.1 |
| B | 5 | 172 | 355127 | 2726.11 | 613 | 591 | 130.1 |
| C | 15 | 230 | 1091271 | 6377.47 | 616 | 612 | 171.0 |
| C | 0 | 208 | 673750 | 3936.07 | 616 | 612 | 171.0 |
| C | 10 | 171 | 456923 | 2668.21 | 616 | 612 | 171.0 |
| D | 7 | 61 | 3035796 | 21968.6 | 494 | 477 | 138.2 |
| D | 3 | 12 | 2392488 | 17312.56 | 494 | 477 | 138.2 |
| D | 7 | 126 | 595194 | 4304.36 | 494 | 477 | 138.2 |
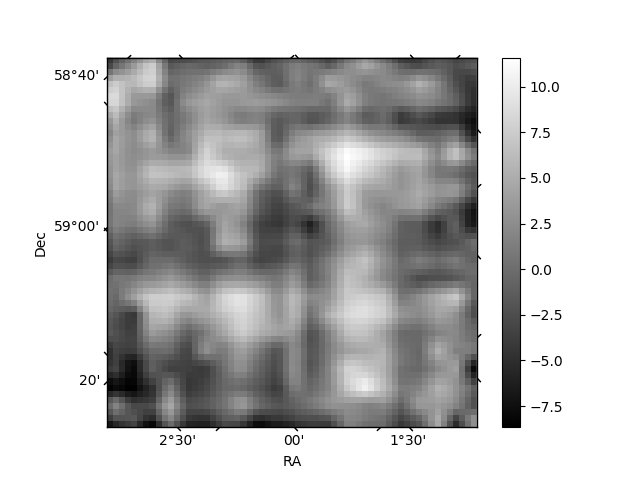
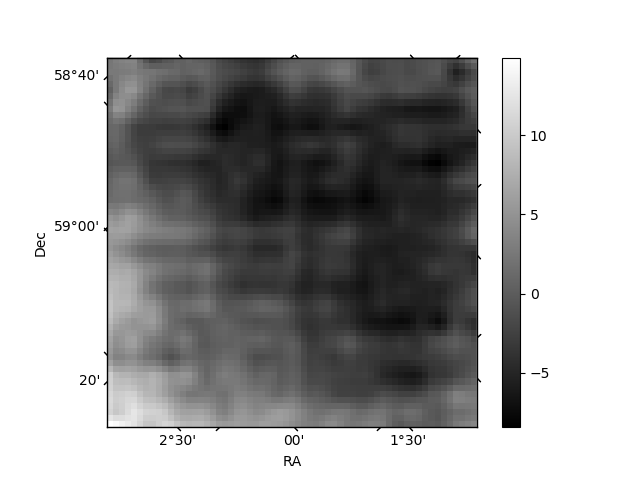
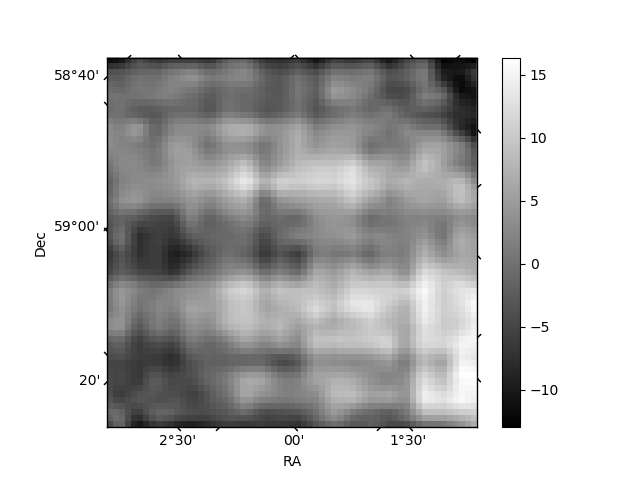
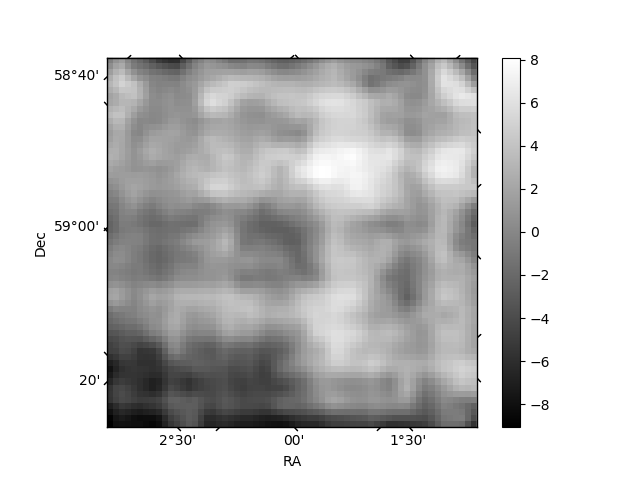
Histogram calculated using DETX and DETY for each event in the final _common_clean file
| Quadrant A | 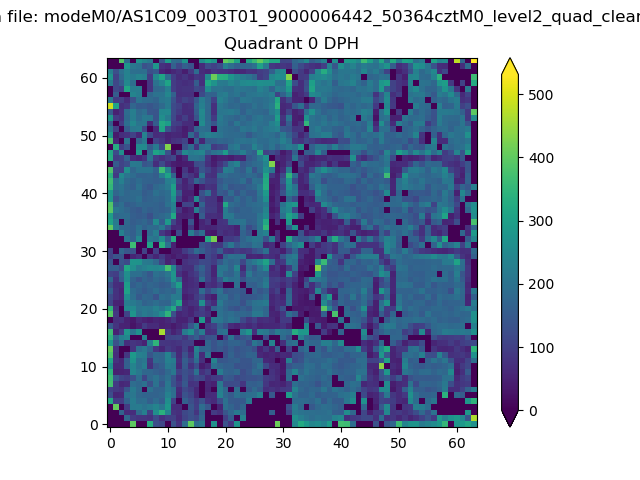 |
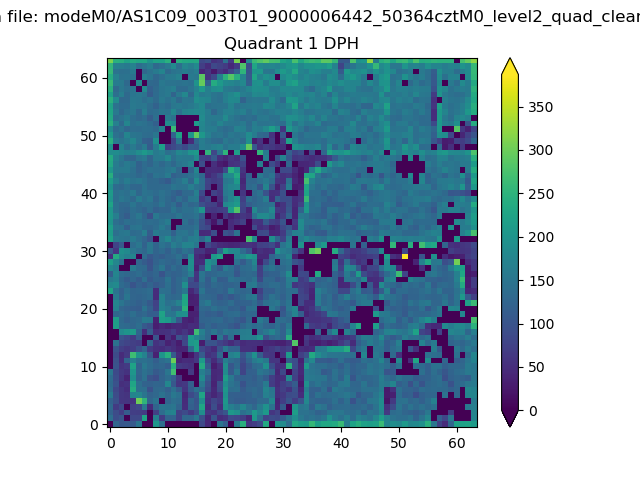 |
Quadrant B |
|---|---|---|---|
| Quadrant D | 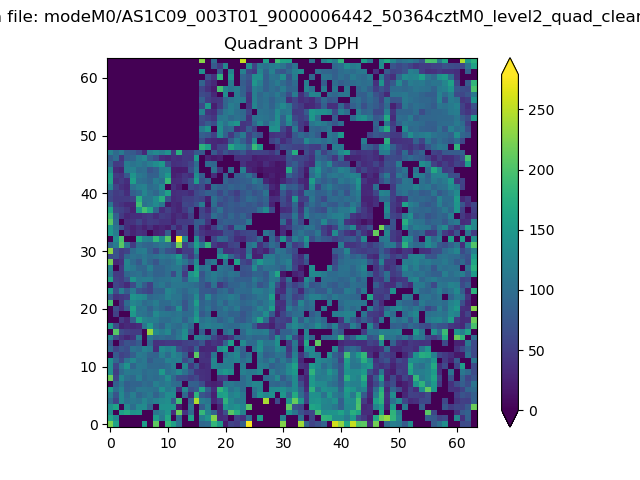 |
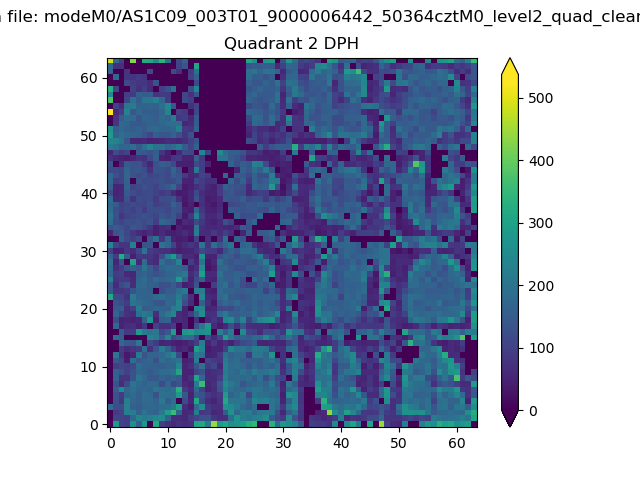 |
Quadrant C |
| Plot type | Count rate plots | Images |
|---|---|---|
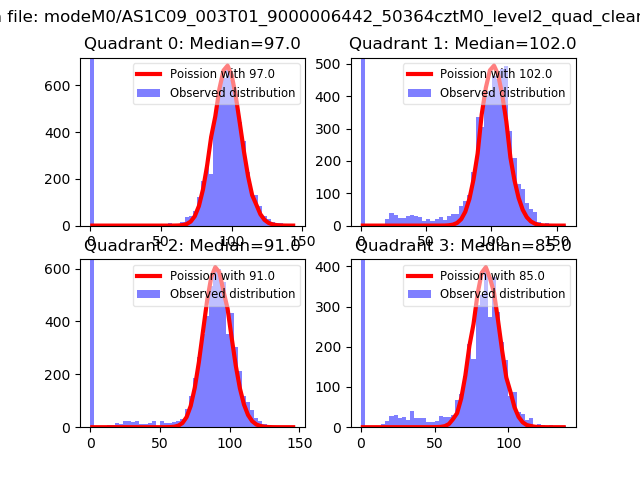
| Comparison with Poisson distribution Blue bars denote a histogram of data divided into 1 sec bins. Red curve is a Poisson curve with rate = median count rate of data. |
 |
 |
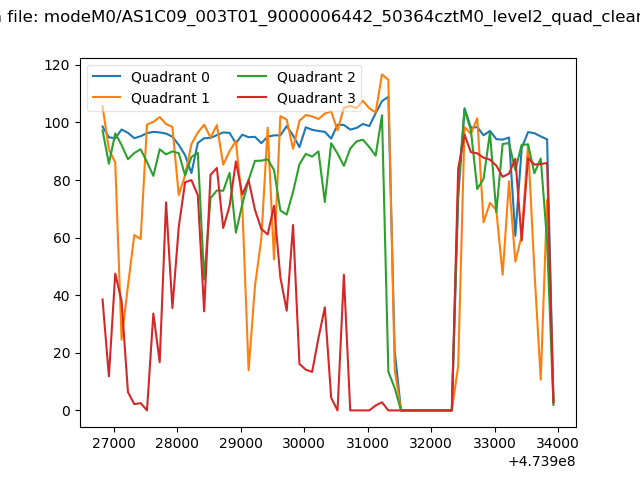
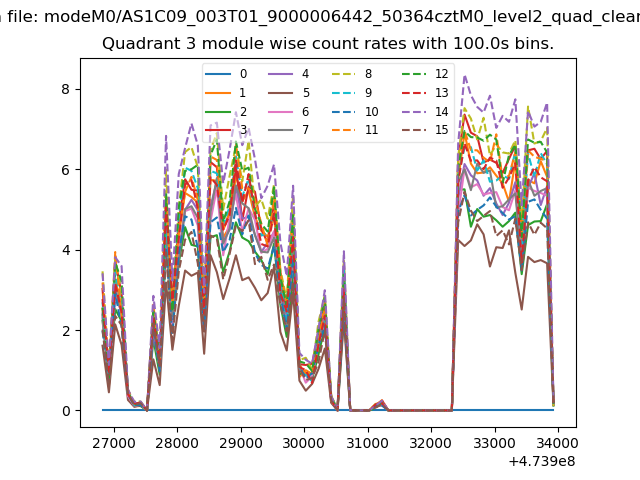
| Quadrant-wise count rates Data is divided into 100 sec bins |
 |
|
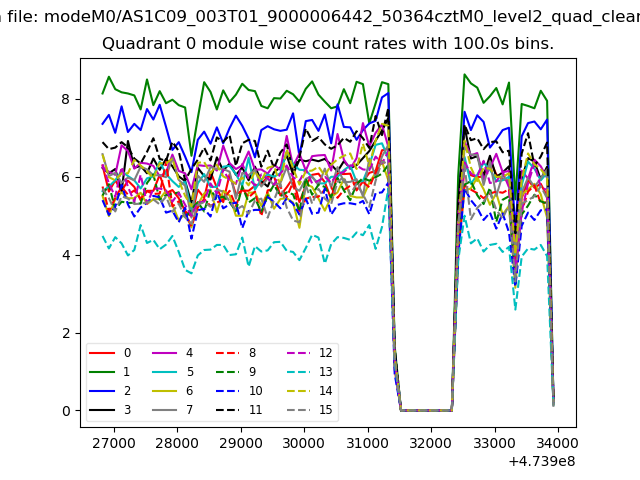
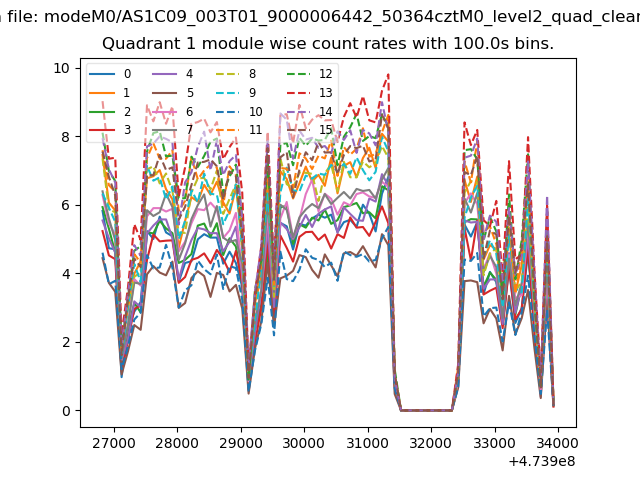
| Module-wise count rates for Quadrant A Data is divided into 100 sec bins |
 |
 |
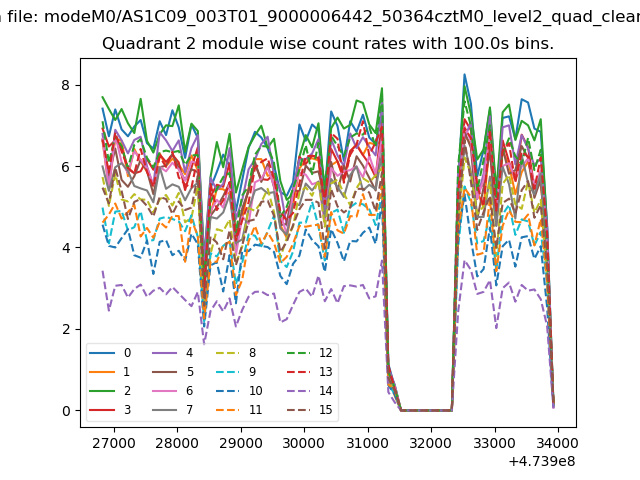
| Module-wise count rates for Quadrant B Data is divided into 100 sec bins |
 |
 |
| Module-wise count rates for Quadrant C Data is divided into 100 sec bins |
 |
 |
| Module-wise count rates for Quadrant D Data is divided into 100 sec bins |
 |
 |
| Parameter | Plot |
|---|---|
| CZT HV Monitor | 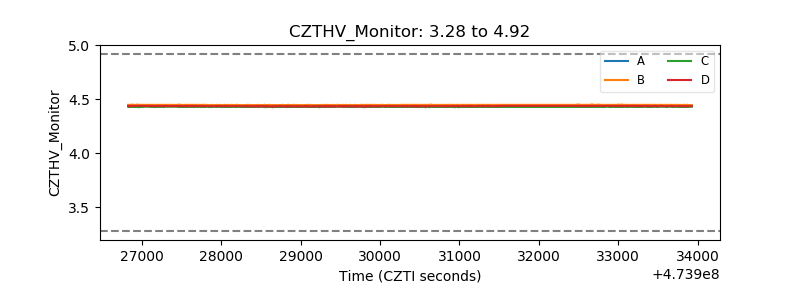 |
| D_VDD | 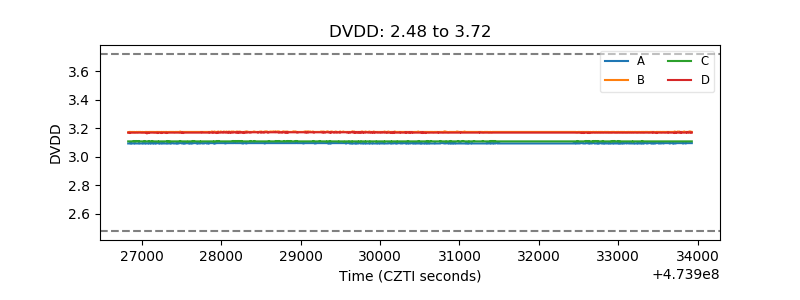 |
| Temperature 1 | 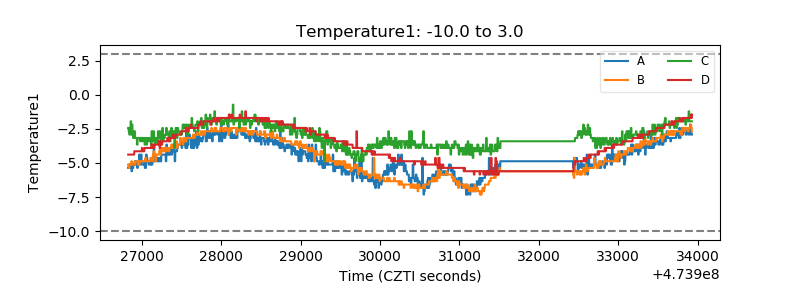 |
| Veto HV Monitor |  |
| Veto LLD | 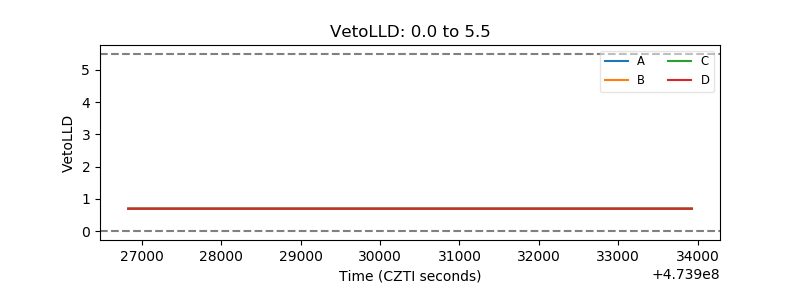 |
| Alpha Counter | 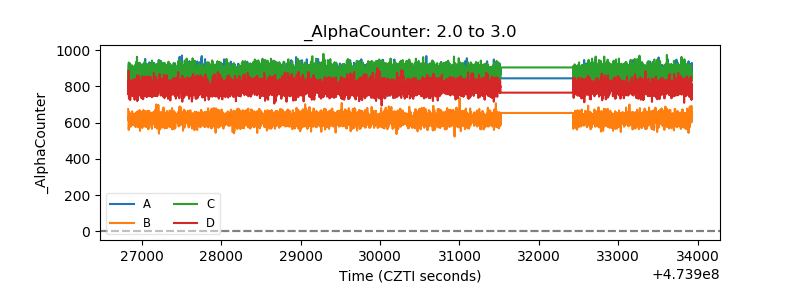 |
| _CPM_Rate | 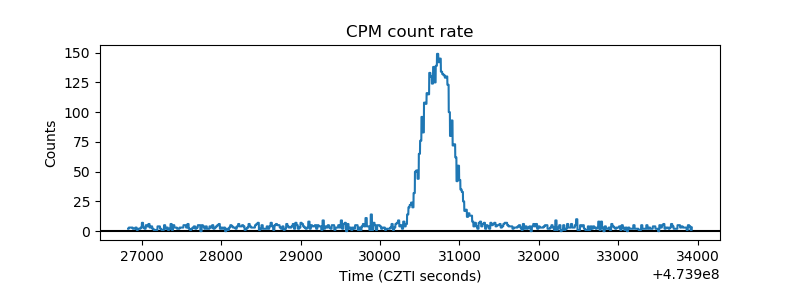 |
| CZT Counter | 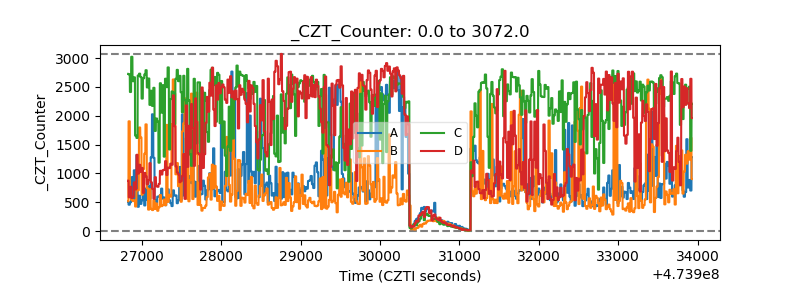 |
| +2.5 Volts monitor | 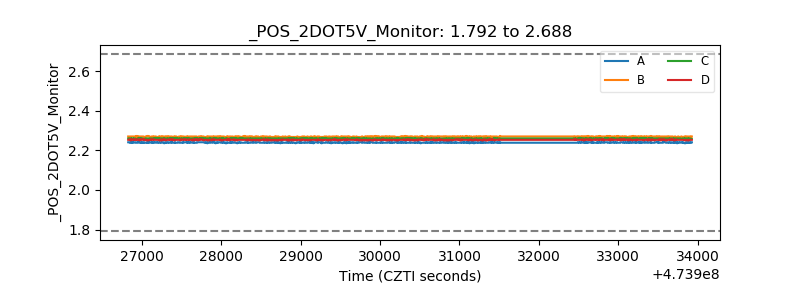 |
| +5 Volts monitor |  |
| _ROLL_ROT | 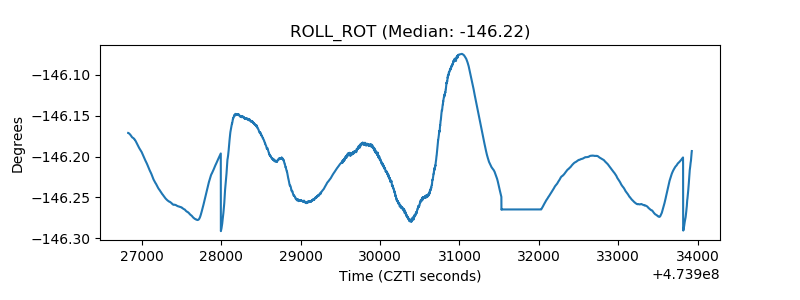 |
| _Roll_DEC | 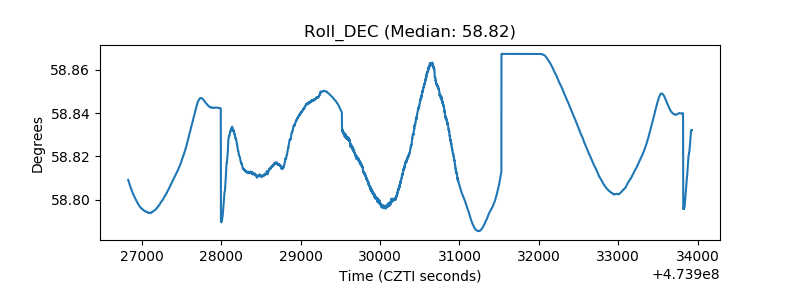 |
| _Roll_RA | 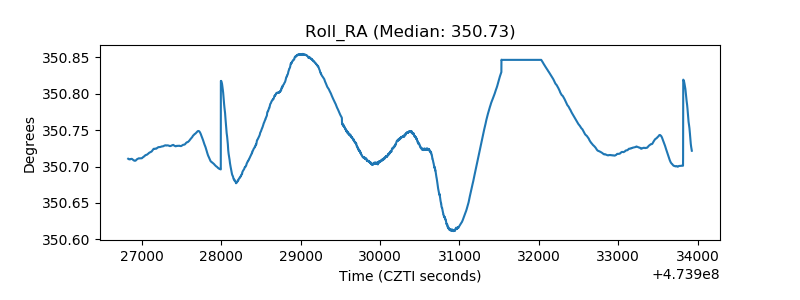 |
| Veto Counter | 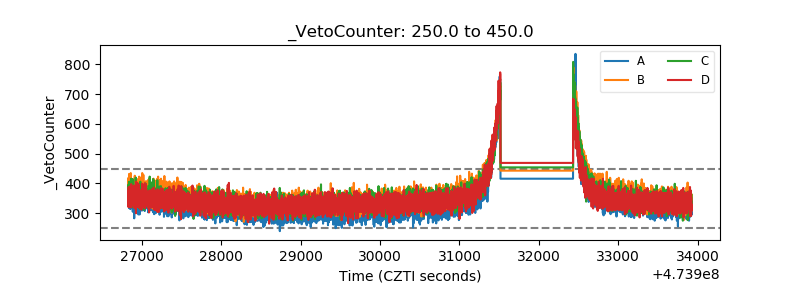 |