| Param | Original file | Final file |
|---|---|---|
| Filename | modeM0/AS1C09_003T01_9000006442_50365cztM0_level2.fits | modeM0/AS1C09_003T01_9000006442_50365cztM0_level2_quad_clean.evt |
| Size (bytes) | 732,936,960 | 82,788,480 |
| Size | 699.0 MB | 79.0 MB |
| Events in quadrant A | 5,044,888 | 572,043 |
| Events in quadrant B | 4,560,193 | 611,408 |
| Events in quadrant C | 8,348,107 | 445,598 |
| Events in quadrant D | 8,678,560 | 427,219 |
| Mode M9 | |||
|---|---|---|---|
| Quadrant | BADHDUFLAG | Total packets | Discarded packets |
| A | 0 | 6 | 0 |
| B | 0 | 6 | 0 |
| C | 0 | 6 | 0 |
| D | 0 | 6 | 0 |
| Mode M0 | |||
|---|---|---|---|
| Quadrant | BADHDUFLAG | Total packets | Discarded packets |
| A | 0 | 19285 | 1 |
| B | 0 | 18136 | 2 |
| C | 0 | 29258 | 1 |
| D | 0 | 30220 | 1 |
| Mode SS | |||
|---|---|---|---|
| Quadrant | BADHDUFLAG | Total packets | Discarded packets |
| A | 0 | 132 | 0 |
| B | 0 | 132 | 0 |
| C | 0 | 132 | 0 |
| D | 0 | 132 | 0 |
| Quadrant | Total seconds | Saturated seconds | Saturation percentage |
|---|---|---|---|
| A | 6450 | 569 | 8.821705% |
| B | 6450 | 623 | 9.658915% |
| C | 6450 | 1783 | 27.643411% |
| D | 6450 | 1658 | 25.705426% |
Noise dominated data is calculated using 1-second bins in cleaned event files. If a bin has >2000 counts, and if more than 50% of those come from <1% of pixels, then it is considered to be noise-dominated and hence unusable.
| Quadrant | # 1 sec bins | Bins with >0 counts | Bins with >2000 counts | High rate bins dominated by noise | Noise dominated (total time) | Noise dominated (detector-on time) | Marked lightcurve |
|---|---|---|---|---|---|---|---|
| A | 7105 | 6451 | 316 | 316 | 4.45% | 4.90% | 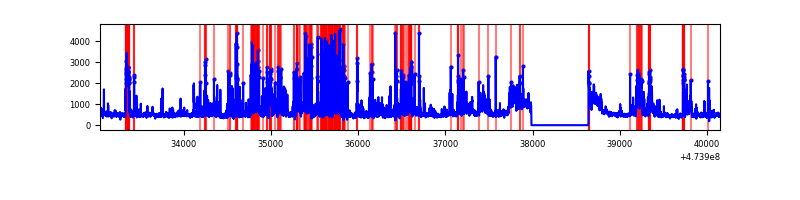 |
| B | 7105 | 6451 | 365 | 365 | 5.14% | 5.66% | 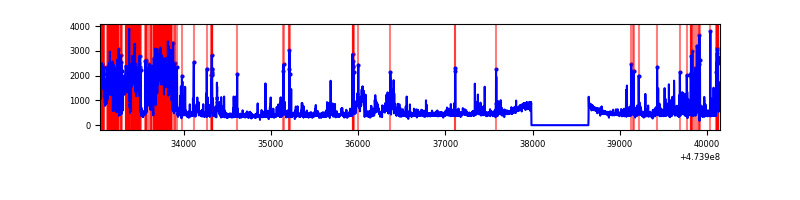 |
| C | 7105 | 6451 | 1347 | 1347 | 18.96% | 20.88% | 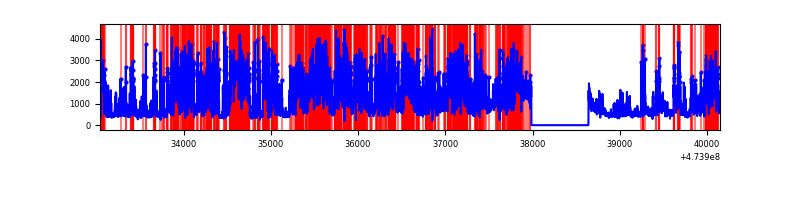 |
| D | 7105 | 6451 | 1622 | 1622 | 22.83% | 25.14% | 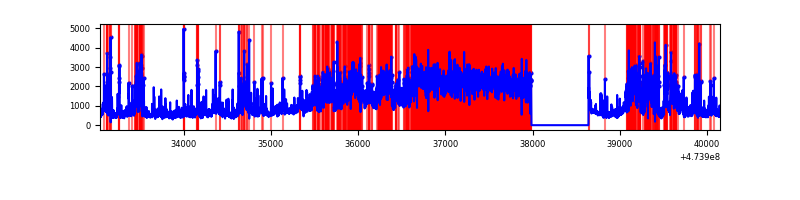 |
Top three noisy pixels from each quadrant. If the there are fewer than three noisy pixels in the level2.evt file, extra rows are filled as -1
| Pixel properties | Quadrant properties | ||||||
|---|---|---|---|---|---|---|---|
| Quadrant | DetID | PixID | Counts | Sigma | Mean | Median | Sigma |
| A | 8 | 248 | 935574 | 5501.65 | 685 | 666 | 169.9 |
| A | 7 | 206 | 190150 | 1115.06 | 685 | 666 | 169.9 |
| A | 7 | 221 | 156181 | 915.16 | 685 | 666 | 169.9 |
| B | 4 | 170 | 853756 | 5905.77 | 674 | 650 | 144.5 |
| B | 5 | 172 | 230566 | 1591.63 | 674 | 650 | 144.5 |
| B | 7 | 252 | 167994 | 1158.47 | 674 | 650 | 144.5 |
| C | 0 | 208 | 2943772 | 17634.11 | 603 | 599 | 166.9 |
| C | 15 | 230 | 1034821 | 6196.57 | 603 | 599 | 166.9 |
| C | 15 | 234 | 274848 | 1643.17 | 603 | 599 | 166.9 |
| D | 7 | 61 | 3124380 | 18175.94 | 613 | 592 | 171.9 |
| D | 3 | 12 | 800065 | 4651.78 | 613 | 592 | 171.9 |
| D | 6 | 42 | 374666 | 2176.57 | 613 | 592 | 171.9 |
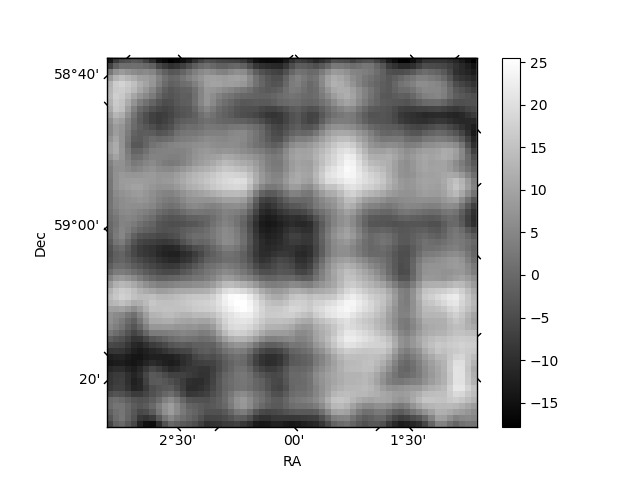
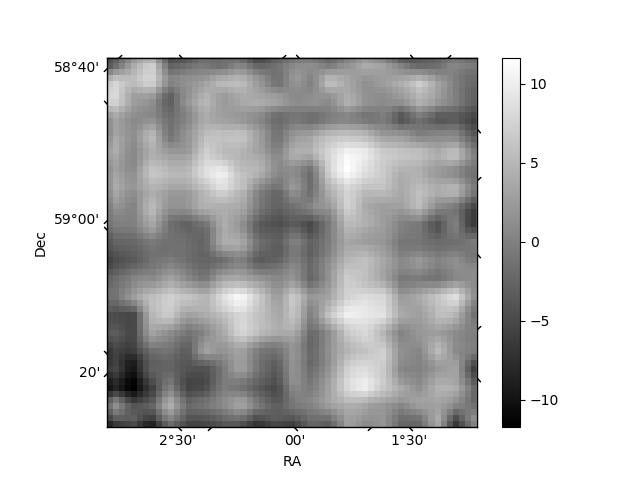
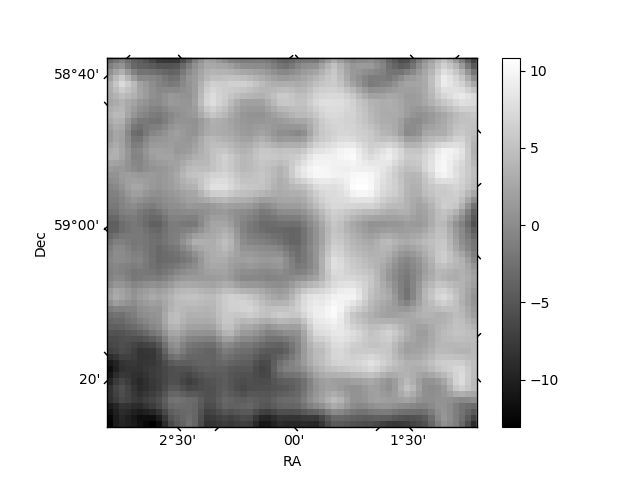
Histogram calculated using DETX and DETY for each event in the final _common_clean file
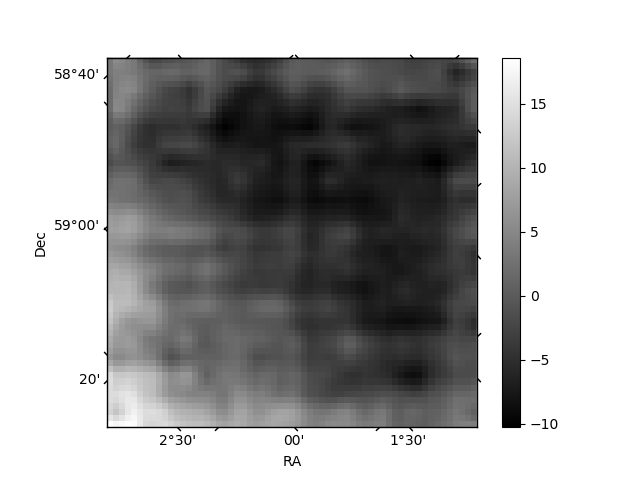
| Quadrant A | 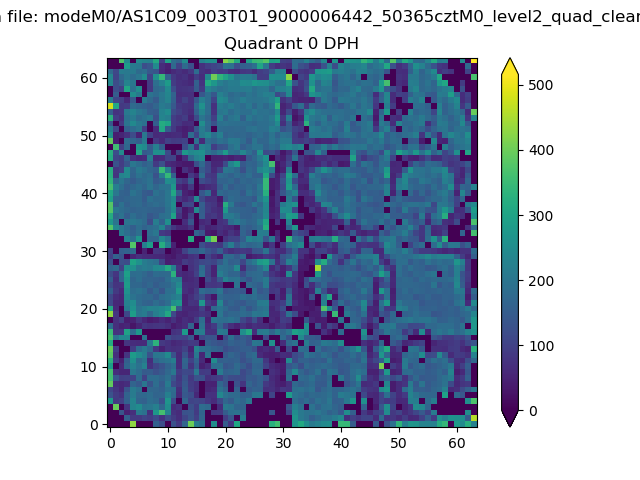 |
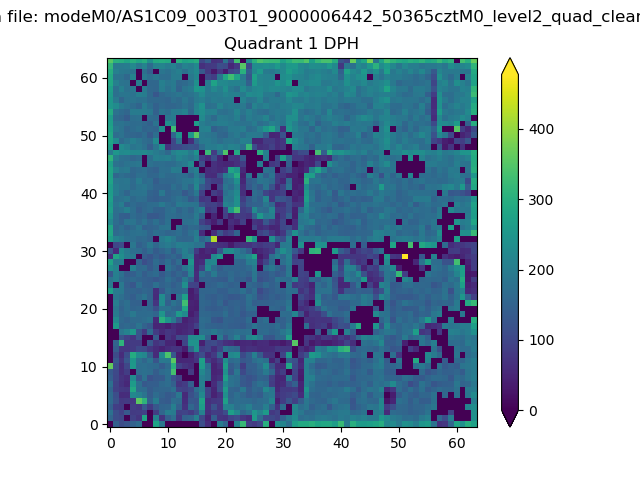 |
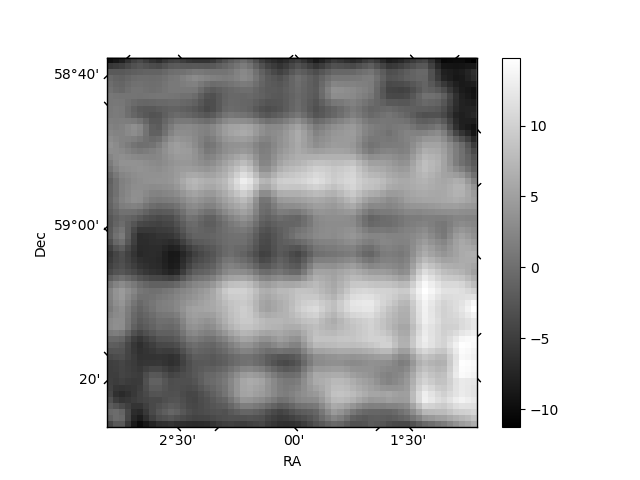
Quadrant B |
|---|---|---|---|
| Quadrant D | 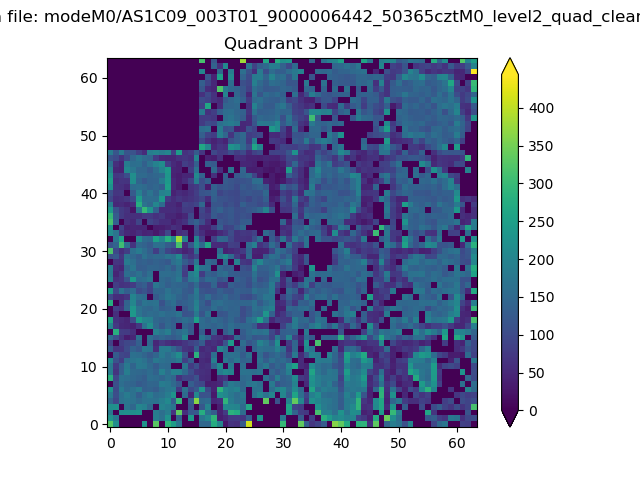 |
 |
Quadrant C |
| Plot type | Count rate plots | Images |
|---|---|---|
| Comparison with Poisson distribution Blue bars denote a histogram of data divided into 1 sec bins. Red curve is a Poisson curve with rate = median count rate of data. |
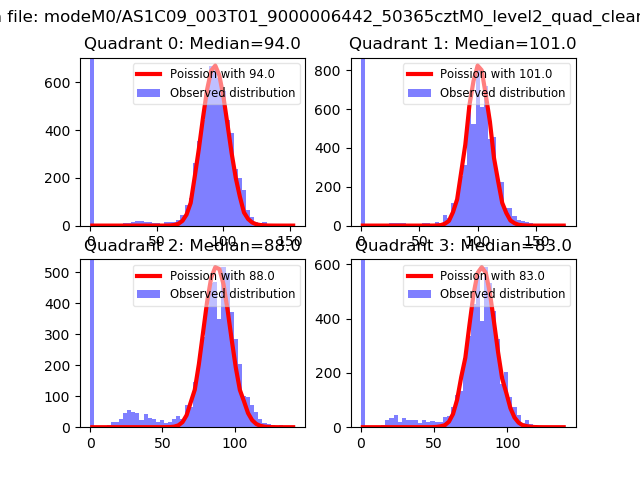 |
 |
| Quadrant-wise count rates Data is divided into 100 sec bins |
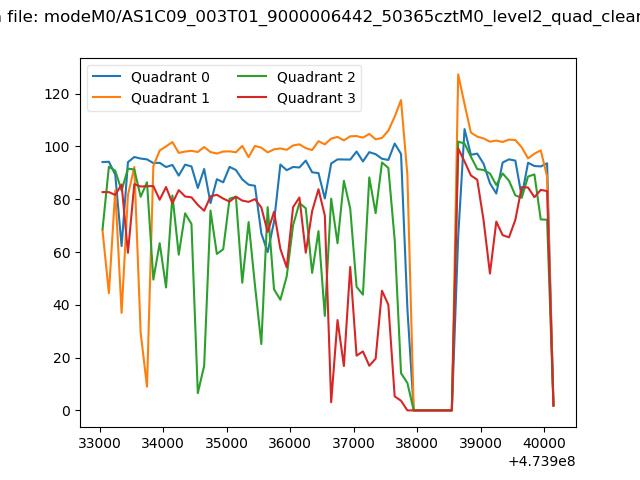 |
|
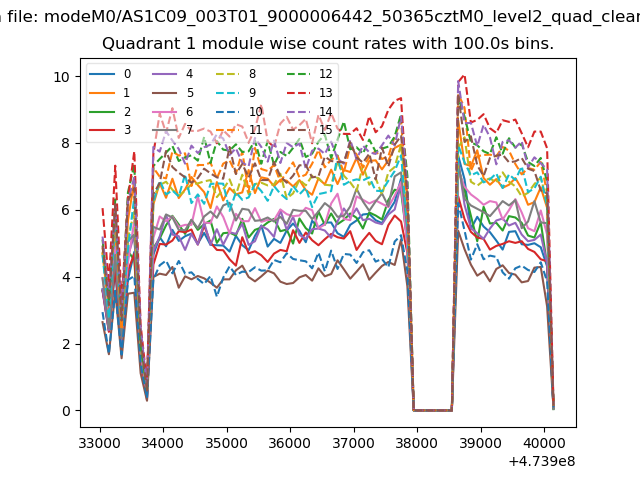
| Module-wise count rates for Quadrant A Data is divided into 100 sec bins |
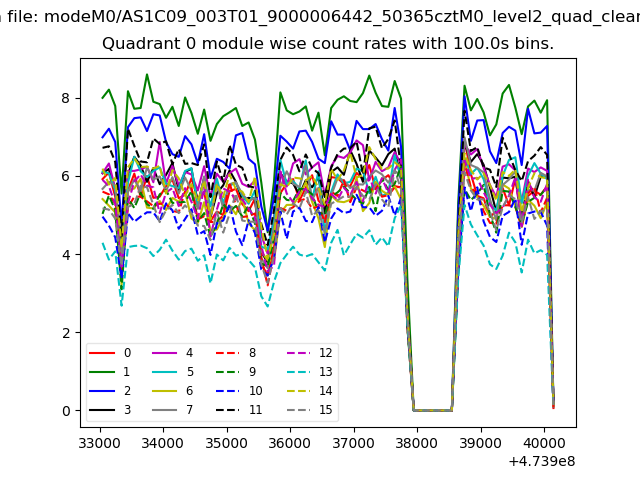 |
 |
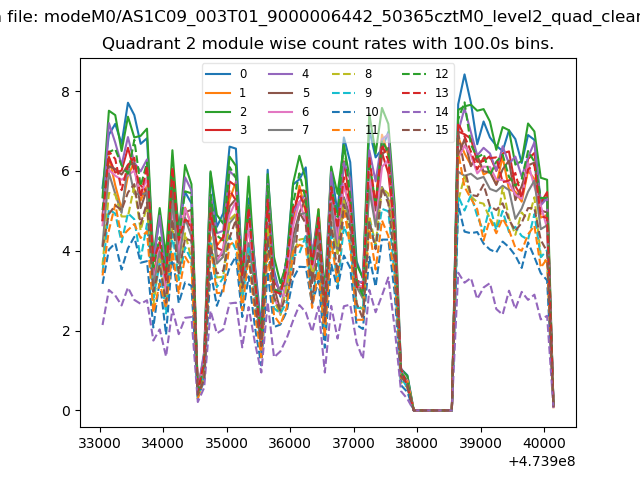
| Module-wise count rates for Quadrant B Data is divided into 100 sec bins |
 |
 |
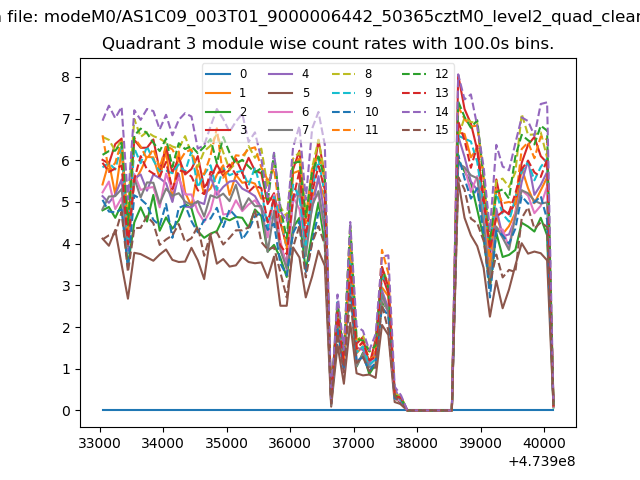
| Module-wise count rates for Quadrant C Data is divided into 100 sec bins |
 |
 |
| Module-wise count rates for Quadrant D Data is divided into 100 sec bins |
 |
 |
| Parameter | Plot |
|---|---|
| CZT HV Monitor | 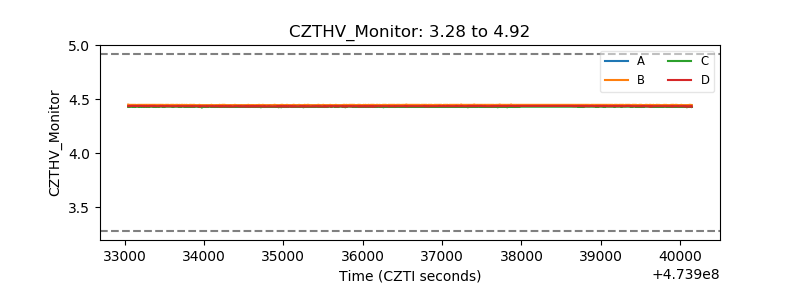 |
| D_VDD | 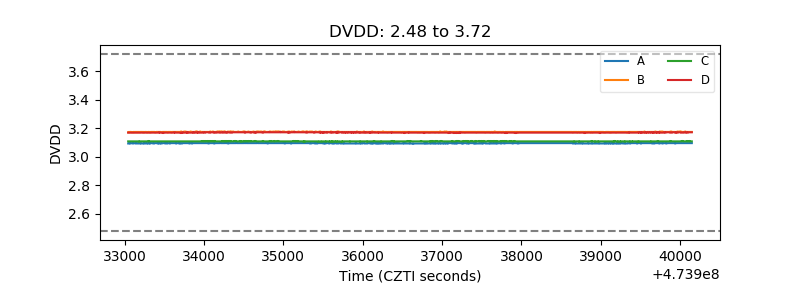 |
| Temperature 1 | 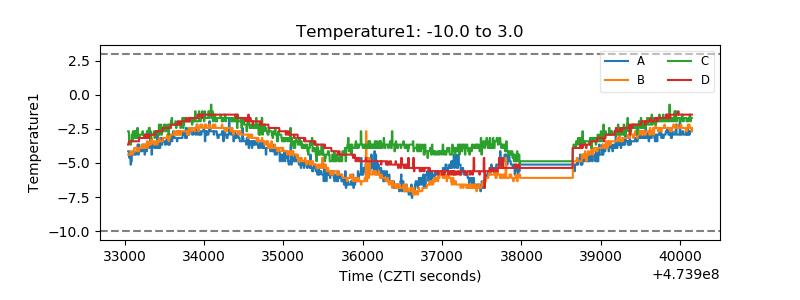 |
| Veto HV Monitor | 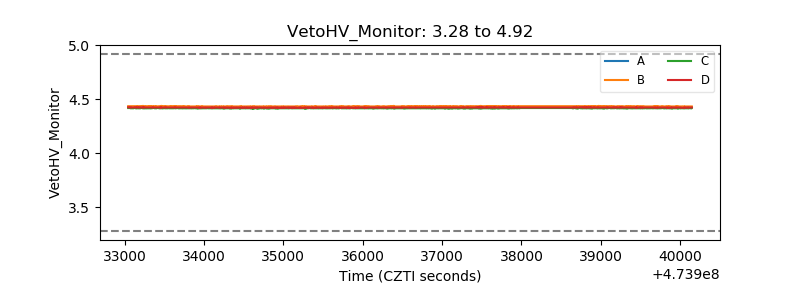 |
| Veto LLD | 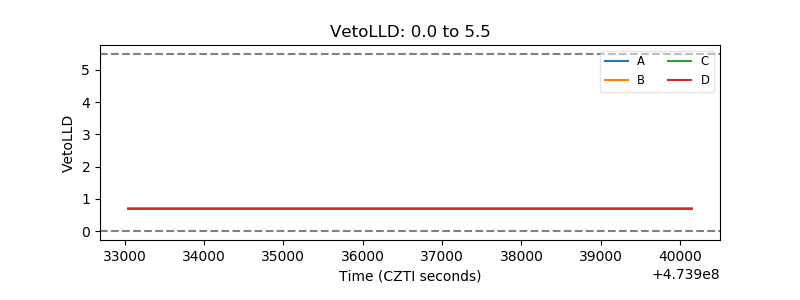 |
| Alpha Counter | 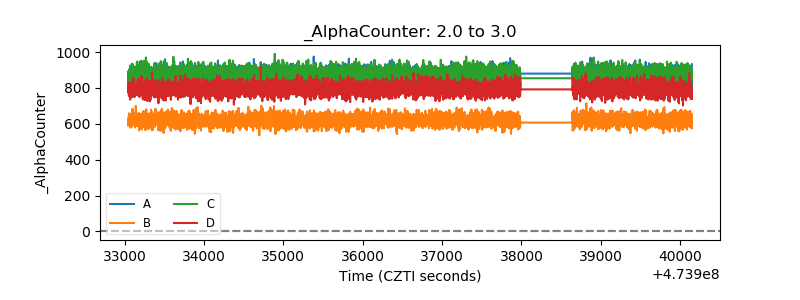 |
| _CPM_Rate | 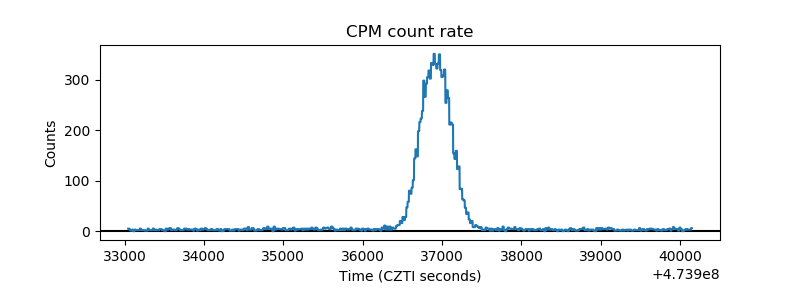 |
| CZT Counter | 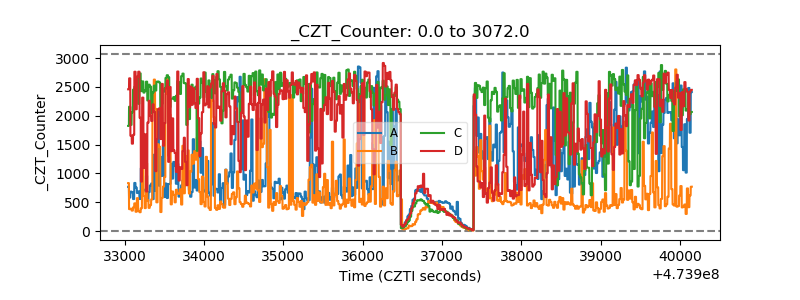 |
| +2.5 Volts monitor | 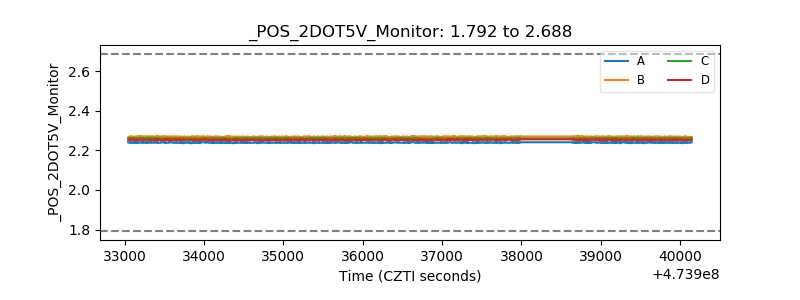 |
| +5 Volts monitor |  |
| _ROLL_ROT | 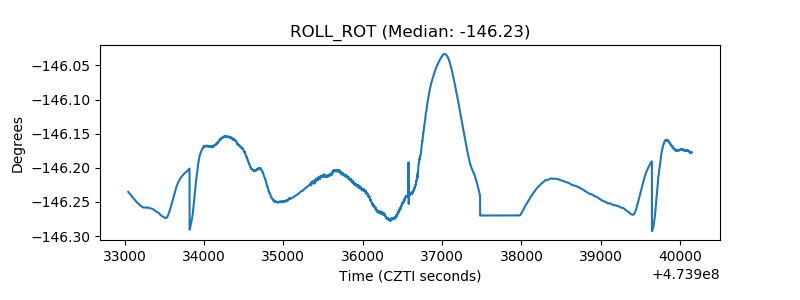 |
| _Roll_DEC | 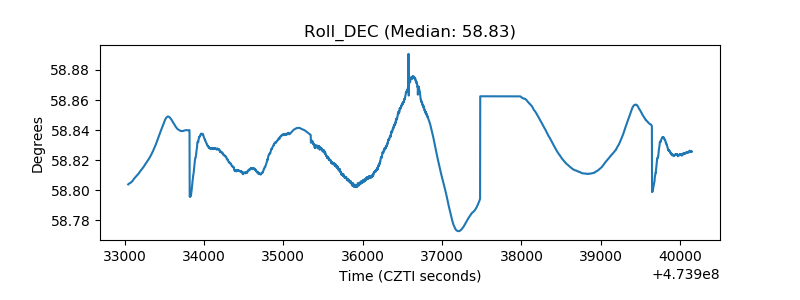 |
| _Roll_RA | 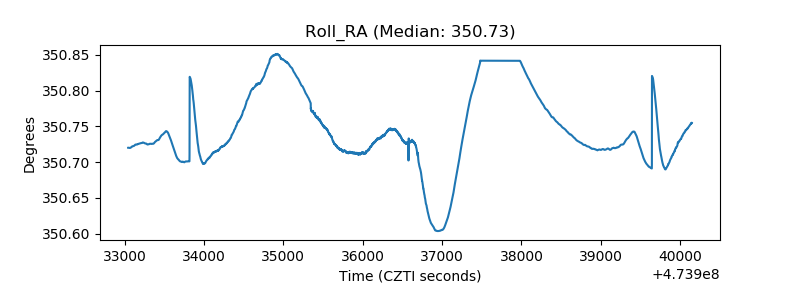 |
| Veto Counter | 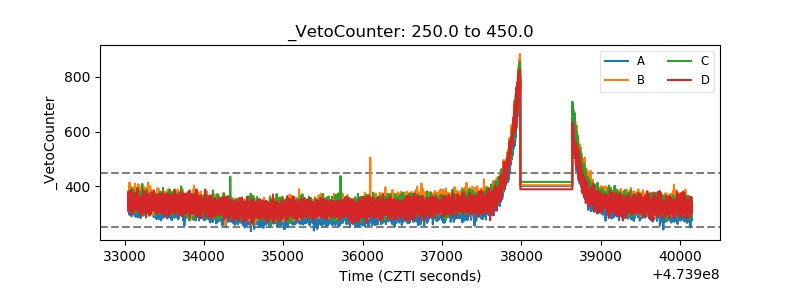 |