| Param | Original file | Final file |
|---|---|---|
| Filename | modeM0/AS1C09_003T01_9000006442_50366cztM0_level2.fits | modeM0/AS1C09_003T01_9000006442_50366cztM0_level2_quad_clean.evt |
| Size (bytes) | 826,606,080 | 86,852,160 |
| Size | 788.3 MB | 82.8 MB |
| Events in quadrant A | 5,184,759 | 626,641 |
| Events in quadrant B | 4,138,877 | 689,861 |
| Events in quadrant C | 9,475,828 | 462,027 |
| Events in quadrant D | 11,263,077 | 368,422 |
| Mode M9 | |||
|---|---|---|---|
| Quadrant | BADHDUFLAG | Total packets | Discarded packets |
| A | 0 | 2 | 0 |
| B | 0 | 2 | 0 |
| C | 0 | 2 | 0 |
| D | 0 | 2 | 0 |
| Mode M0 | |||
|---|---|---|---|
| Quadrant | BADHDUFLAG | Total packets | Discarded packets |
| A | 0 | 20095 | 1 |
| B | 0 | 17109 | 1 |
| C | 0 | 32942 | 1 |
| D | 0 | 38257 | 4 |
| Mode SS | |||
|---|---|---|---|
| Quadrant | BADHDUFLAG | Total packets | Discarded packets |
| A | 0 | 142 | 0 |
| B | 0 | 142 | 0 |
| C | 0 | 142 | 0 |
| D | 0 | 142 | 0 |
| Quadrant | Total seconds | Saturated seconds | Saturation percentage |
|---|---|---|---|
| A | 6926 | 448 | 6.468380% |
| B | 6927 | 278 | 4.013281% |
| C | 6927 | 2075 | 29.955248% |
| D | 6926 | 2917 | 42.116662% |
Noise dominated data is calculated using 1-second bins in cleaned event files. If a bin has >2000 counts, and if more than 50% of those come from <1% of pixels, then it is considered to be noise-dominated and hence unusable.
| Quadrant | # 1 sec bins | Bins with >0 counts | Bins with >2000 counts | High rate bins dominated by noise | Noise dominated (total time) | Noise dominated (detector-on time) | Marked lightcurve |
|---|---|---|---|---|---|---|---|
| A | 7081 | 6928 | 303 | 303 | 4.28% | 4.37% | 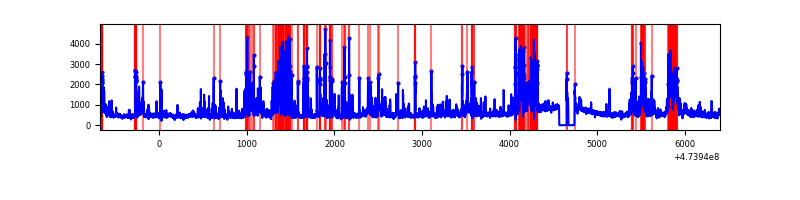 |
| B | 7082 | 6929 | 135 | 135 | 1.91% | 1.95% | 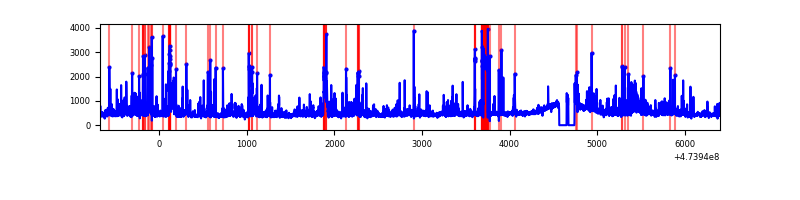 |
| C | 7082 | 6929 | 1706 | 1706 | 24.09% | 24.62% | 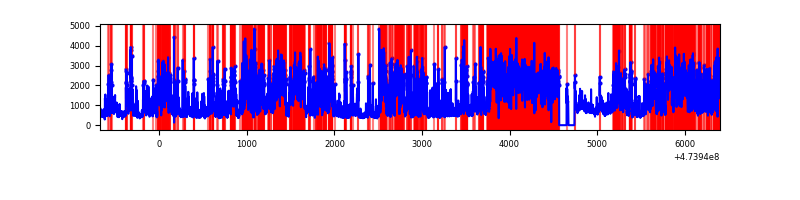 |
| D | 7081 | 6928 | 2578 | 2578 | 36.41% | 37.21% | 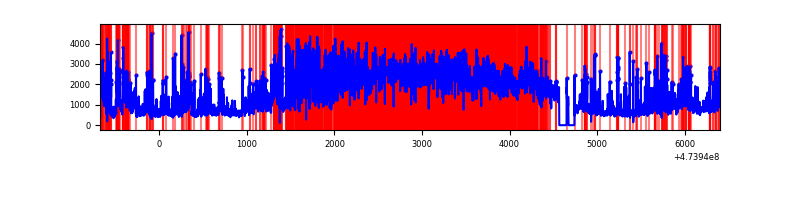 |
Top three noisy pixels from each quadrant. If the there are fewer than three noisy pixels in the level2.evt file, extra rows are filled as -1
| Pixel properties | Quadrant properties | ||||||
|---|---|---|---|---|---|---|---|
| Quadrant | DetID | PixID | Counts | Sigma | Mean | Median | Sigma |
| A | 7 | 206 | 658068 | 3575.33 | 743 | 724 | 183.9 |
| A | 8 | 248 | 540586 | 2936.34 | 743 | 724 | 183.9 |
| A | 10 | 253 | 161281 | 873.28 | 743 | 724 | 183.9 |
| B | 0 | 216 | 184693 | 1164.79 | 741 | 716 | 157.9 |
| B | 10 | 247 | 107095 | 673.5 | 741 | 716 | 157.9 |
| B | 6 | 51 | 102857 | 646.67 | 741 | 716 | 157.9 |
| C | 0 | 208 | 2323324 | 13117.24 | 647 | 644 | 177.1 |
| C | 15 | 196 | 1099180 | 6203.94 | 647 | 644 | 177.1 |
| C | 15 | 232 | 952675 | 5376.56 | 647 | 644 | 177.1 |
| D | 7 | 61 | 4259895 | 24579.68 | 621 | 600 | 173.3 |
| D | 6 | 42 | 1256588 | 7248.1 | 621 | 600 | 173.3 |
| D | 3 | 12 | 578240 | 3333.46 | 621 | 600 | 173.3 |
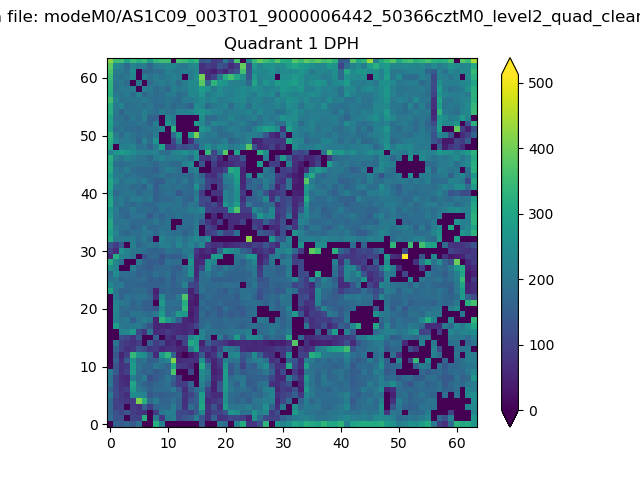
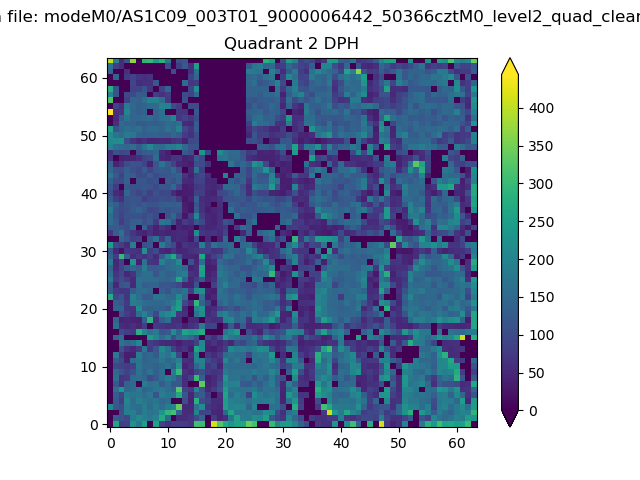
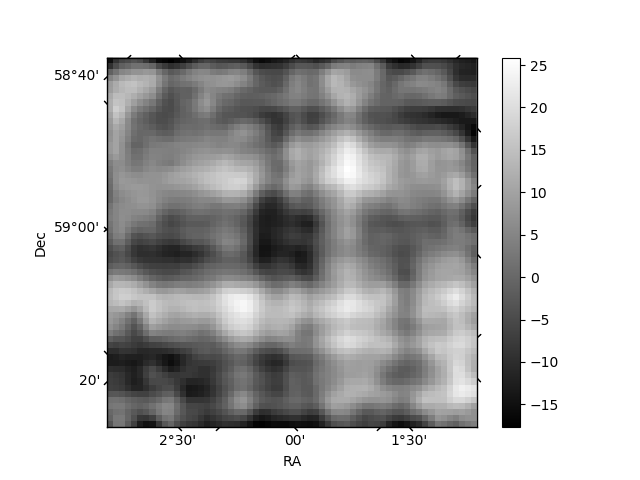
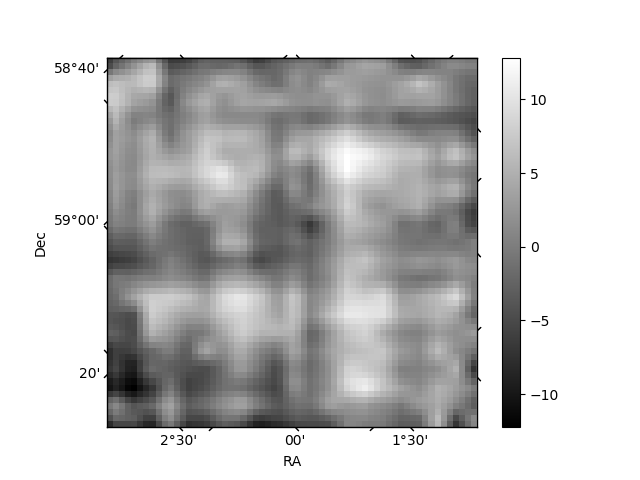
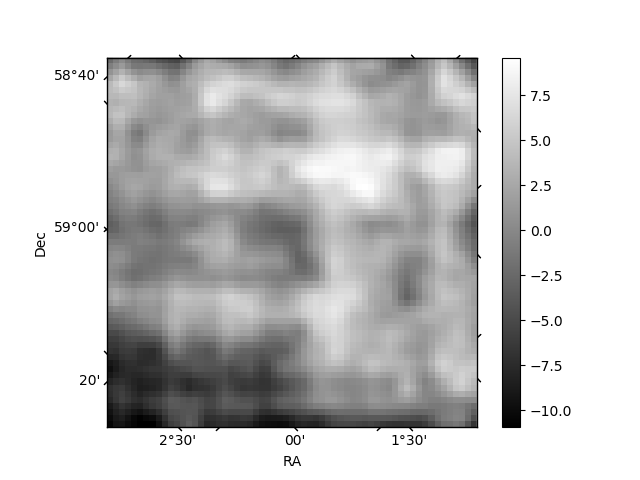
Histogram calculated using DETX and DETY for each event in the final _common_clean file
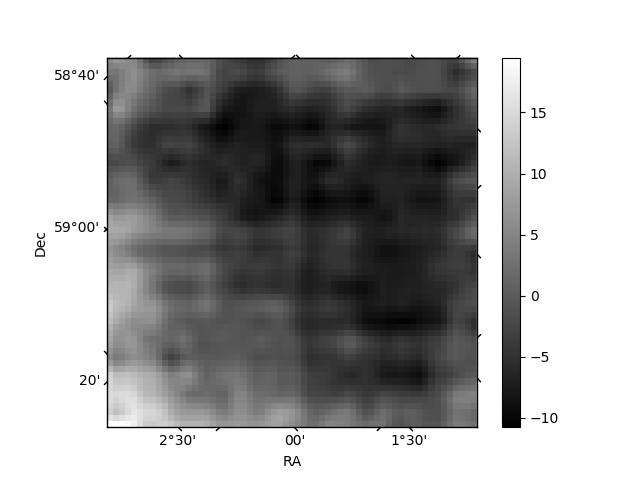
| Quadrant A |  |
 |
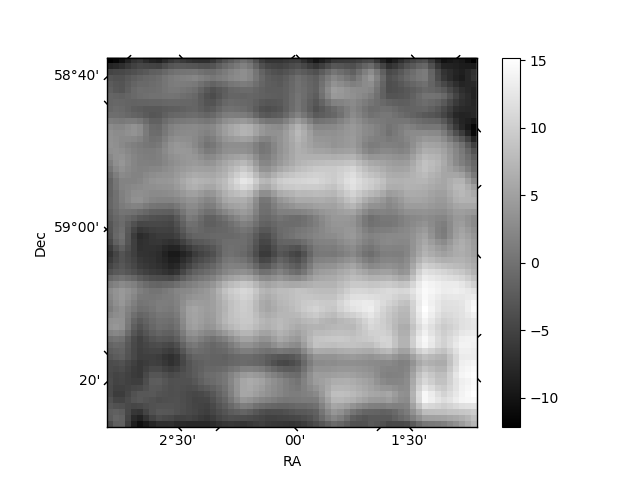
Quadrant B |
|---|---|---|---|
| Quadrant D | 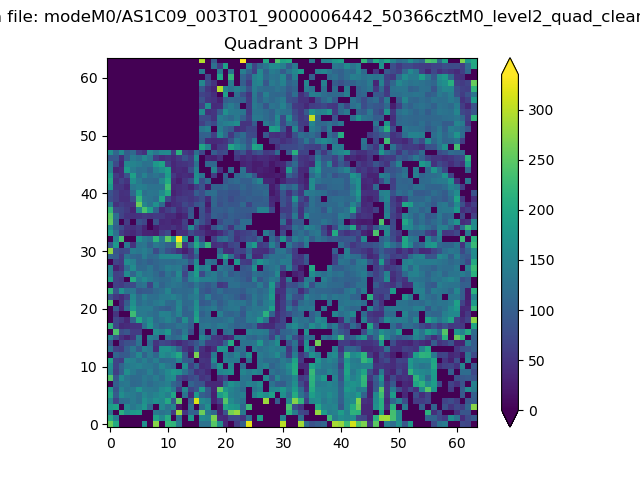 |
 |
Quadrant C |
| Plot type | Count rate plots | Images |
|---|---|---|
| Comparison with Poisson distribution Blue bars denote a histogram of data divided into 1 sec bins. Red curve is a Poisson curve with rate = median count rate of data. |
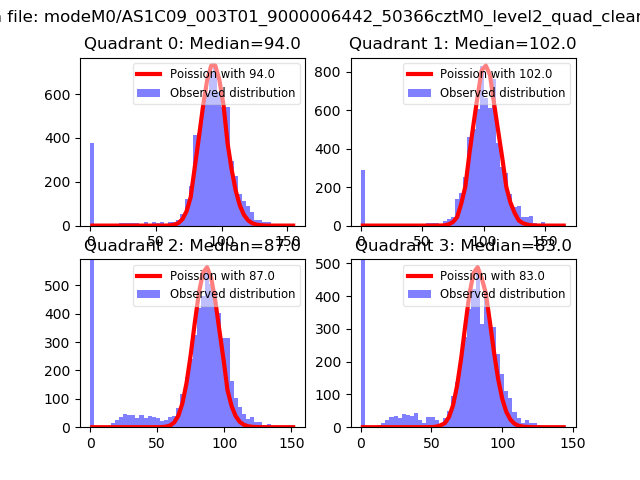 |
 |
| Quadrant-wise count rates Data is divided into 100 sec bins |
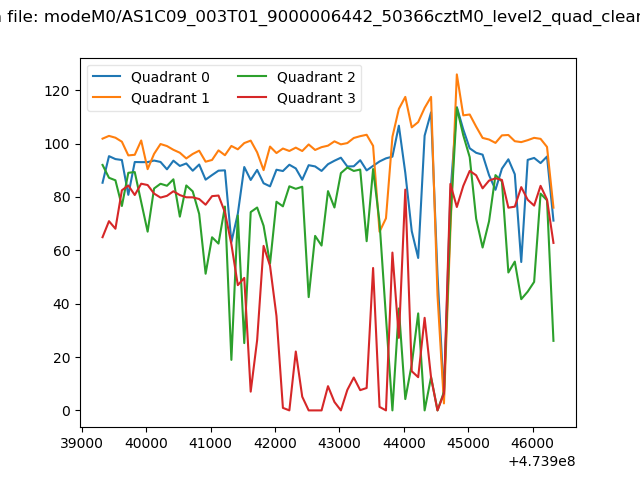 |
|
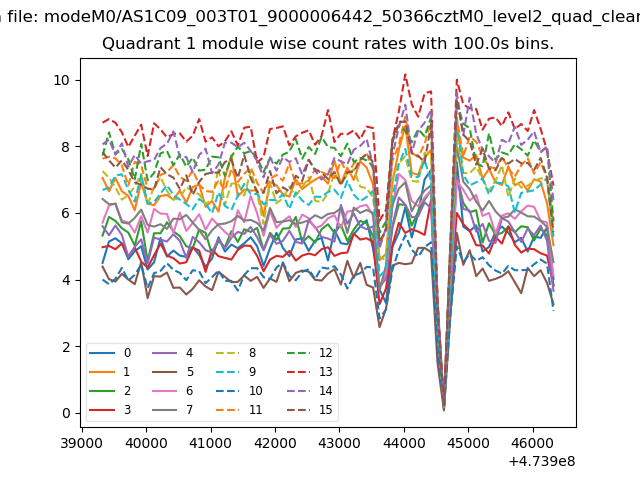
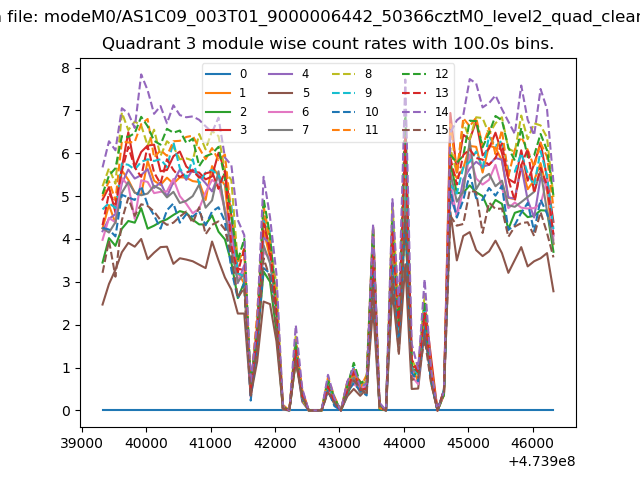
| Module-wise count rates for Quadrant A Data is divided into 100 sec bins |
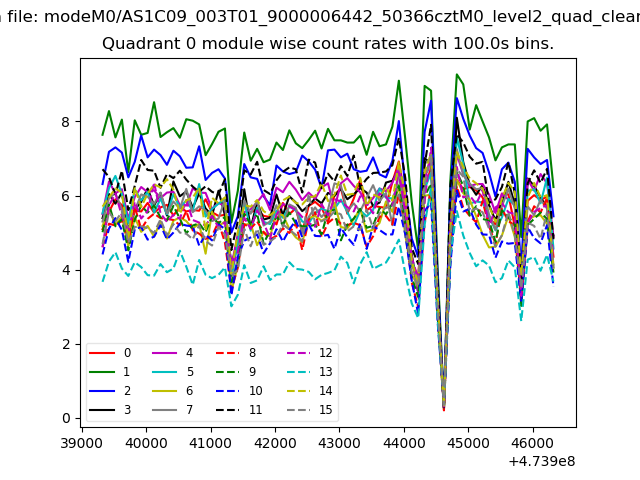 |
 |
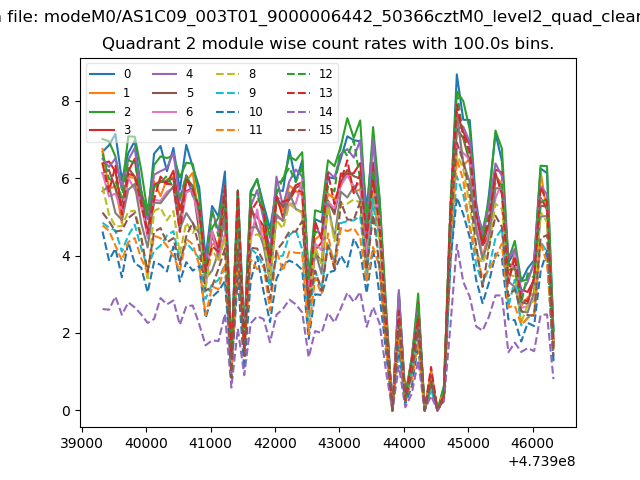
| Module-wise count rates for Quadrant B Data is divided into 100 sec bins |
 |
 |
| Module-wise count rates for Quadrant C Data is divided into 100 sec bins |
 |
 |
| Module-wise count rates for Quadrant D Data is divided into 100 sec bins |
 |
 |
| Parameter | Plot |
|---|---|
| CZT HV Monitor | 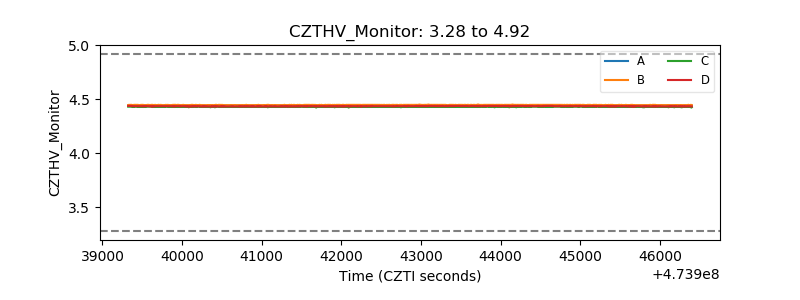 |
| D_VDD | 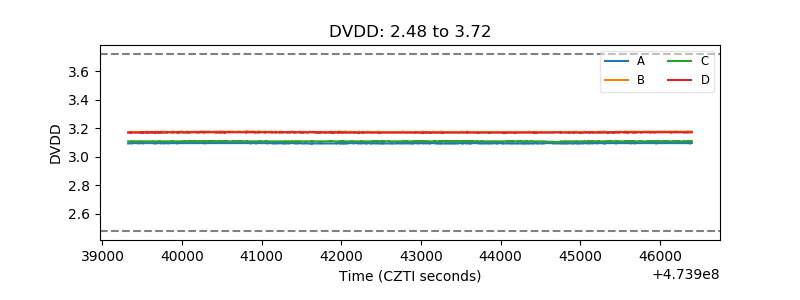 |
| Temperature 1 | 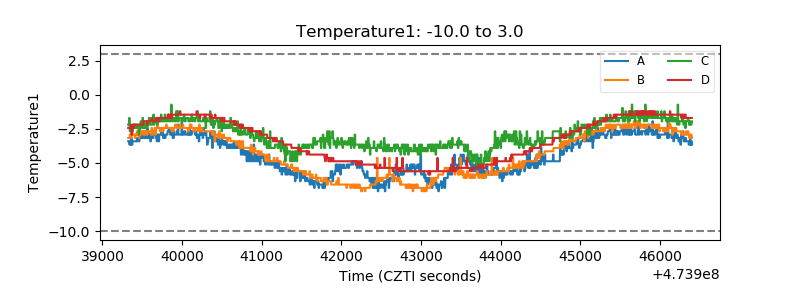 |
| Veto HV Monitor | 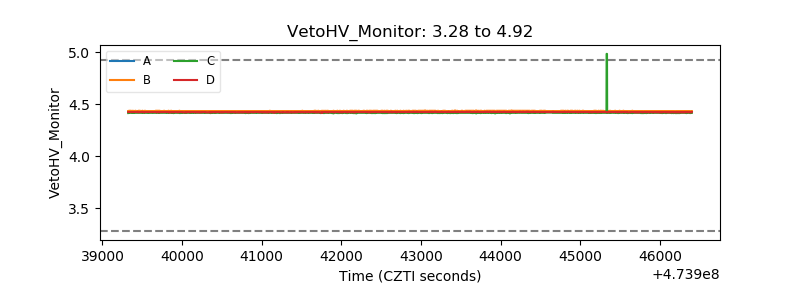 |
| Veto LLD | 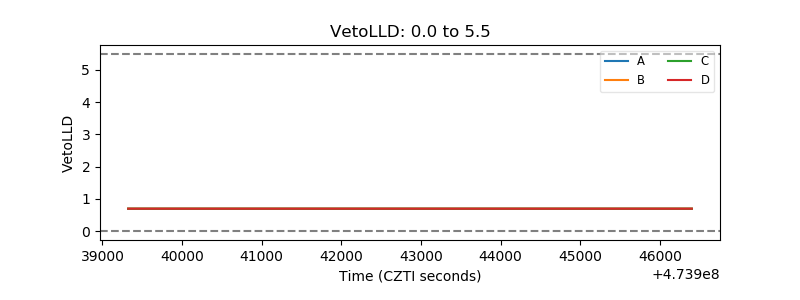 |
| Alpha Counter | 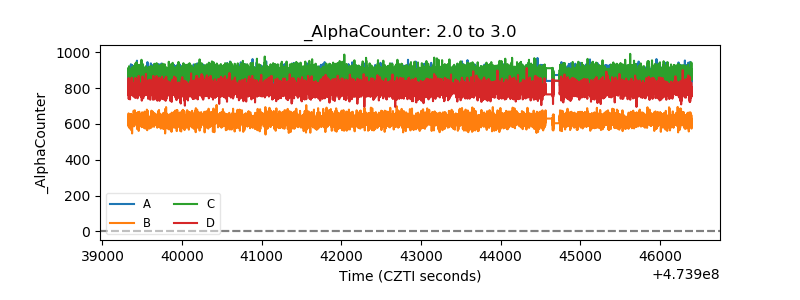 |
| _CPM_Rate | 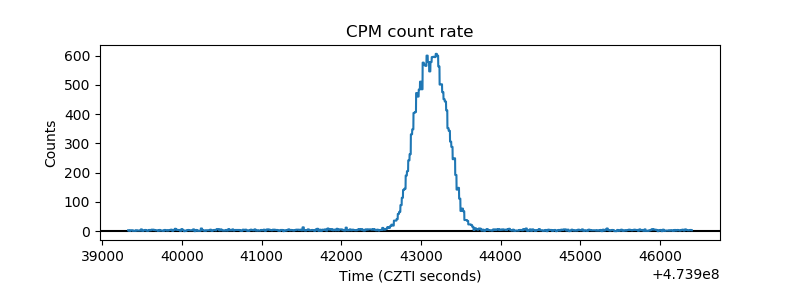 |
| CZT Counter | 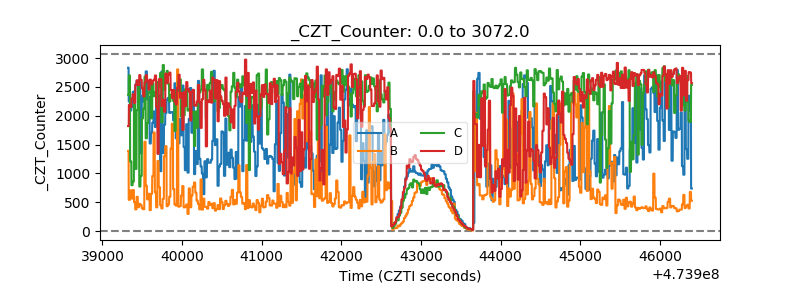 |
| +2.5 Volts monitor | 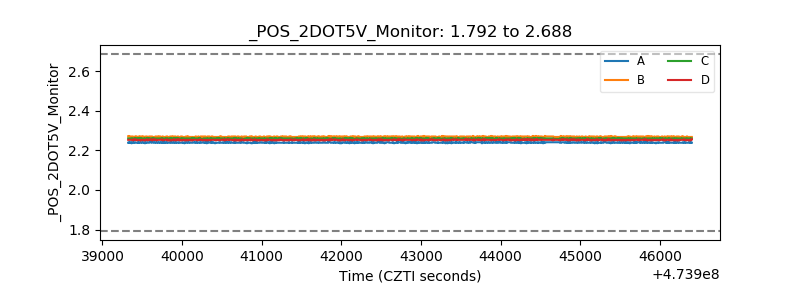 |
| +5 Volts monitor |  |
| _ROLL_ROT | 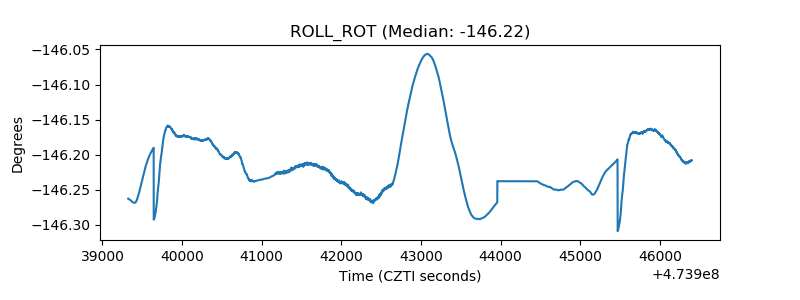 |
| _Roll_DEC | 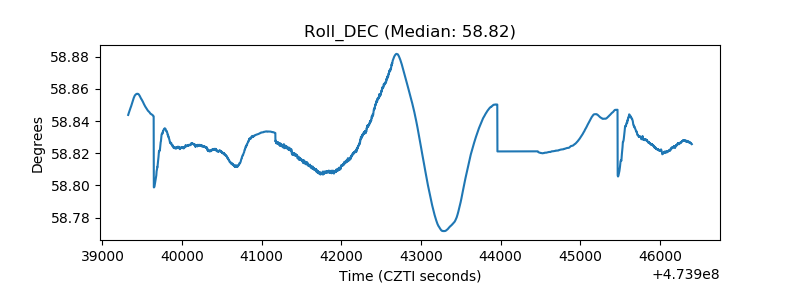 |
| _Roll_RA | 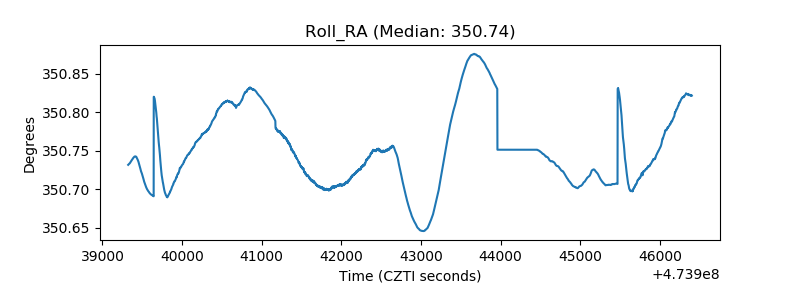 |
| Veto Counter | 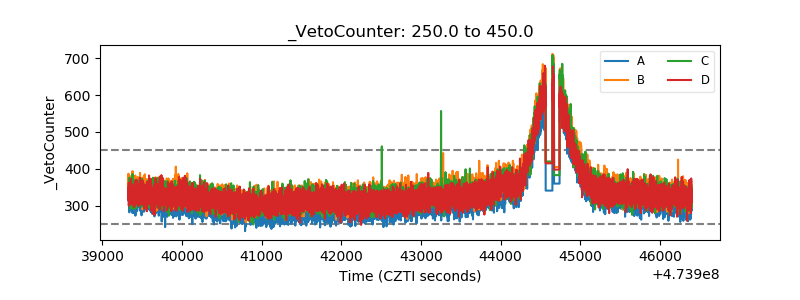 |