| Param | Original file | Final file |
|---|---|---|
| Filename | modeM0/AS1C09_003T01_9000006442_50368cztM0_level2.fits | modeM0/AS1C09_003T01_9000006442_50368cztM0_level2_quad_clean.evt |
| Size (bytes) | 1,085,875,200 | 76,158,720 |
| Size | 1.0 GB | 72.6 MB |
| Events in quadrant A | 4,600,557 | 673,748 |
| Events in quadrant B | 6,514,248 | 630,872 |
| Events in quadrant C | 12,095,397 | 430,399 |
| Events in quadrant D | 16,424,284 | 65,166 |
| Mode M0 | |||
|---|---|---|---|
| Quadrant | BADHDUFLAG | Total packets | Discarded packets |
| A | 0 | 18612 | 0 |
| B | 0 | 24349 | 0 |
| C | 0 | 40984 | 1 |
| D | 0 | 53786 | 0 |
| Mode SS | |||
|---|---|---|---|
| Quadrant | BADHDUFLAG | Total packets | Discarded packets |
| A | 0 | 146 | 0 |
| B | 0 | 146 | 0 |
| C | 0 | 146 | 0 |
| D | 0 | 146 | 0 |
| Quadrant | Total seconds | Saturated seconds | Saturation percentage |
|---|---|---|---|
| A | 7257 | 96 | 1.322861% |
| B | 7257 | 1077 | 14.840843% |
| C | 7256 | 2894 | 39.884234% |
| D | 7257 | 6676 | 91.993937% |
Noise dominated data is calculated using 1-second bins in cleaned event files. If a bin has >2000 counts, and if more than 50% of those come from <1% of pixels, then it is considered to be noise-dominated and hence unusable.
| Quadrant | # 1 sec bins | Bins with >0 counts | Bins with >2000 counts | High rate bins dominated by noise | Noise dominated (total time) | Noise dominated (detector-on time) | Marked lightcurve |
|---|---|---|---|---|---|---|---|
| A | 7257 | 7257 | 70 | 70 | 0.96% | 0.96% | 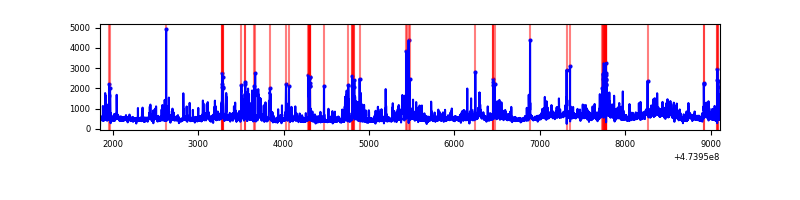 |
| B | 7257 | 7256 | 764 | 764 | 10.53% | 10.53% | 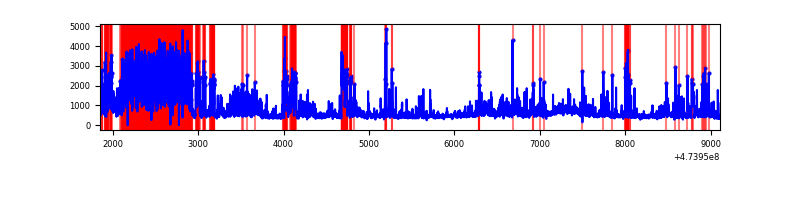 |
| C | 7256 | 7256 | 2442 | 2442 | 33.65% | 33.65% | 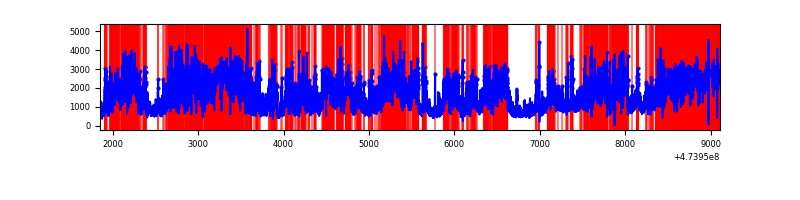 |
| D | 7257 | 7255 | 5146 | 5146 | 70.91% | 70.93% | 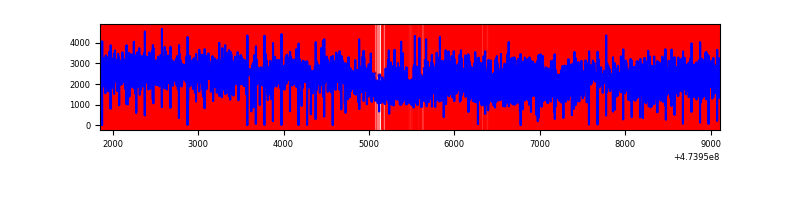 |
Top three noisy pixels from each quadrant. If the there are fewer than three noisy pixels in the level2.evt file, extra rows are filled as -1
| Pixel properties | Quadrant properties | ||||||
|---|---|---|---|---|---|---|---|
| Quadrant | DetID | PixID | Counts | Sigma | Mean | Median | Sigma |
| A | 12 | 250 | 270170 | 1406.64 | 773 | 753 | 191.5 |
| A | 3 | 14 | 173043 | 899.53 | 773 | 753 | 191.5 |
| A | 3 | 130 | 168415 | 875.37 | 773 | 753 | 191.5 |
| B | 12 | 0 | 1550769 | 10272.31 | 711 | 685 | 150.9 |
| B | 10 | 44 | 459592 | 3041.15 | 711 | 685 | 150.9 |
| B | 4 | 170 | 434884 | 2877.41 | 711 | 685 | 150.9 |
| C | 0 | 208 | 1514427 | 8517.69 | 640 | 635 | 177.7 |
| C | 15 | 127 | 1392196 | 7829.93 | 640 | 635 | 177.7 |
| C | 15 | 196 | 1013080 | 5696.75 | 640 | 635 | 177.7 |
| D | 7 | 61 | 8654921 | 80325.95 | 355 | 341 | 107.7 |
| D | 12 | 6 | 1171071 | 10865.92 | 355 | 341 | 107.7 |
| D | 7 | 126 | 913016 | 8470.83 | 355 | 341 | 107.7 |
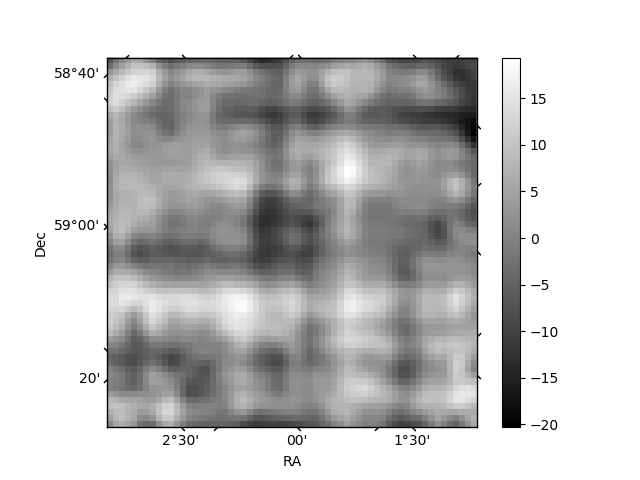
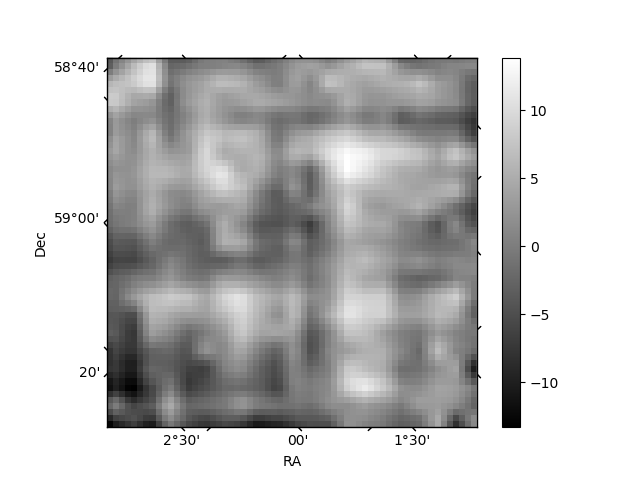
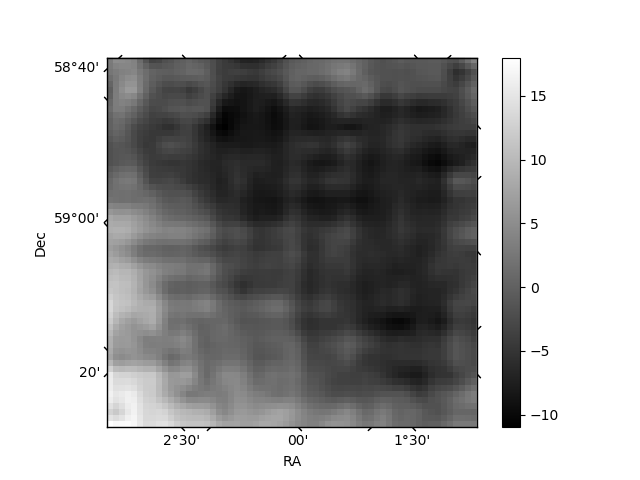
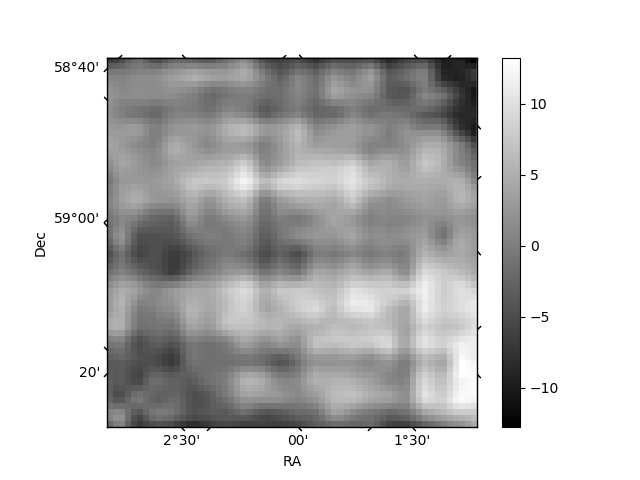
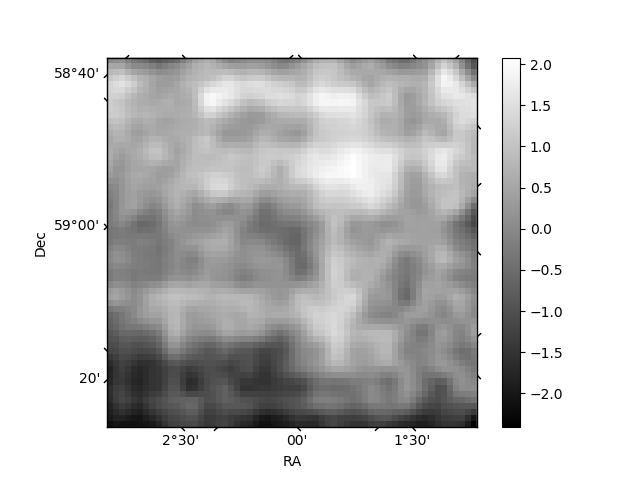
Histogram calculated using DETX and DETY for each event in the final _common_clean file
| Quadrant A | 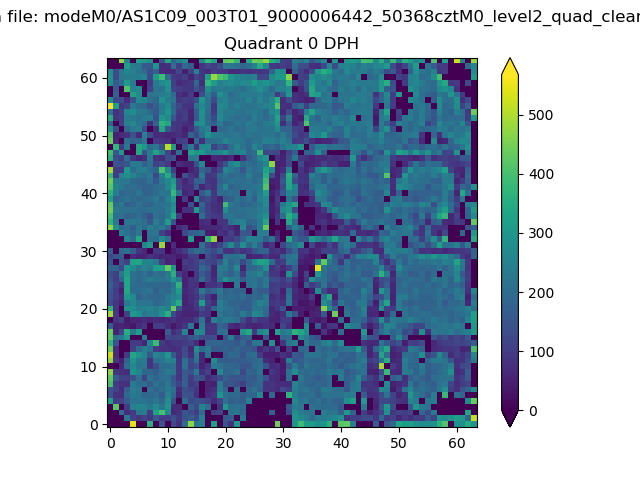 |
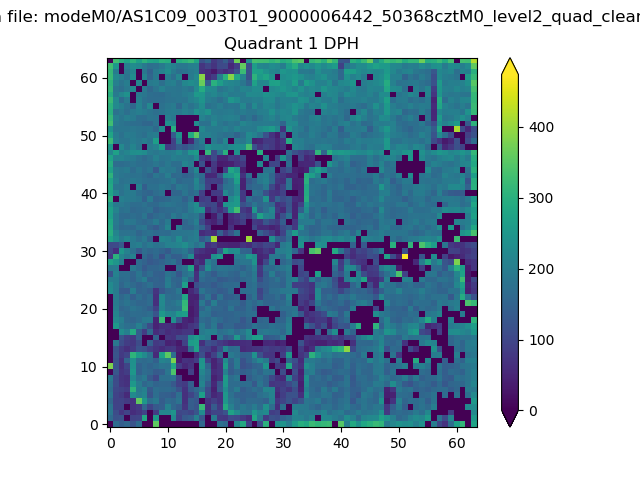 |
Quadrant B |
|---|---|---|---|
| Quadrant D | 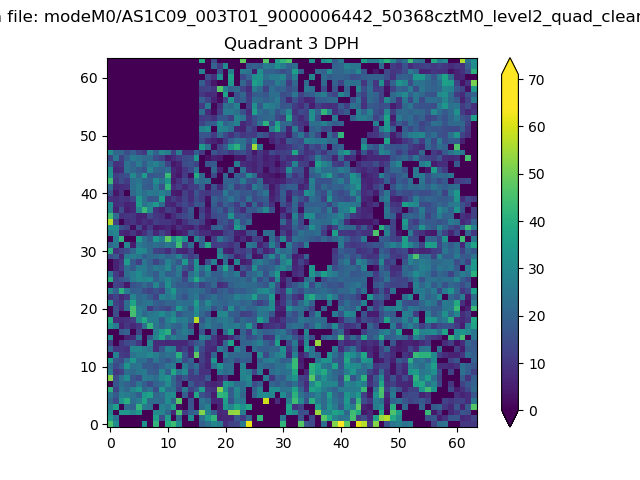 |
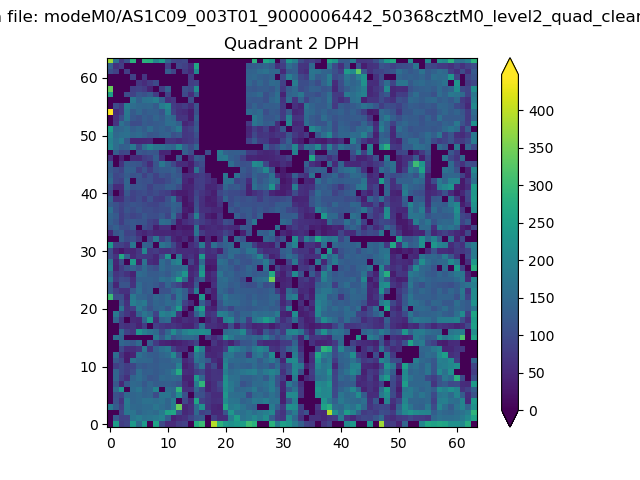 |
Quadrant C |
| Plot type | Count rate plots | Images |
|---|---|---|
| Comparison with Poisson distribution Blue bars denote a histogram of data divided into 1 sec bins. Red curve is a Poisson curve with rate = median count rate of data. |
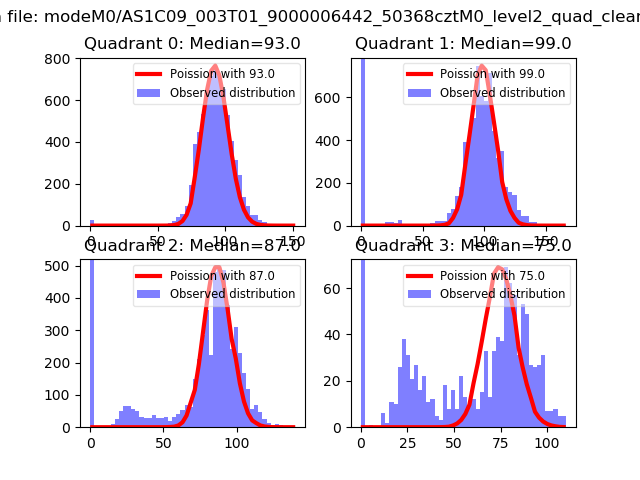 |
 |
| Quadrant-wise count rates Data is divided into 100 sec bins |
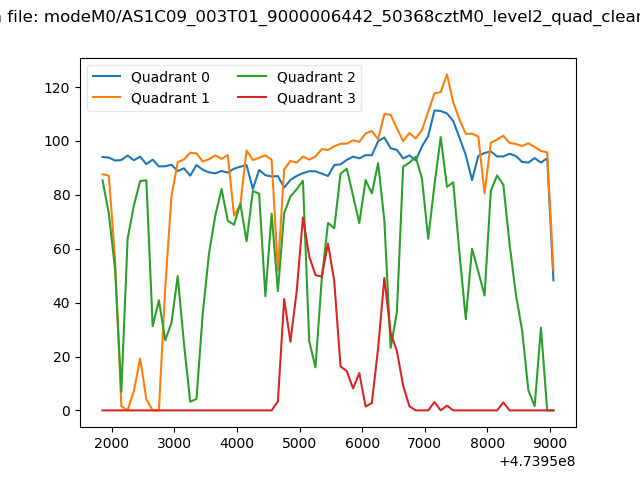 |
|
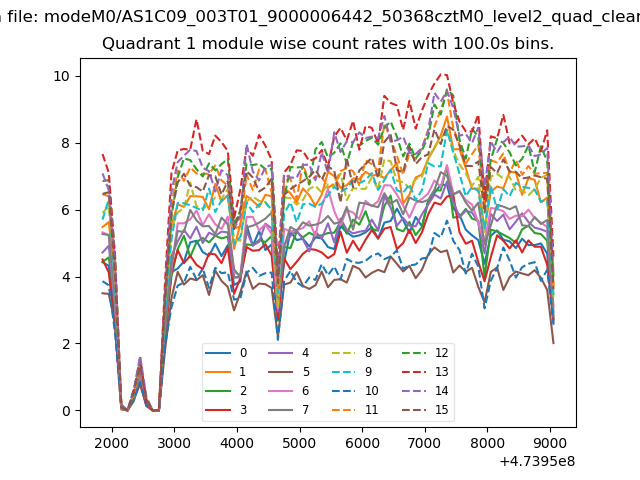
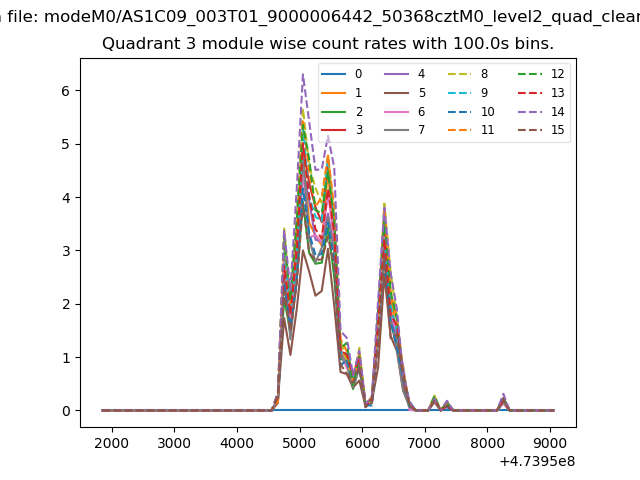
| Module-wise count rates for Quadrant A Data is divided into 100 sec bins |
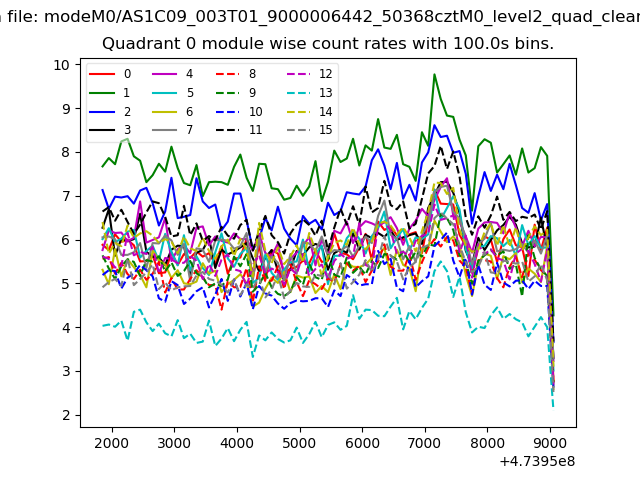 |
 |
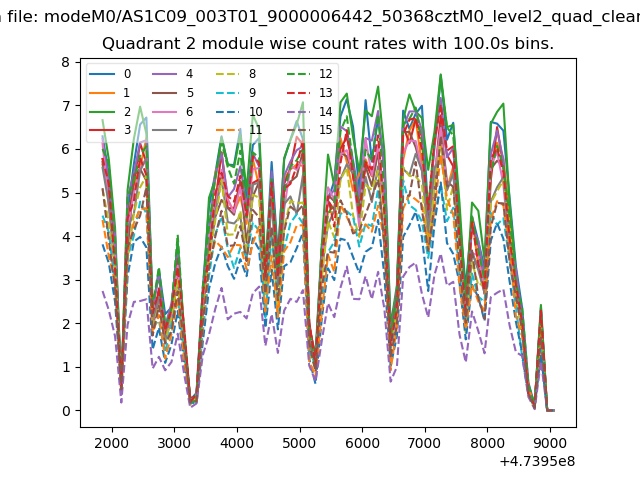
| Module-wise count rates for Quadrant B Data is divided into 100 sec bins |
 |
 |
| Module-wise count rates for Quadrant C Data is divided into 100 sec bins |
 |
 |
| Module-wise count rates for Quadrant D Data is divided into 100 sec bins |
 |
 |
| Parameter | Plot |
|---|---|
| CZT HV Monitor | 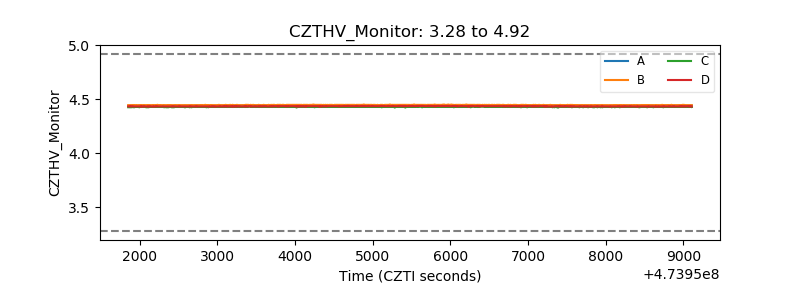 |
| D_VDD | 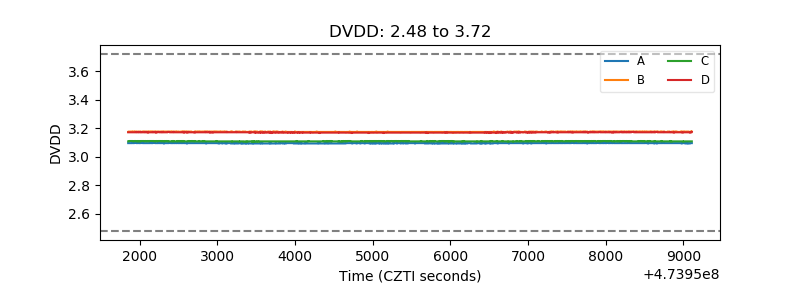 |
| Temperature 1 | 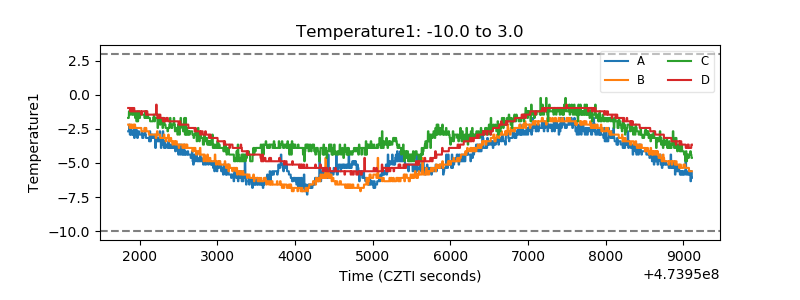 |
| Veto HV Monitor | 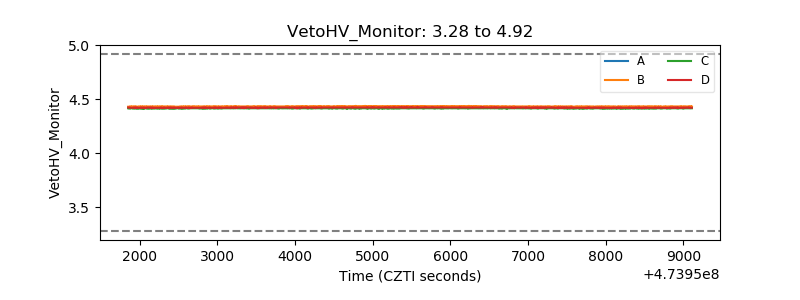 |
| Veto LLD | 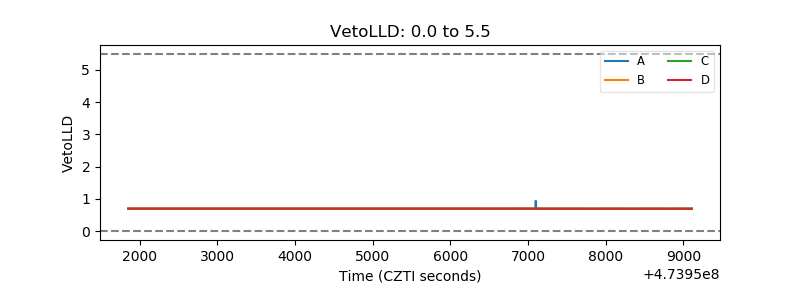 |
| Alpha Counter | 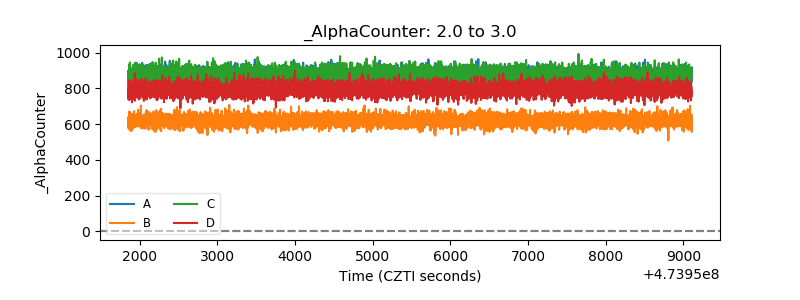 |
| _CPM_Rate | 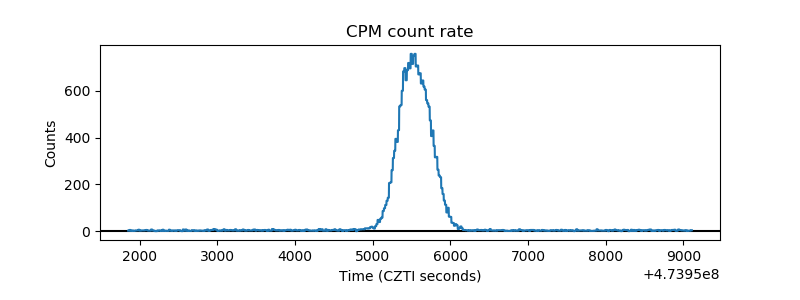 |
| CZT Counter | 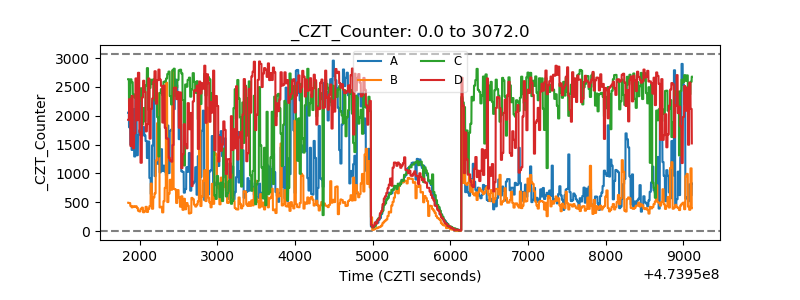 |
| +2.5 Volts monitor |  |
| +5 Volts monitor | 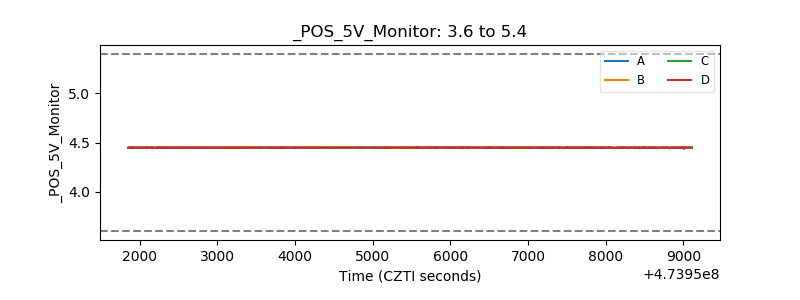 |
| _ROLL_ROT | 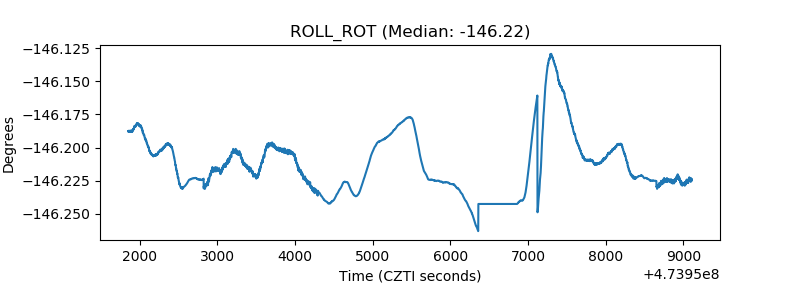 |
| _Roll_DEC | 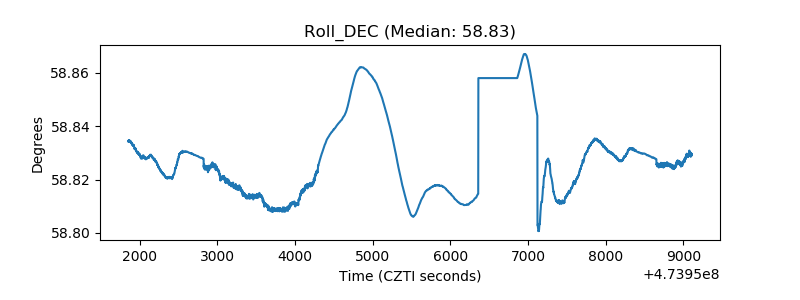 |
| _Roll_RA | 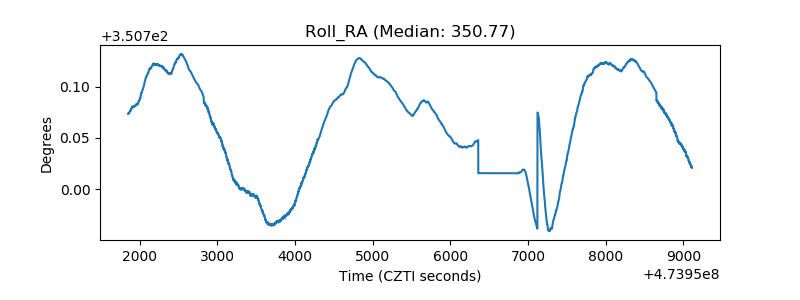 |
| Veto Counter | 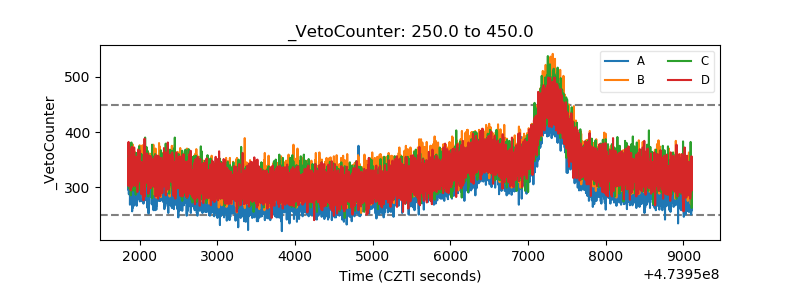 |