| Param | Original file | Final file |
|---|---|---|
| Filename | modeM0/AS1C09_003T01_9000006442_50371cztM0_level2.fits | modeM0/AS1C09_003T01_9000006442_50371cztM0_level2_quad_clean.evt |
| Size (bytes) | 2,444,757,120 | 206,432,640 |
| Size | 2.3 GB | 196.9 MB |
| Events in quadrant A | 14,715,966 | 1,588,838 |
| Events in quadrant B | 11,937,164 | 1,758,441 |
| Events in quadrant C | 25,470,389 | 1,185,537 |
| Events in quadrant D | 36,953,205 | 445,757 |
| Mode M9 | |||
|---|---|---|---|
| Quadrant | BADHDUFLAG | Total packets | Discarded packets |
| A | 0 | 15 | 0 |
| B | 0 | 15 | 0 |
| C | 0 | 15 | 0 |
| D | 0 | 15 | 0 |
| Mode M0 | |||
|---|---|---|---|
| Quadrant | BADHDUFLAG | Total packets | Discarded packets |
| A | 0 | 56190 | 3 |
| B | 0 | 48392 | 3 |
| C | 0 | 88531 | 3 |
| D | 0 | 122529 | 8 |
| Mode SS | |||
|---|---|---|---|
| Quadrant | BADHDUFLAG | Total packets | Discarded packets |
| A | 0 | 378 | 0 |
| B | 0 | 378 | 0 |
| C | 0 | 378 | 0 |
| D | 0 | 378 | 0 |
| Quadrant | Total seconds | Saturated seconds | Saturation percentage |
|---|---|---|---|
| A | 18436 | 1201 | 6.514428% |
| B | 18437 | 835 | 4.528936% |
| C | 18437 | 5118 | 27.759397% |
| D | 18436 | 13626 | 73.909742% |
Noise dominated data is calculated using 1-second bins in cleaned event files. If a bin has >2000 counts, and if more than 50% of those come from <1% of pixels, then it is considered to be noise-dominated and hence unusable.
| Quadrant | # 1 sec bins | Bins with >0 counts | Bins with >2000 counts | High rate bins dominated by noise | Noise dominated (total time) | Noise dominated (detector-on time) | Marked lightcurve |
|---|---|---|---|---|---|---|---|
| A | 19821 | 18441 | 925 | 925 | 4.67% | 5.02% | 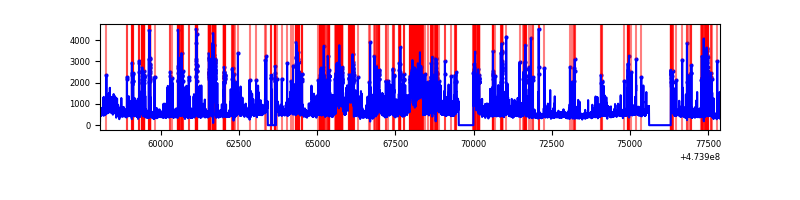 |
| B | 19822 | 18442 | 491 | 491 | 2.48% | 2.66% | 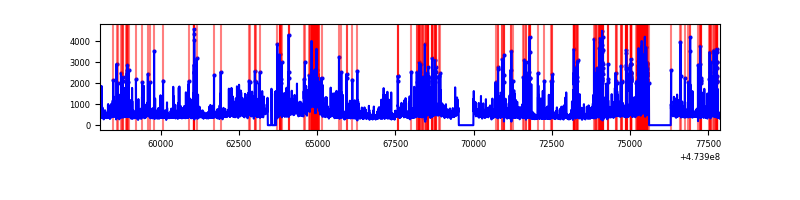 |
| C | 19822 | 18441 | 4557 | 4557 | 22.99% | 24.71% | 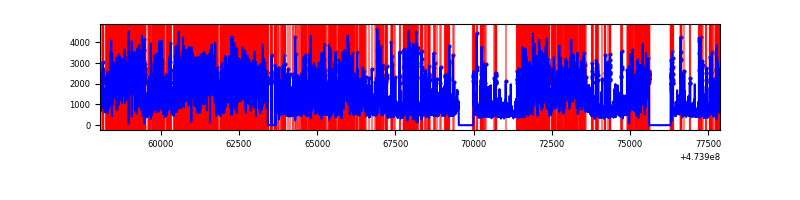 |
| D | 19821 | 18439 | 10532 | 10532 | 53.14% | 57.12% | 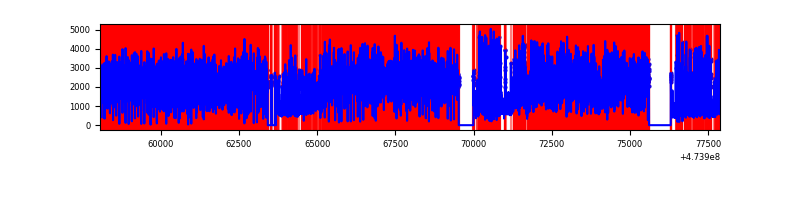 |
Top three noisy pixels from each quadrant. If the there are fewer than three noisy pixels in the level2.evt file, extra rows are filled as -1
| Pixel properties | Quadrant properties | ||||||
|---|---|---|---|---|---|---|---|
| Quadrant | DetID | PixID | Counts | Sigma | Mean | Median | Sigma |
| A | 12 | 250 | 849609 | 1754.76 | 1935 | 1884 | 483.1 |
| A | 3 | 95 | 789080 | 1629.46 | 1935 | 1884 | 483.1 |
| A | 10 | 253 | 572598 | 1181.36 | 1935 | 1884 | 483.1 |
| B | 5 | 172 | 674450 | 1644.95 | 1926 | 1856 | 408.9 |
| B | 10 | 247 | 641943 | 1565.45 | 1926 | 1856 | 408.9 |
| B | 1 | 207 | 401308 | 976.93 | 1926 | 1856 | 408.9 |
| C | 15 | 232 | 3958608 | 8102.5 | 1732 | 1722 | 488.4 |
| C | 15 | 236 | 2472246 | 5058.88 | 1732 | 1722 | 488.4 |
| C | 15 | 127 | 1644195 | 3363.29 | 1732 | 1722 | 488.4 |
| D | 7 | 61 | 18612939 | 56398.81 | 1120 | 1083 | 330.0 |
| D | 12 | 1 | 7353585 | 22280.01 | 1120 | 1083 | 330.0 |
| D | 7 | 126 | 915051 | 2769.56 | 1120 | 1083 | 330.0 |
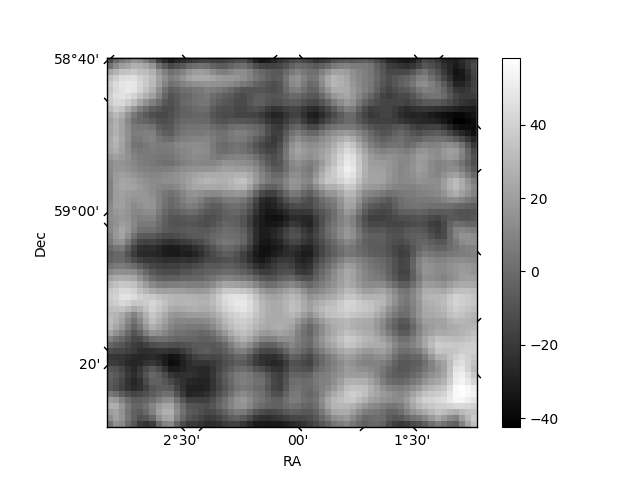
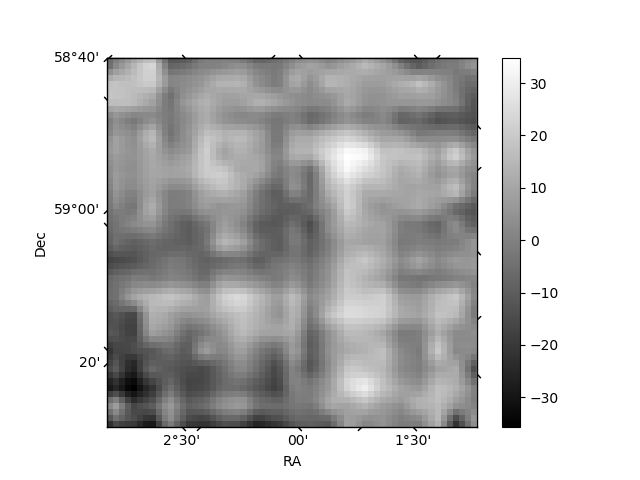
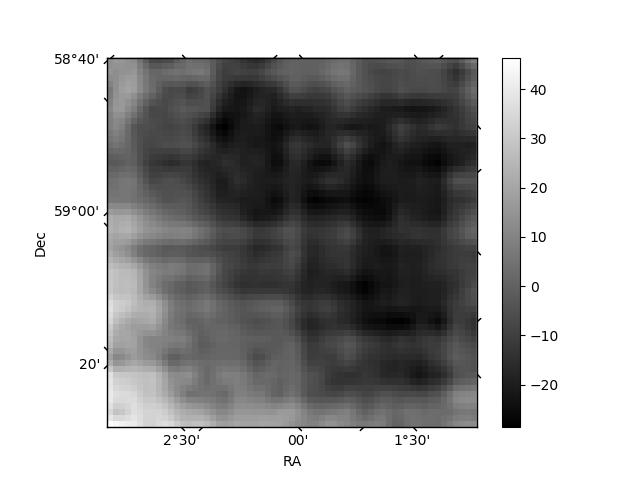
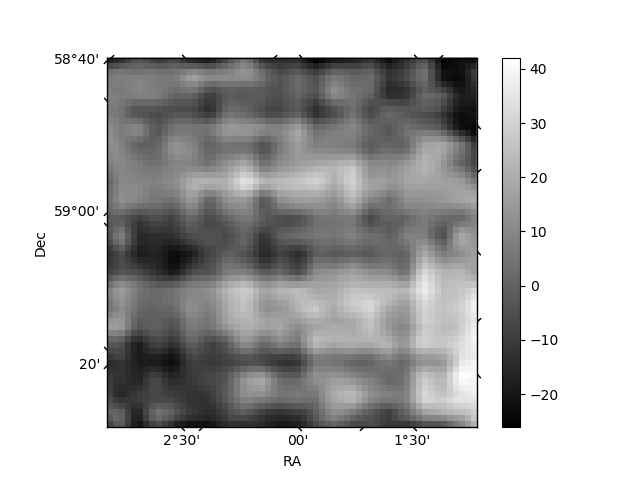
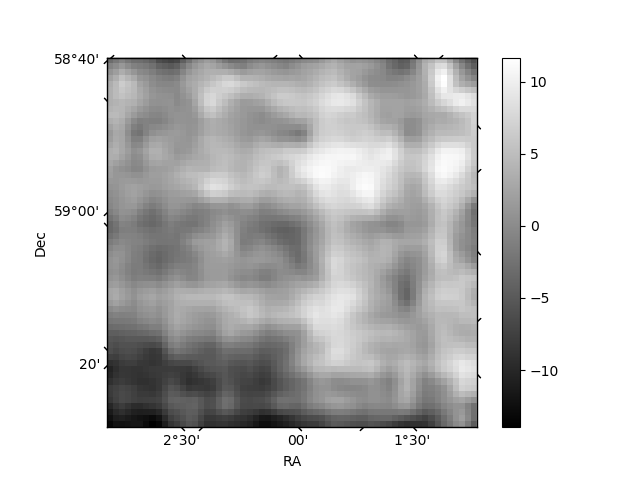
Histogram calculated using DETX and DETY for each event in the final _common_clean file
| Quadrant A | 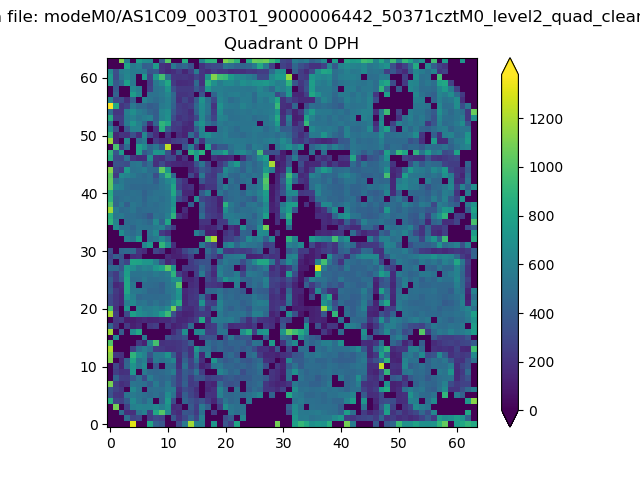 |
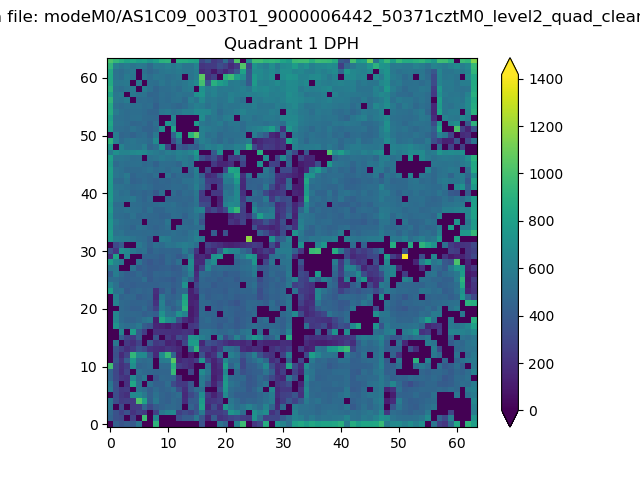 |
Quadrant B |
|---|---|---|---|
| Quadrant D | 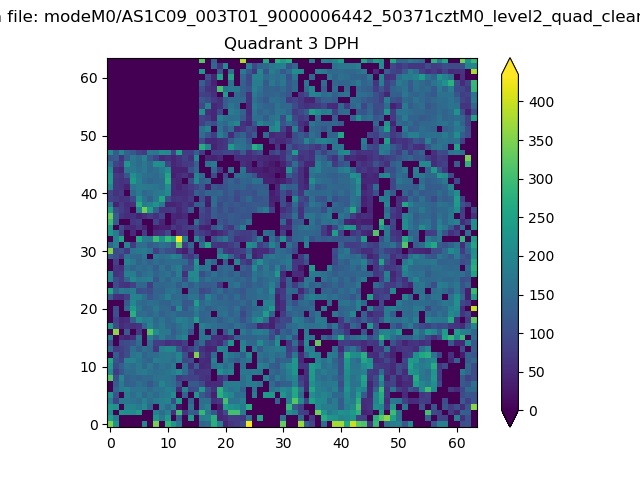 |
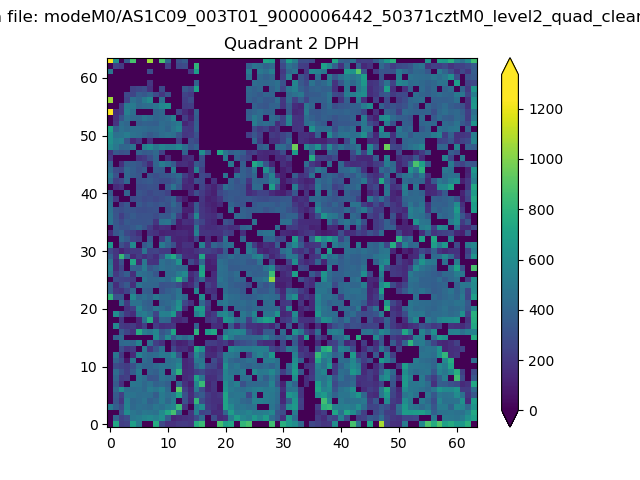 |
Quadrant C |
| Plot type | Count rate plots | Images |
|---|---|---|
| Comparison with Poisson distribution Blue bars denote a histogram of data divided into 1 sec bins. Red curve is a Poisson curve with rate = median count rate of data. |
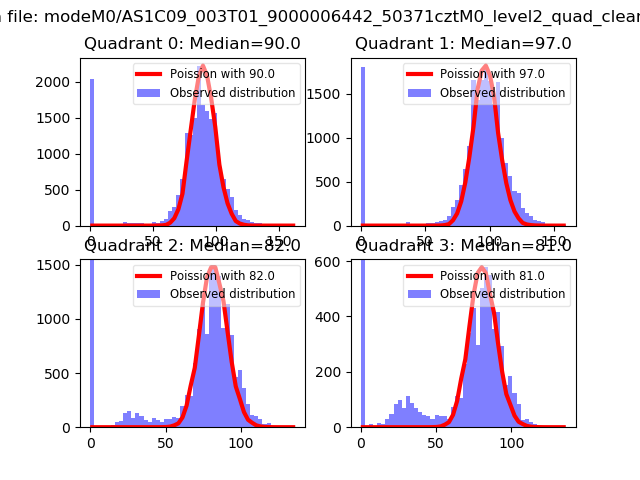 |
 |
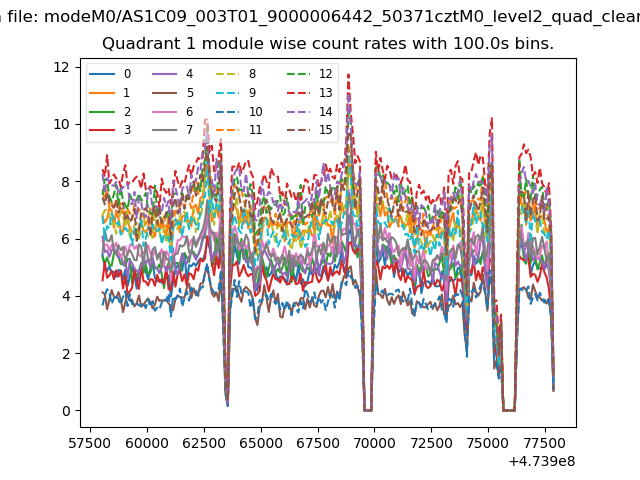
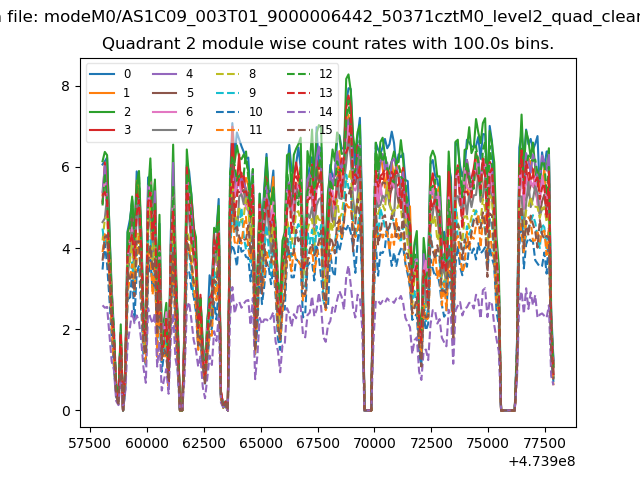
| Quadrant-wise count rates Data is divided into 100 sec bins |
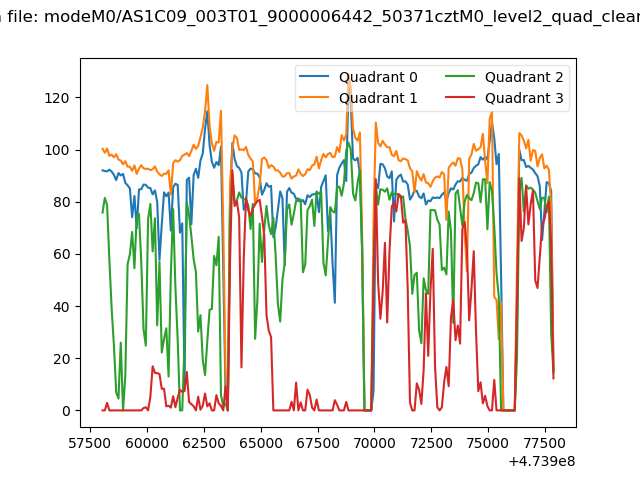 |
|
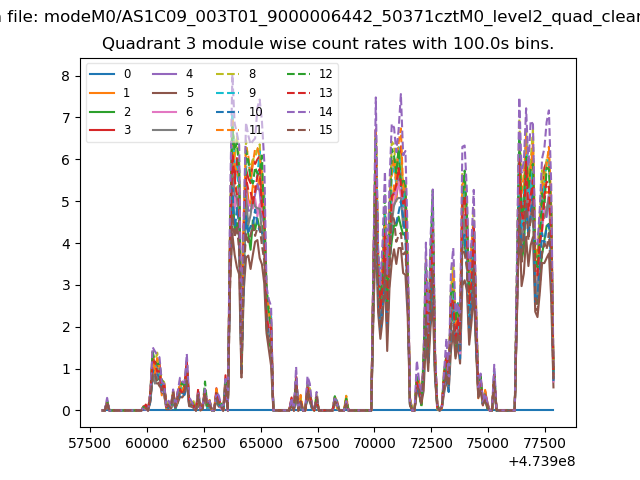
| Module-wise count rates for Quadrant A Data is divided into 100 sec bins |
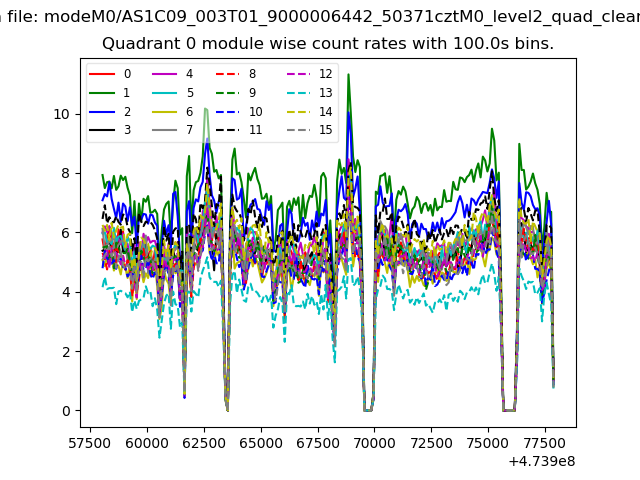 |
 |
| Module-wise count rates for Quadrant B Data is divided into 100 sec bins |
 |
 |
| Module-wise count rates for Quadrant C Data is divided into 100 sec bins |
 |
 |
| Module-wise count rates for Quadrant D Data is divided into 100 sec bins |
 |
 |
| Parameter | Plot |
|---|---|
| CZT HV Monitor | 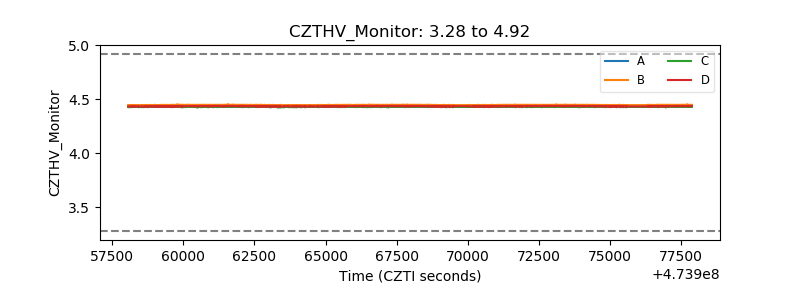 |
| D_VDD | 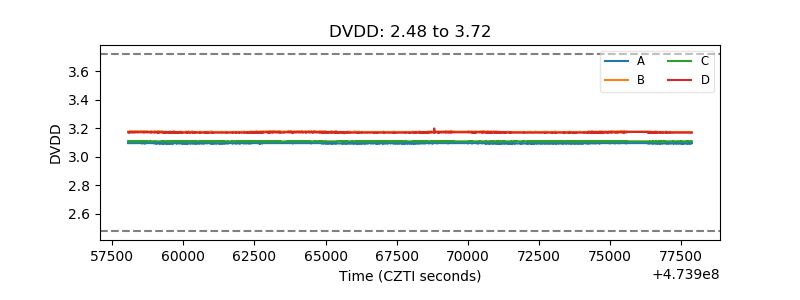 |
| Temperature 1 | 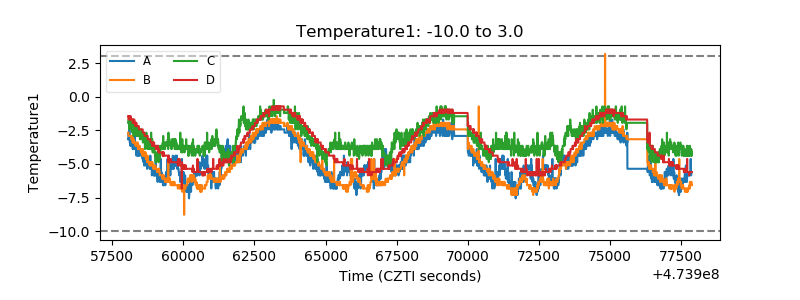 |
| Veto HV Monitor | 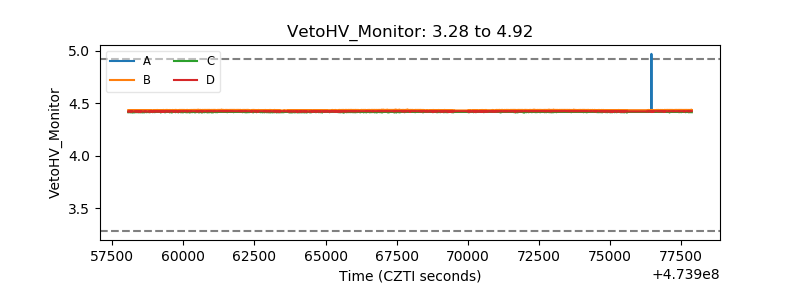 |
| Veto LLD |  |
| Alpha Counter | 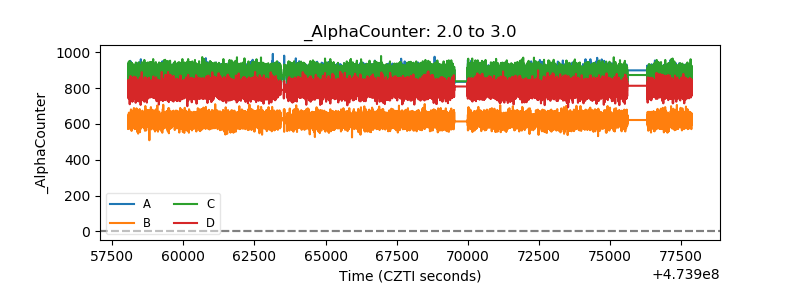 |
| _CPM_Rate | 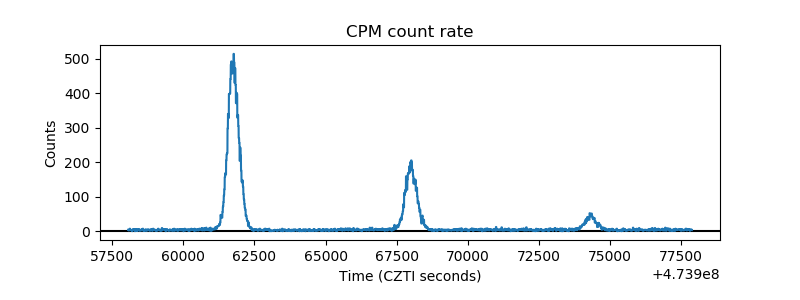 |
| CZT Counter | 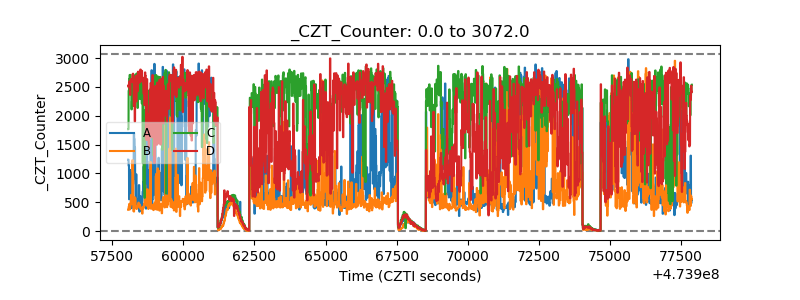 |
| +2.5 Volts monitor | 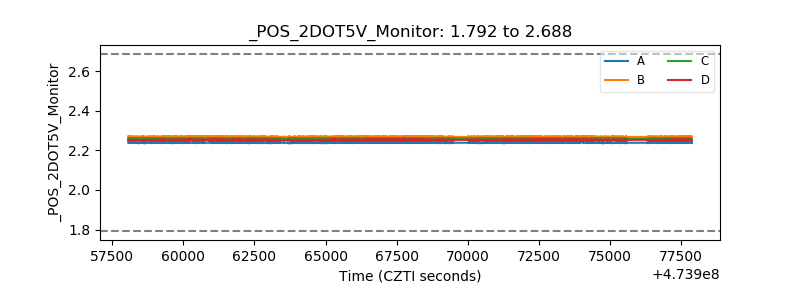 |
| +5 Volts monitor |  |
| _ROLL_ROT | 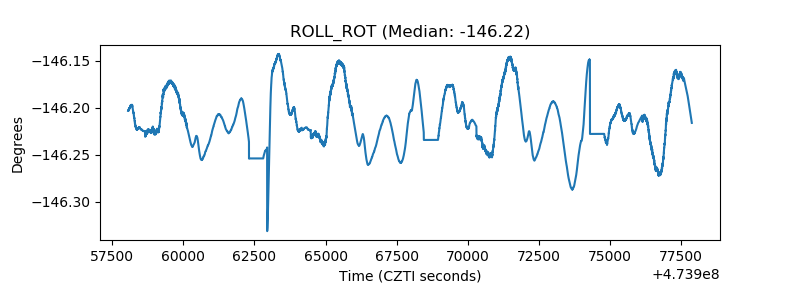 |
| _Roll_DEC | 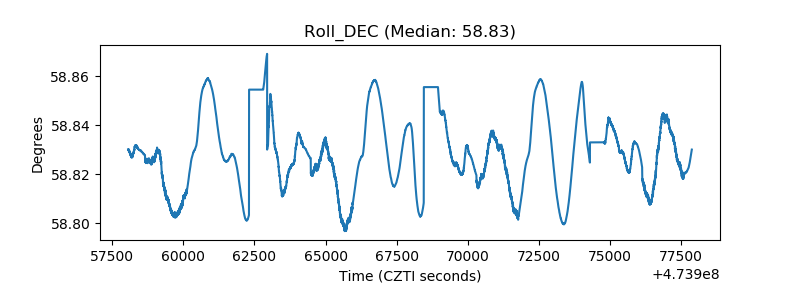 |
| _Roll_RA | 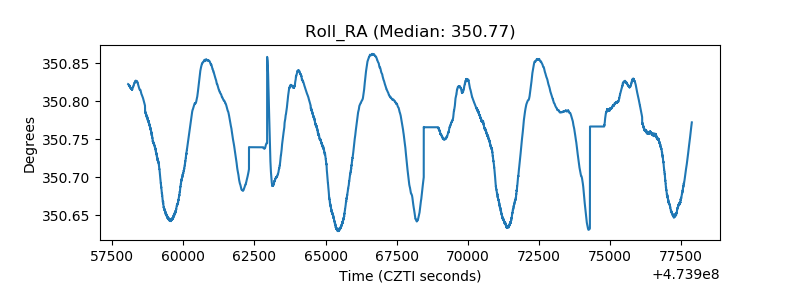 |
| Veto Counter | 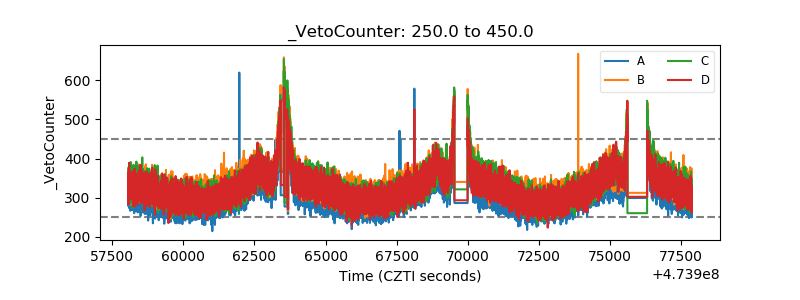 |